Monitoring Breakouts in Tech – Utes Set Up – Housing Holds Breakout – Banks/Retail Lead
Posted By
Arthur Hill, CMT
On
In
Archive |
No Comments
Headlines
Evidence Remains Bullish with Improving Breadth
SPY Stalls Near Prior High
QQQ, XLK and MAGS are Lagging
AI ETFs Form Lower Highs
Semis Lead within Tech, but Not Immune
Healthcare SPDR Continues to Lead
Utilities SPDR Firms after Becoming Oversold
Housing ETFs Battle to Hold Breakouts
Bank ETFs Hit New Highs
Retail SPDR Extends on Breakout
Aerospace & Defense ETF Breaks Out
Other Break Out and Re-evaluation Levels
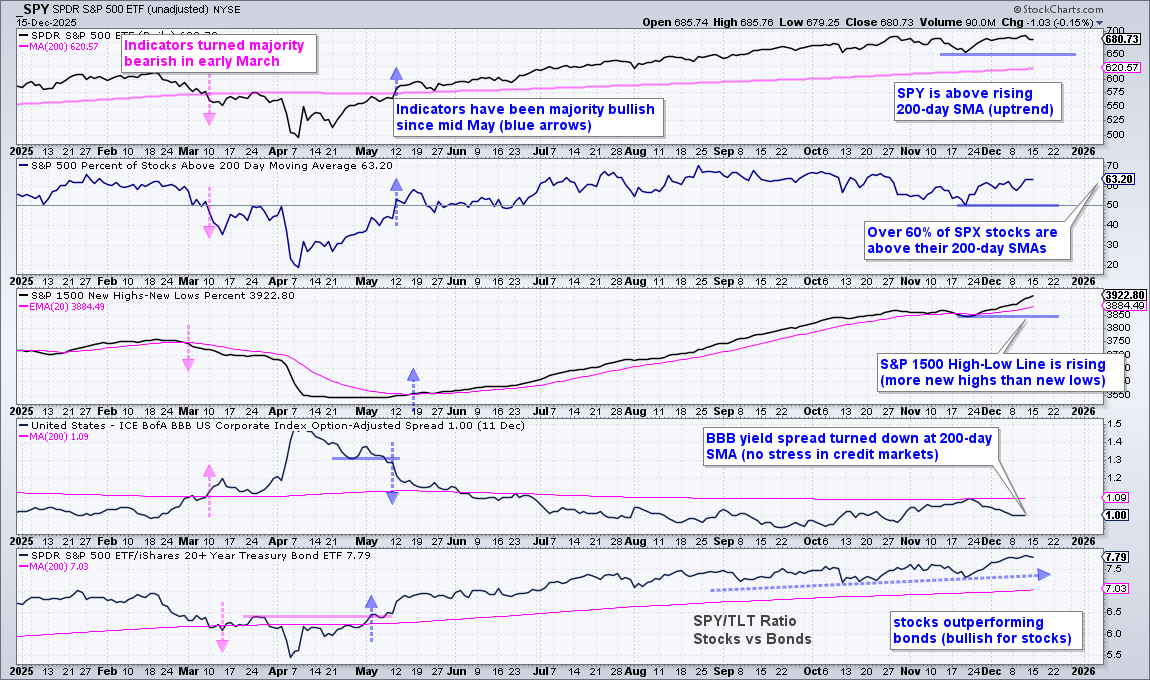
Evidence Remains Bullish with Improving Breadth
The weight of the evidence is bullish for stocks. SPY is trading less than 1.5% below its 52-week high and well above the rising 200-day SMA. This means there is a long-term uptrend in the most important benchmark for US stocks. Within the S&P 500, 63% of component stocks are trading above their 200-day SMAs, which means the vast majority of stocks are in long-term uptrends. This indicator is also at its highest level since October.
The middle window shows the S&P 1500 High-Low Line turning back up in late November and rising throughout December, which means new highs are outpacing new lows. This is also a sign of improving breadth. In the credit markets, the BBB spread turned down the last few weeks and shows no stress. Stocks (risk assets) are also outperforming bonds (safe havens). All in all, there are more signs of strength than weakness.
SPY Consolidates Near October High
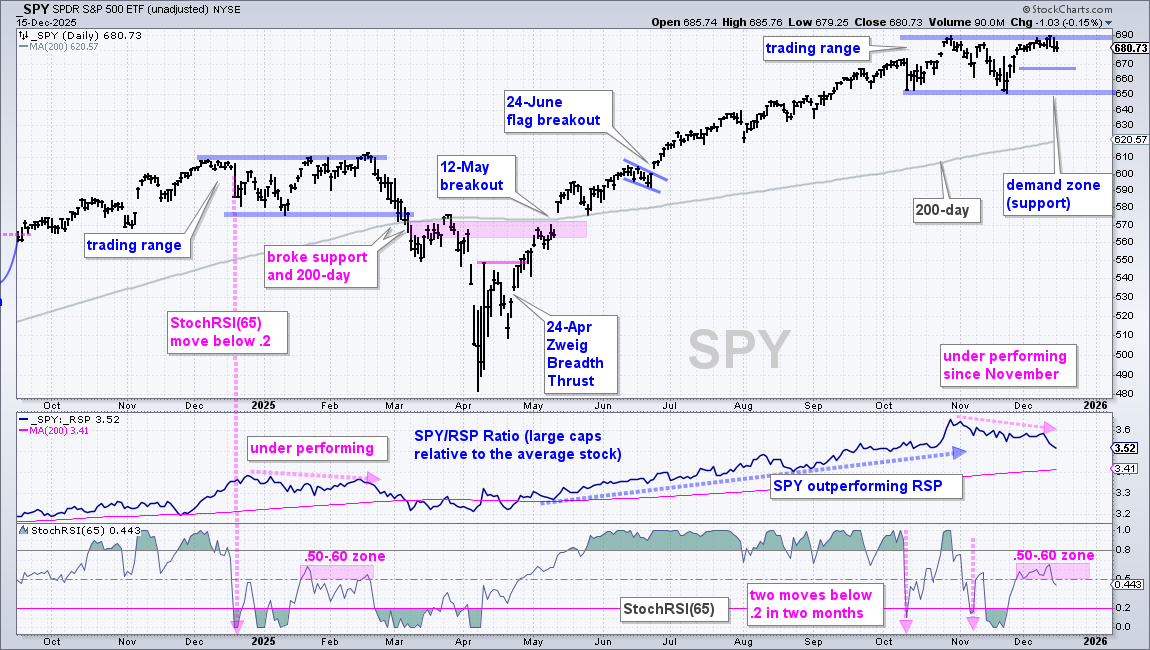
SPY advanced to a new high in late October and then moved into a trading range. Overall, SPY has traded sideways since October with support at 650 and resistance at 690. Note that I would not call this a major resistance level and I am not considering a Double Top at this stage. Why? Because the long-term trend is up and the weight of the evidence is bullish. Resistance levels are major hurdles in downtrends, not uptrends. In uptrends, we expect prior highs (“resistance”) to be broken and we expect support levels to hold. A break below 650 would show an uptick in selling pressure and I would then consider a Double Top. Let’s cross that bridge when and if it gets there.
Despite an uptrend and bullish evidence, there are two bearish momentum thrusts since October. This occurs when StochRSI(65) moves from above .80 to below .20 (pink arrows). The last one occurred in early October and StochRSI has yet to recover with a move above .80. Notice that StochRSI plunged below .20 in December 2024 and then stalled out in the .50 to .60 zone in January-February (pink shading). StochRSI is currently stalling out in this zone and broke below .50 (mid point) on Monday.
The current situation is eerily similar to what we saw from December 2024 to February 2025. SPY was in an uptrend in February with price above the rising 200-day and a new high on February 20th. Despite the new high, StochRSI never fully recovered and SPY ultimately broke support in early March. Short-term, a close below 668 (thin blue line) would provide the first sign of weakness on the price chart. I would then entertain thoughts of a Double Top, which would be confirmed with a break below 650 support.
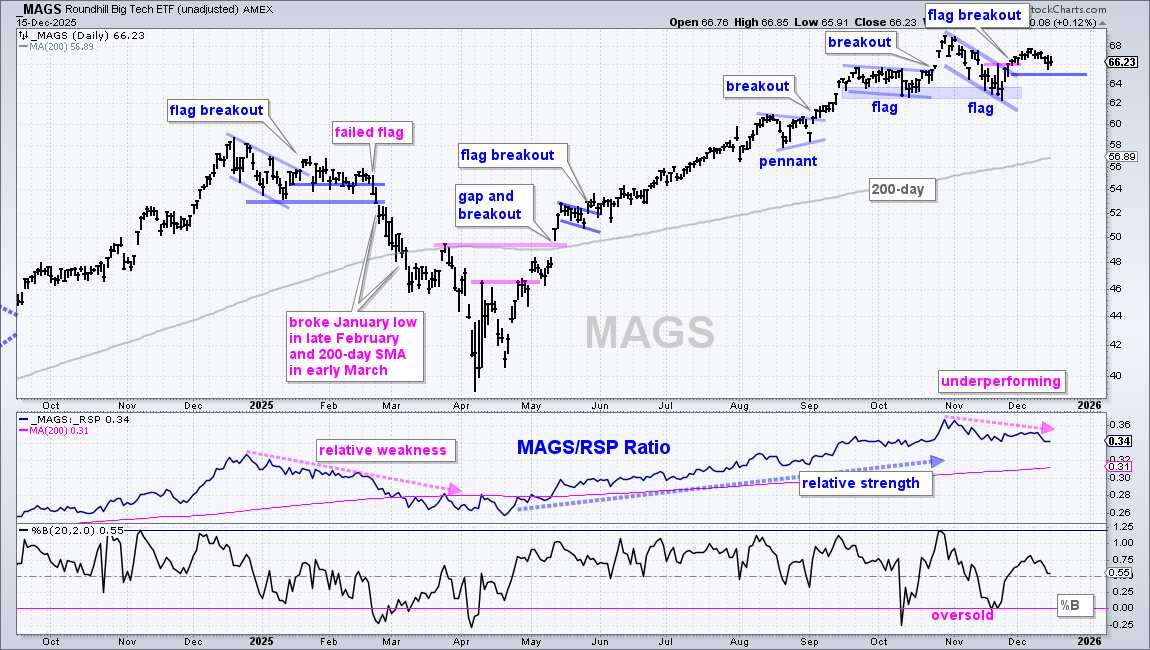
QQQ, XLK and MAGS are Lagging - But Flag Breakouts Hold
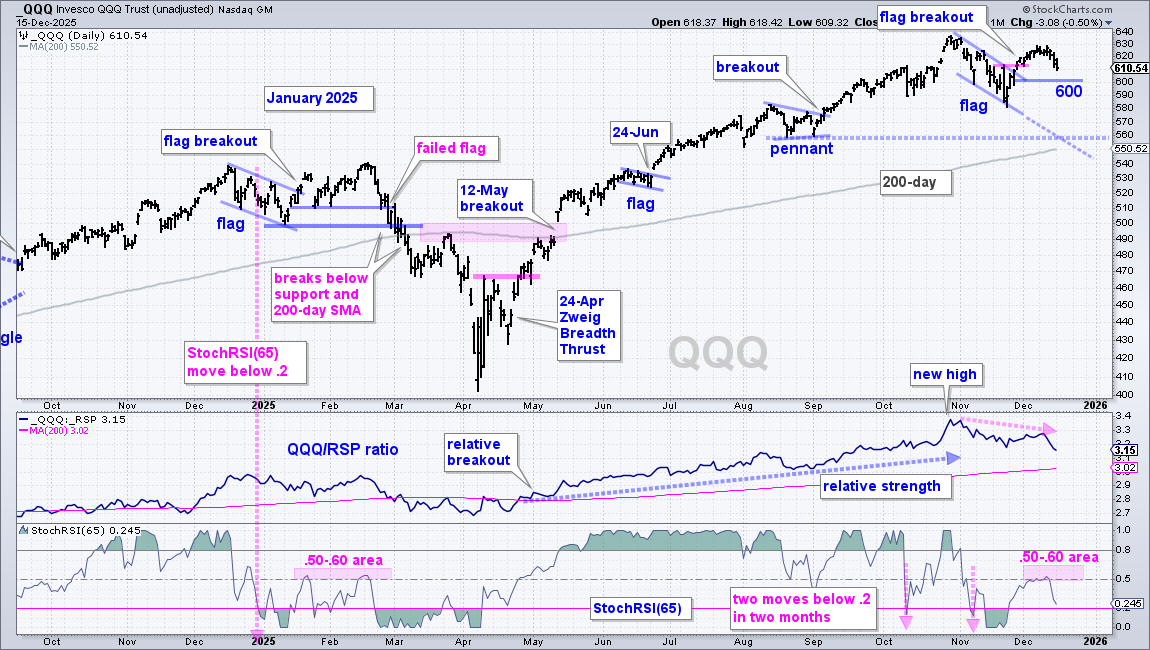
While SPY trades near its October high, QQQ fell well short of its October high and the flag breakout is looking dicey. QQQ formed a flag into November and broke out with a surge during Thanksgiving week. A strong breakout should hold, which makes the 600 level key here. A break below 600 would negate the breakout and argue for a deeper correction. The blue dashed lines show the lower flag extension and the August lows in the 550-560 area. We also have the rising 200-day SMA coming into play here. Should the flag breakout fail, I would target a correction towards this area.
The bottom window shows StochRSI(65) with bearish momentum thrusts in October and November. StochRSI rebounded to the .50-.60 zone in December and stalled (pink shading). This zone also acted as momentum resistance in January-February.
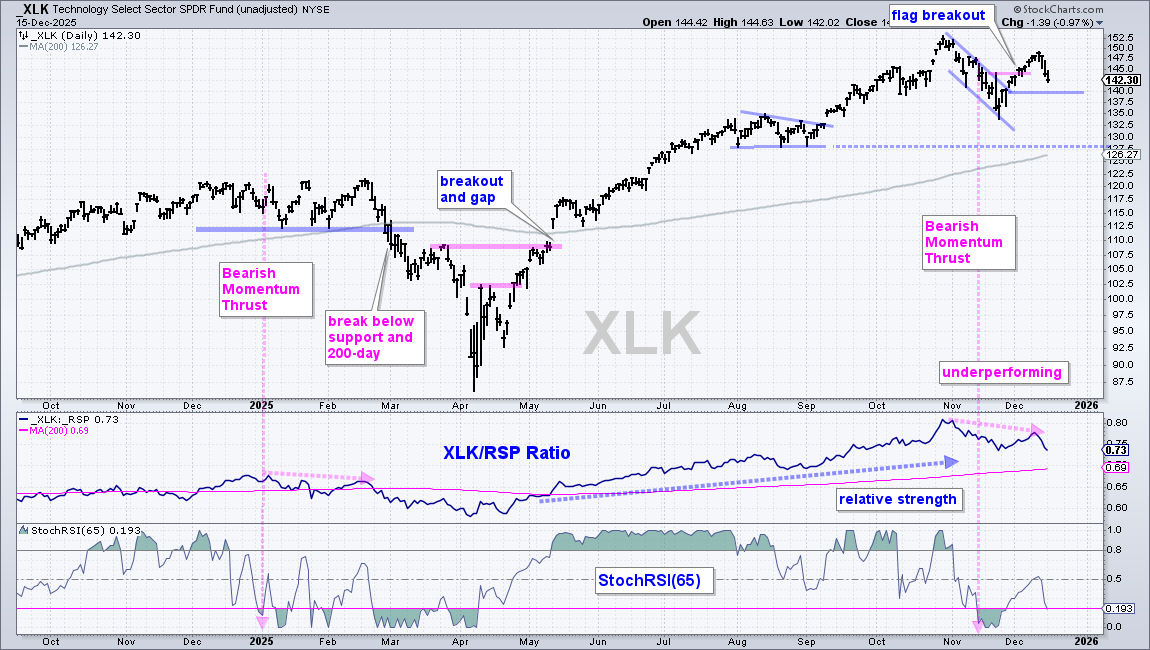
The next chart shows XLK with a flag breakout and the re-evaluation level at 140.
The next chart shows the Mag7 ETF (MAGS) with a flag breakout and the re-evaluation level at 65.
AI ETFs Form Lower Highs
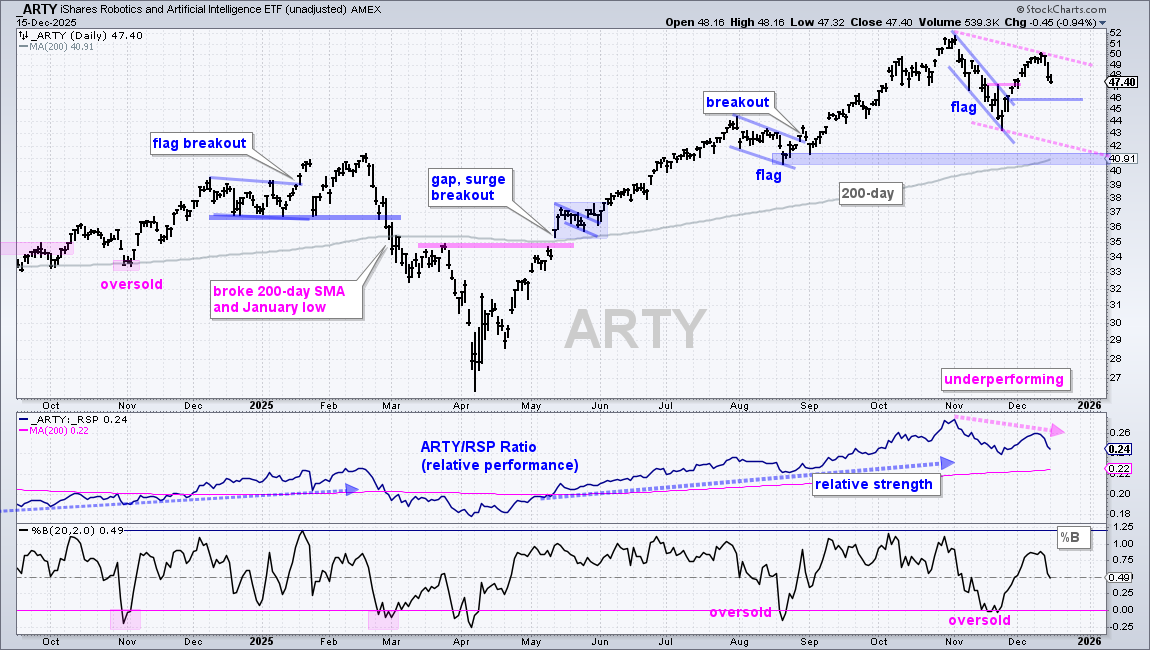
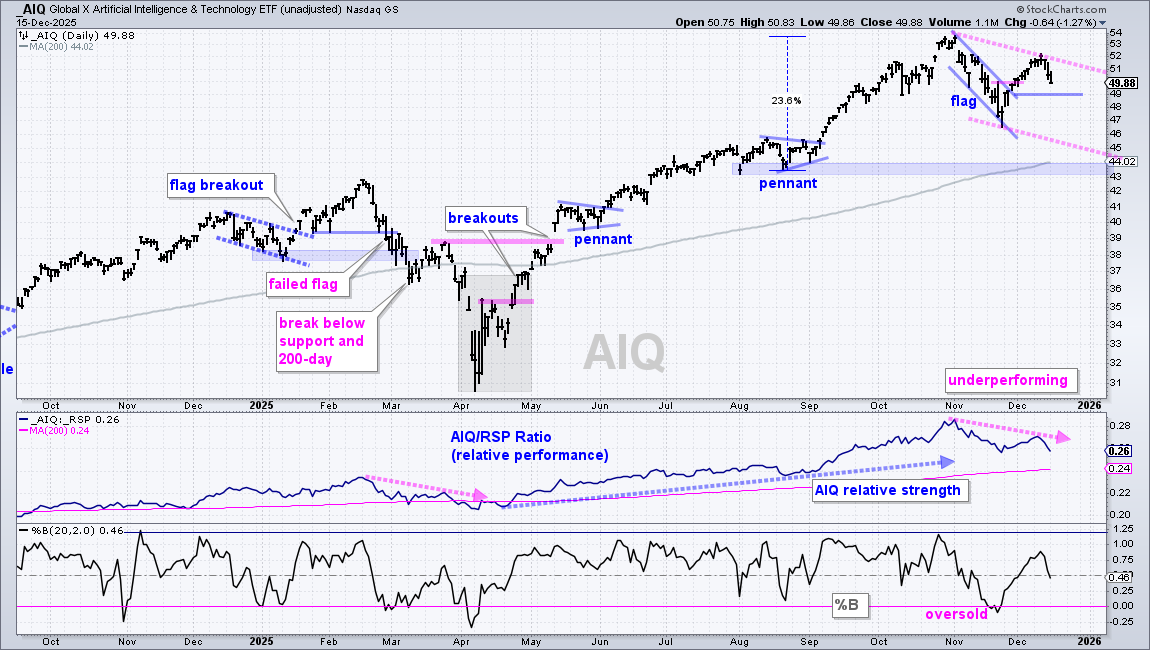
The AI ETFs, Robotics AI ETF (ARTY) and Global AI & Tech ETF (AIQ), also sport flag breakouts. As with XLK, these two followed through on their flag breakouts in early December, but turned down the last three days, which means lower highs are possible (pink dashed lines). The first chart shows ARTY with the flag breakout and re-evaluation level at 46. A failed breakout would target a move towards the 200-day SMA and August lows in the 40-41 area.
The next chart shows AIQ with a flag breakout and re-evaluation level at 49.
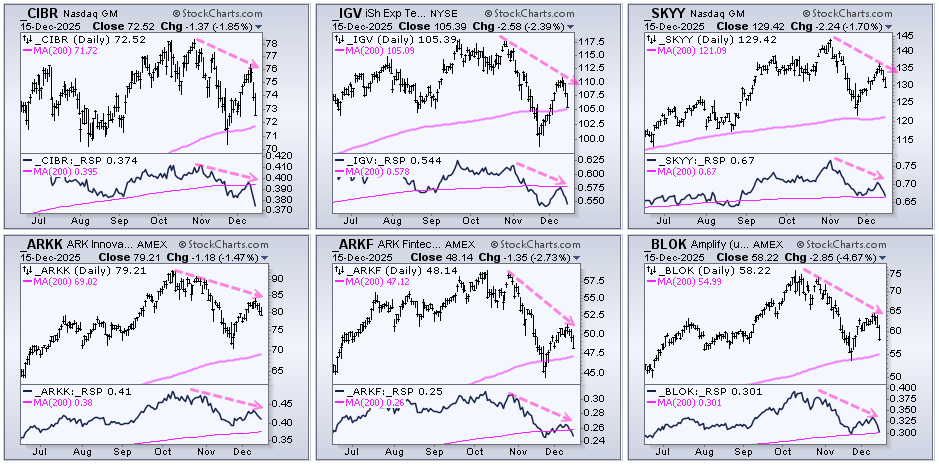
The CandleGlance chart below shows the lagging tech ETFs. These include the Cybersecurity ETF (CIBR), Software ETF (IGV), Cloud Computing ETF (SKYY), ARK Innovation ETF (ARKK), ARK Fintech Innovation ETF (ARKF) and Transformational Data Sharing ETF (BLOK). SKYY peaked in November, but the other five peaked in October. They all formed lower highs and their price-relatives (lower windows) fell sharply the last six weeks (relative weakness).
Semis Lead within Tech, but Not are Immune
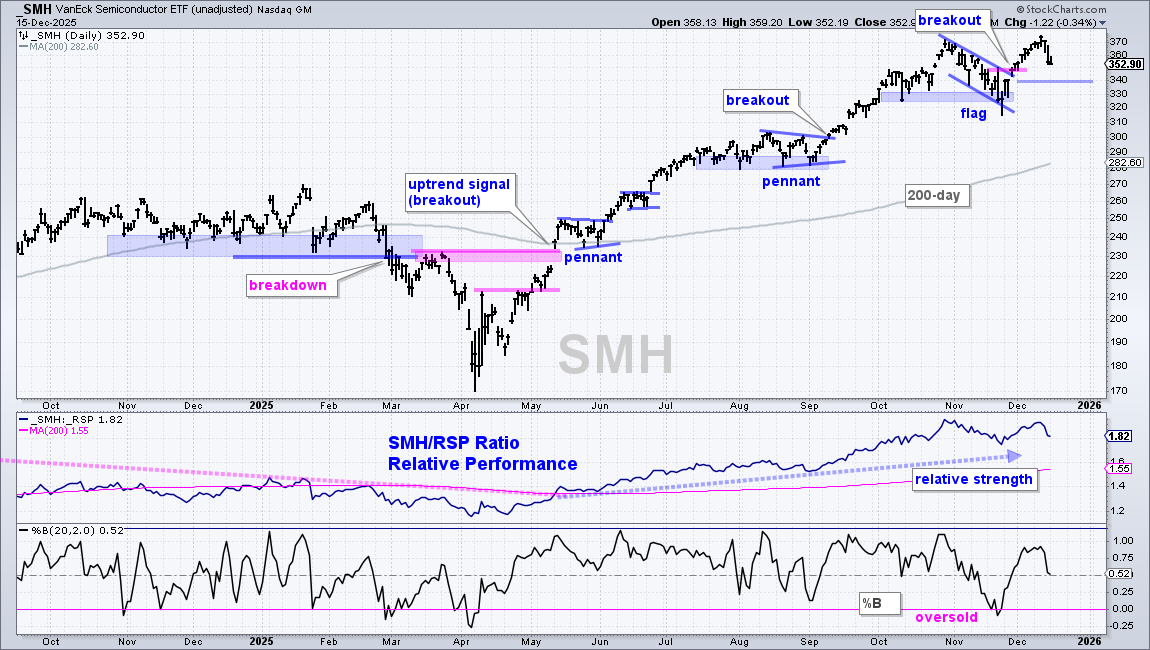
The Semiconductor ETF (SMH) and Semiconductor ETF (SOXX) are the strongest of the tech-related ETFs because they both hit new highs in December. However, semis are unlikely to be immune to weakness within the tech sector. SMH and SOXX are still positively correlated and would likely fall should XLK and QQQ correct further. The first chart shows SMH with a flag breakout in late November and a new high last week. The flag re-evaluation level is set at 340.
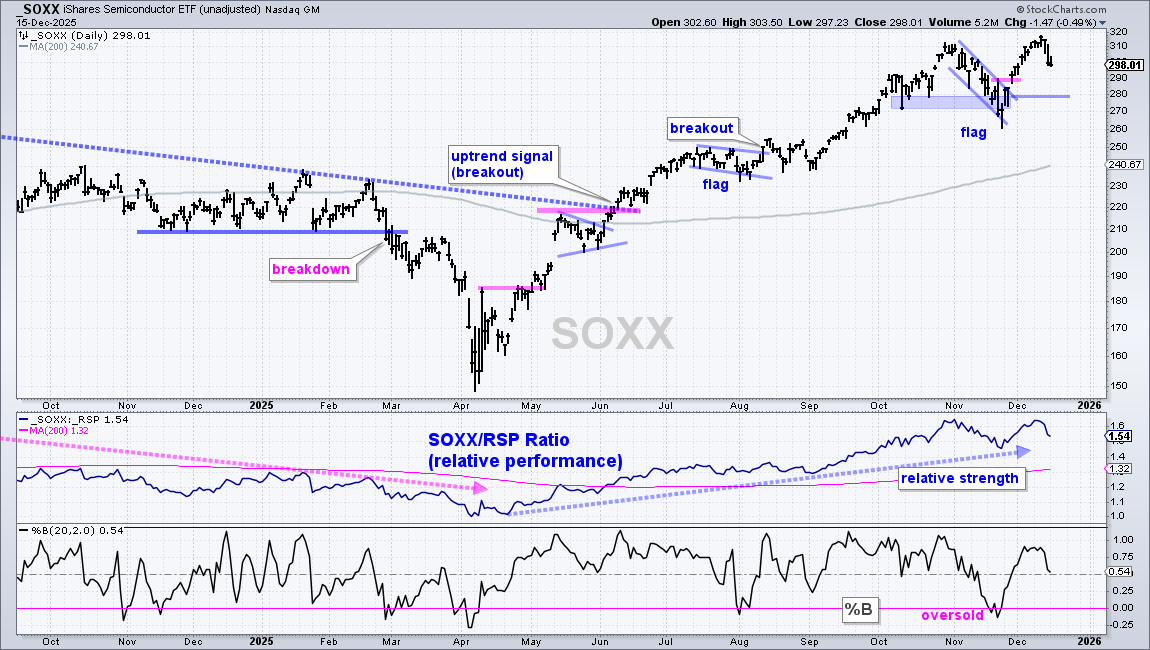
The next chart shows SOXX with a flag breakout and the re-evaluation level at 280.
Healthcare SPDR Continues to Lead
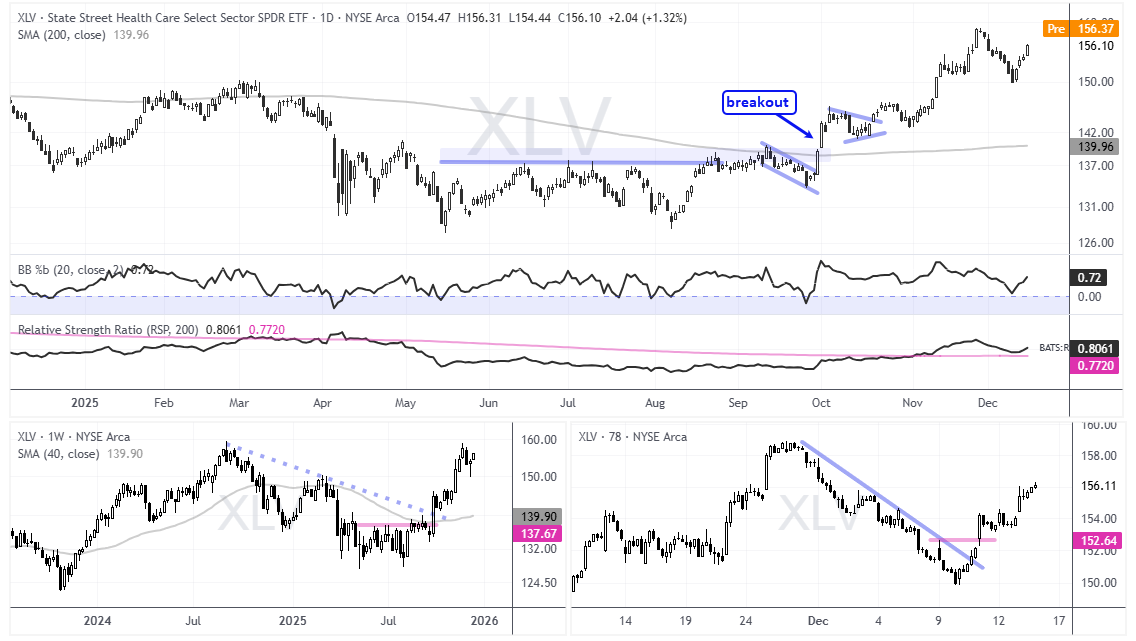
The Healthcare SPDR (XLV) remains a leader since October, which is when it surged above the September highs (blue shading). XLV extended above 158 in late November, fell sharply into early December and rebounded with a 4% surge the last four days. I viewed the decline to 150 as a correction within an uptrend, but did not draw a falling flag or mark the moderately oversold condition last week. In such situations, it can help to view three different timeframes. The TradingView chart shows daily prices on top, weekly in lower left and 78-minute in the lower right. Chartists can use the daily and weekly charts to define the bigger trends, which were clearly up. The 78 minute chart is used for timing short-term reversals. Notice that XLV broke out at 152.64 with a surge on December 11th.
Utilities SPDR Firms after Becoming Oversold
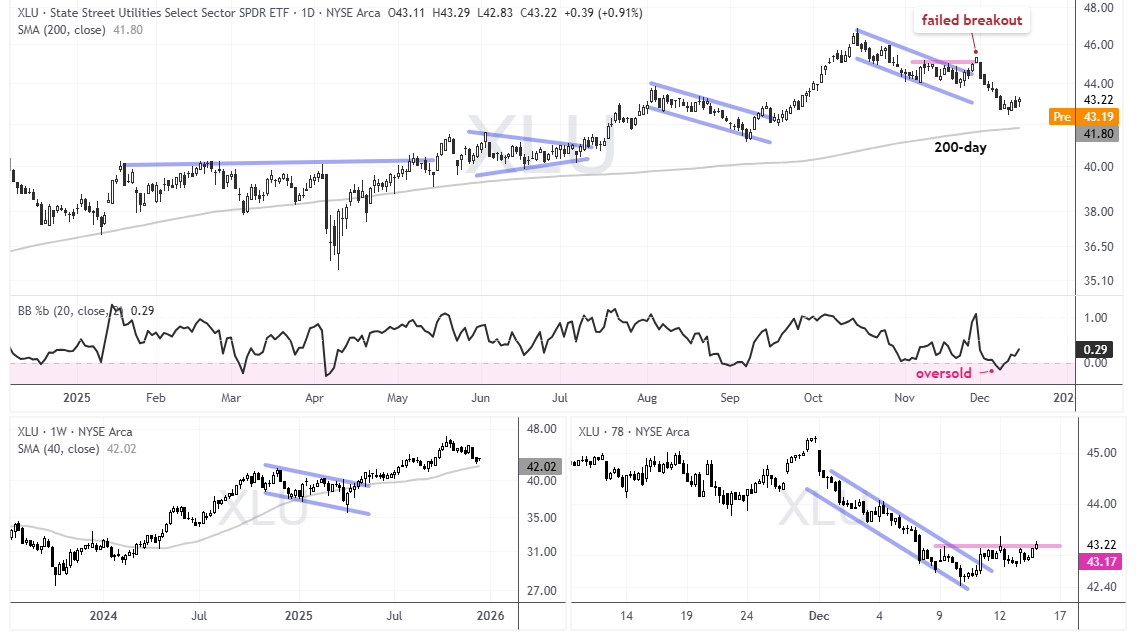
We can apply this three timeframe methodology to the Utilities SPDR (XLU). First, XLU is in an uptrend with a new high in October and price above the rising 200-day SMA. XLU is underperforming the last two months, but is on my radar because it became oversold within the uptrend. XLU is also just above the rising 200-day, which is an area to watch for corrections to end. The indicator window shows %B dipping below 0 last week. The 78 minute chart defines the December decline with resistance marked at 43.17, the December 9th high. XLU is attempting to break out here and reverse the short-term slide.
Housing ETFs Hold Breakouts
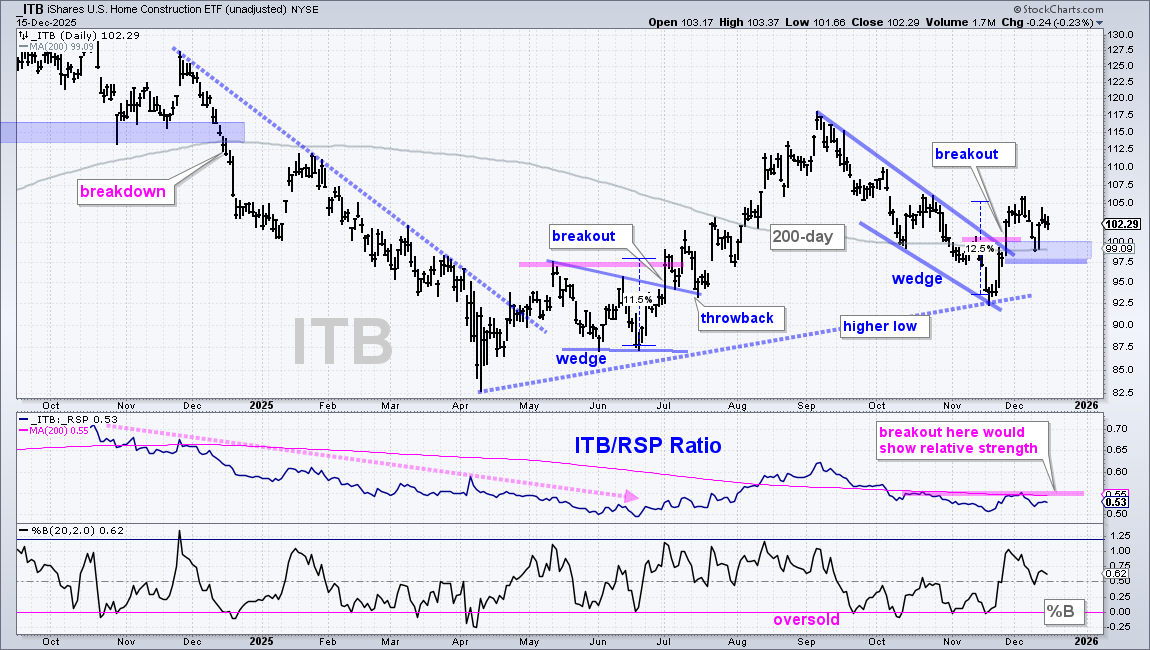
The Home Construction ETF (ITB) successfully tested its breakout zone with a bounce back above 100. Long-term, ITB formed a higher low from April to November and broke wedge resistance with an outsized surge (12.5%) in late November. Notice the June breakout also occurred with an outsized surge (11.5%) and there was a throwback in July. The current breakout zone is in the 98-100 area (blue shading). Here we also have the flat 200-day SMA. ITB broke out, returned to the breakout zone with a throwback and reinforced support here with last week’s bounce. I consider this a valid breakout as long as ITB holds 97.
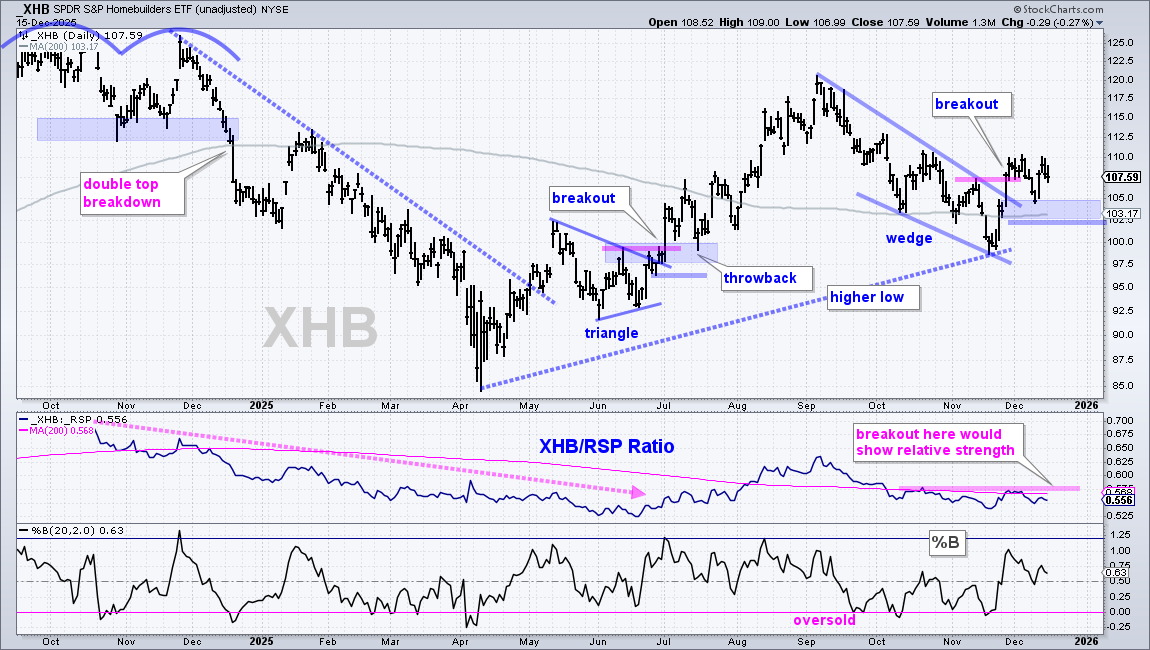
The next chart shows The Homebuilders ETF (XHB) with a wedge breakout in late November and re-evaluation support at 102.
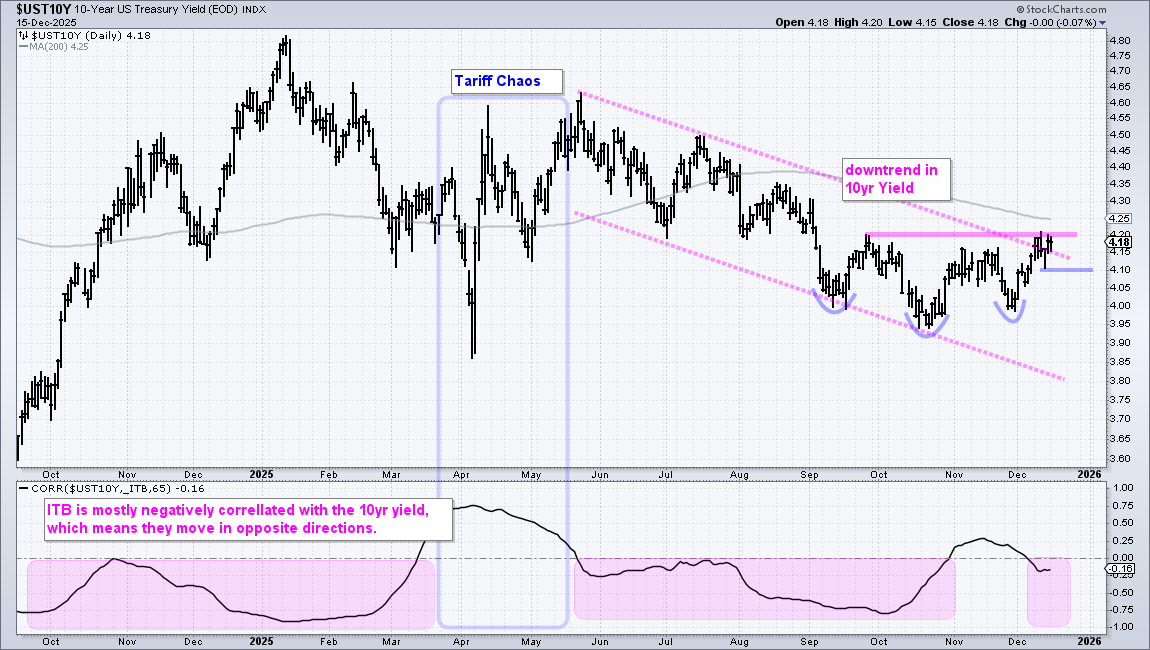
I continue to watch the 10yr T-Yield ($UST10Y) for clues on ITB because these two are negatively correlated for the most part. An inverse head-and-shoulders formed from September to December and a breakout at 4.20% would reverse the downtrend. This would argue for higher rates and be negative for housing. For now, the 10yr yield is at resistance and this is a moment of truth. Failure to break out and a move below 4.10% would be positive for housing.
Bank ETFs Hit New Highs
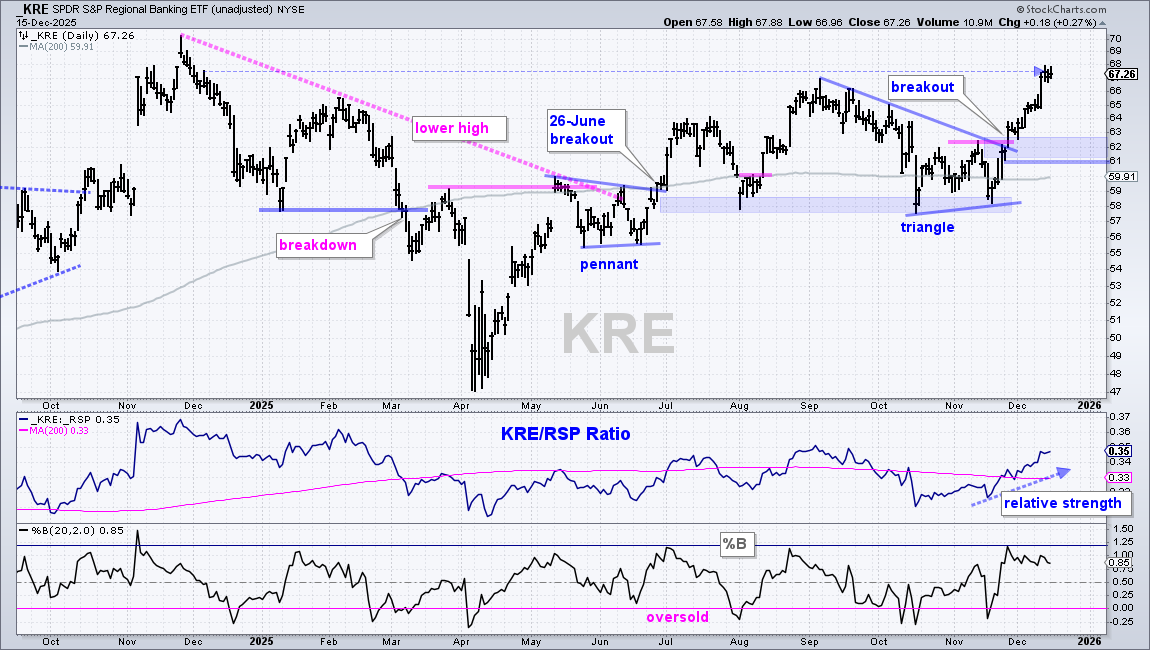
The Regional Bank ETF (KRE) started leading in late November and remains a leader with a 52-week high last week. Last week’s high is just above the high from December 6th, 2024 (blue arrow line). KRE advanced from April to August, corrected from September to November with a triangle and broke out with a surge in late November. Just as important, KRE followed through on this surge with further gains into mid December. The ETF is short-term extended, but still strong. The breakout zone in the 62 area turns first support. Key support is set at 61.
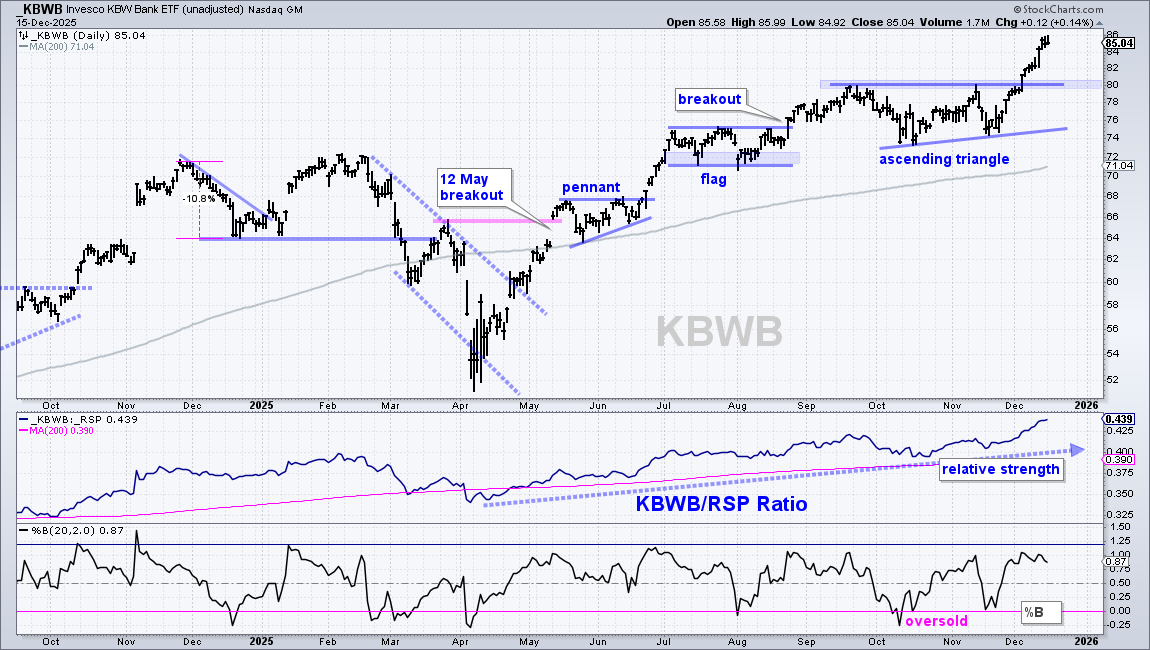
The KBW Bank ETF (KBWB) is leading within the banking group with new highs the last two weeks. KBWB broke out in early December and the breakout zone turns first support to watch in the 80 area (blue shading). A throwback to this area would offer a second chance to partake in the breakout.
Retail SPDR Extends on Breakout
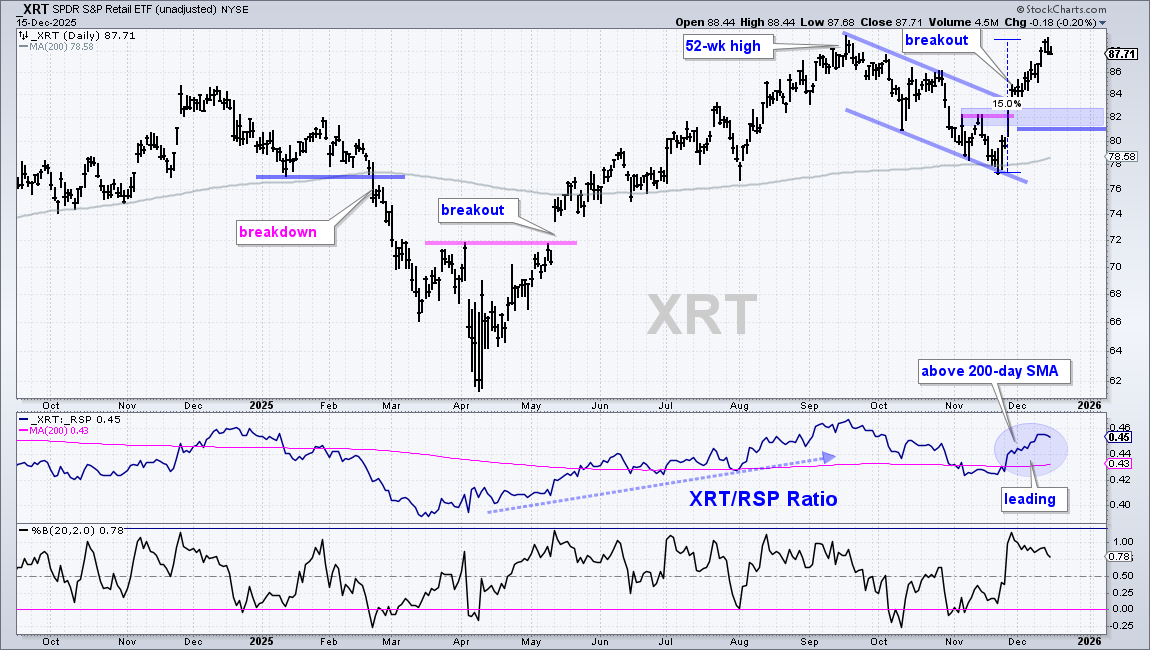
The Retail SPDR (XRT) forms the third leg of this strong troika (housing, banks, retail). All three groups came alive in late November and extended higher into mid December. XRT broke channel resistance and surged to its September high. Short-term, XRT is extended after a 15% surge the last few weeks. Although not guaranteed, this condition increases the chances for a pullback or consolidation to digest the gains. The breakout zone is around 82, but I suspect XRT might find support a little higher, perhaps 84ish.
Aerospace & Defense ETF Breaks Out
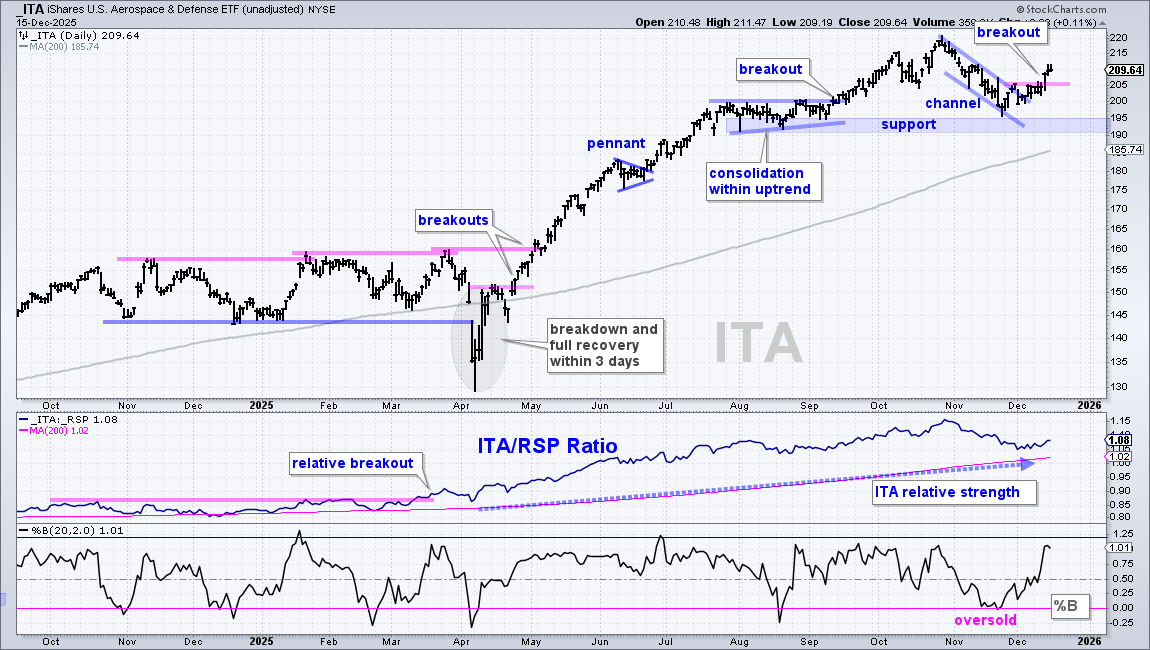
The Aerospace & Defense ETF (ITA) was featured on December 4th and December 9th as it corrected within a leading uptrend. ITA hit a new high in October and remains well above its rising 200-day SMA. A small falling channel formed in November and the ETF broke out with a surge above 205. The August-November lows mark a support zone in the 190-195 area. A close below 190 would call for a re-evaluation.
Other Breakouts and Re-evaluation Levels
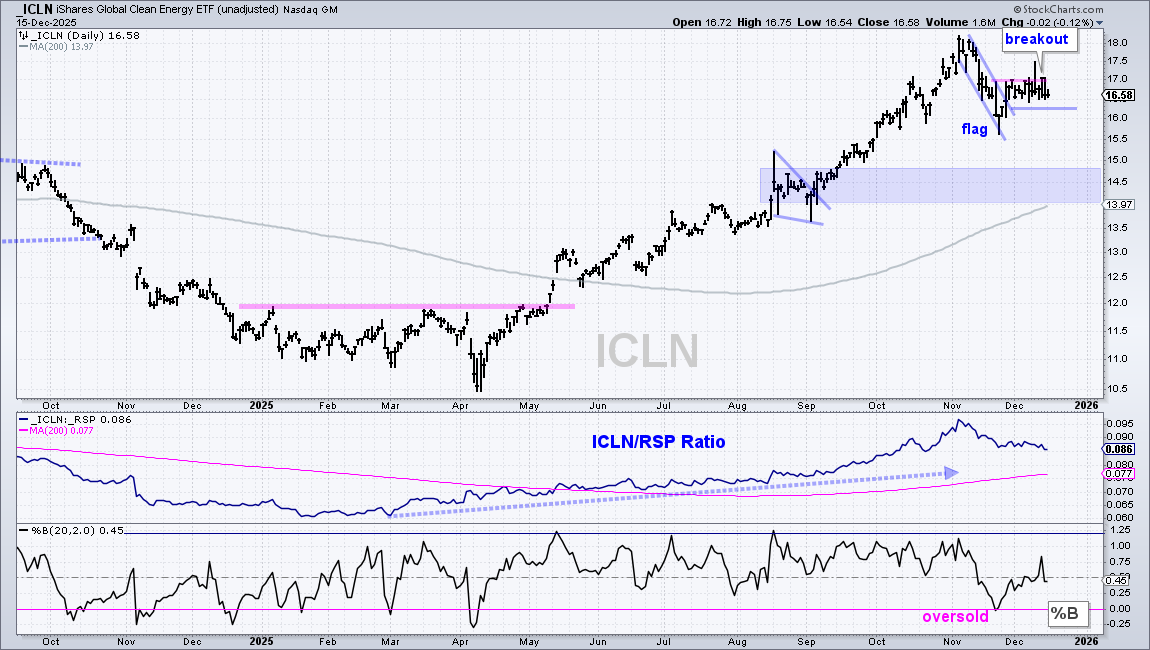
The Global Clean Energy ETF (ICLN) broke out with a close above 17 last week and a move below 16.20 would negate this breakout. This would not reverse the long-term uptrend, but argue for a deeper correction towards support in the 14.50 area.
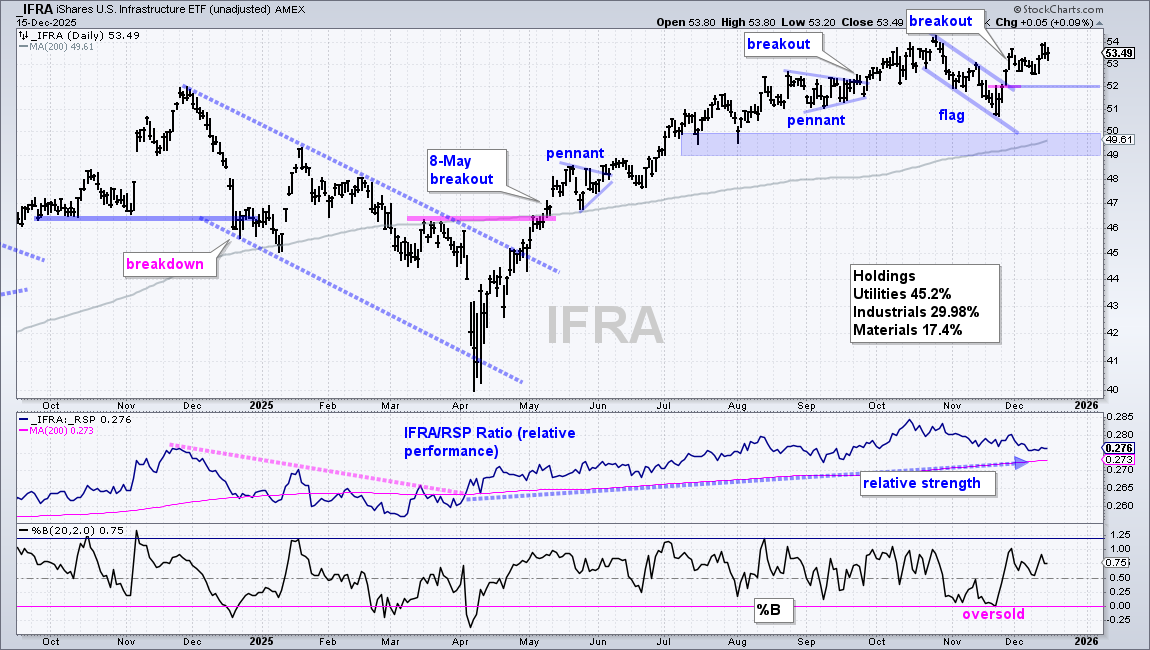
The Infrastructure ETF (IFRA) has a flag breakout working with re-evaluation support at 52. Long-term support is set in the 49-50 area.
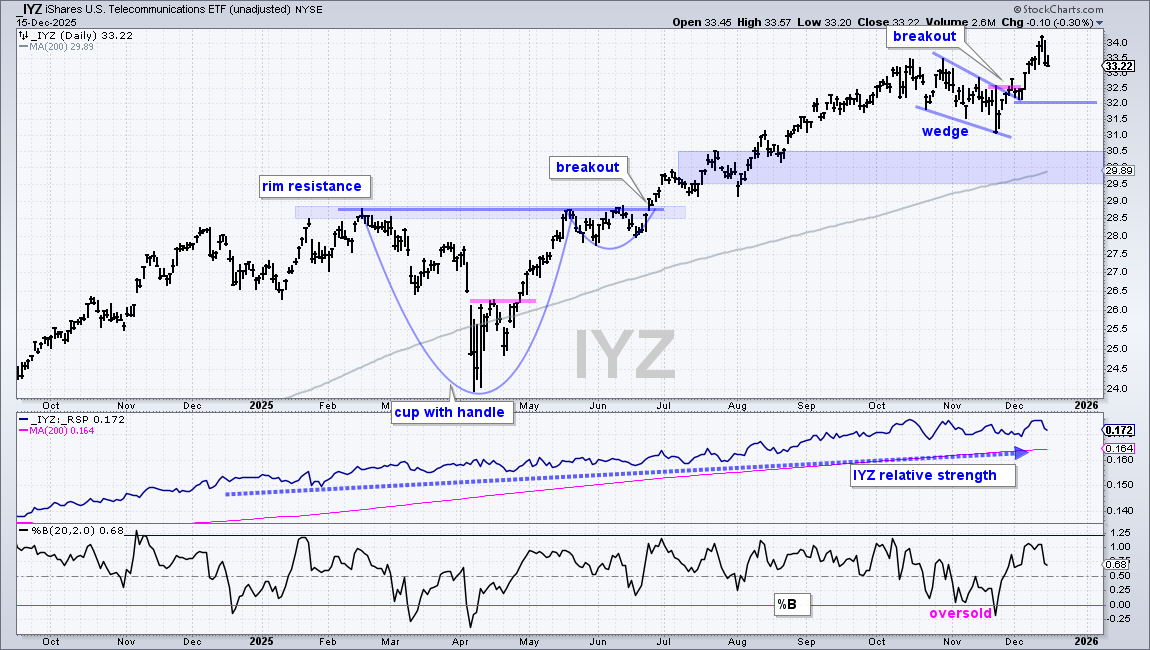
The Telecom ETF (IYZ) has a wedge breakout working with re-evaluation support at 32. Long-term support is set in the 29.5-30.5 area.
DISCLAIMER: This content provided strictly for informational and educational purposes. It should not be interpreted as an offer to buy or sell any security, nor as a solicitation to engage in any investment activity. Nothing here constitutes a recommendation regarding any specific security, portfolio, transaction, or investment strategy.
At times, the author or affiliates may hold positions or interests in securities discussed. Any stocks or examples mentioned are not endorsements or suggestions to purchase. This material does not consider your individual financial goals or circumstances, and you should seek guidance from a qualified financial or investment adviser before making any trading or investment decisions.
Past performance does not guarantee future results.
Send feedback to support(at)trendinvestorpro.com or use the contact form. [1]