Silver Leads Surge in Metals-Related ETFs – Uranium Holds Breakout – Bonds Break Down
Posted By
Arthur Hill, CMT
On
In
Archive |
No Comments
Headlines
Gold and Silver Extend on Breakouts
Gold and Silver Miners Challenge Highs
Copper Breaks October High as DBB Hits New High
Uranium Bounces off Support
IBIT Gets Oversold Bounce within Downtrend
7-10Yr TBond ETF Tests Neckline Support
The next report will be the Chart Fix (December 12th).
The next Premium report/video will be on Tuesday, December 16th.
Precious Metals Lead as Bitcoin Lags
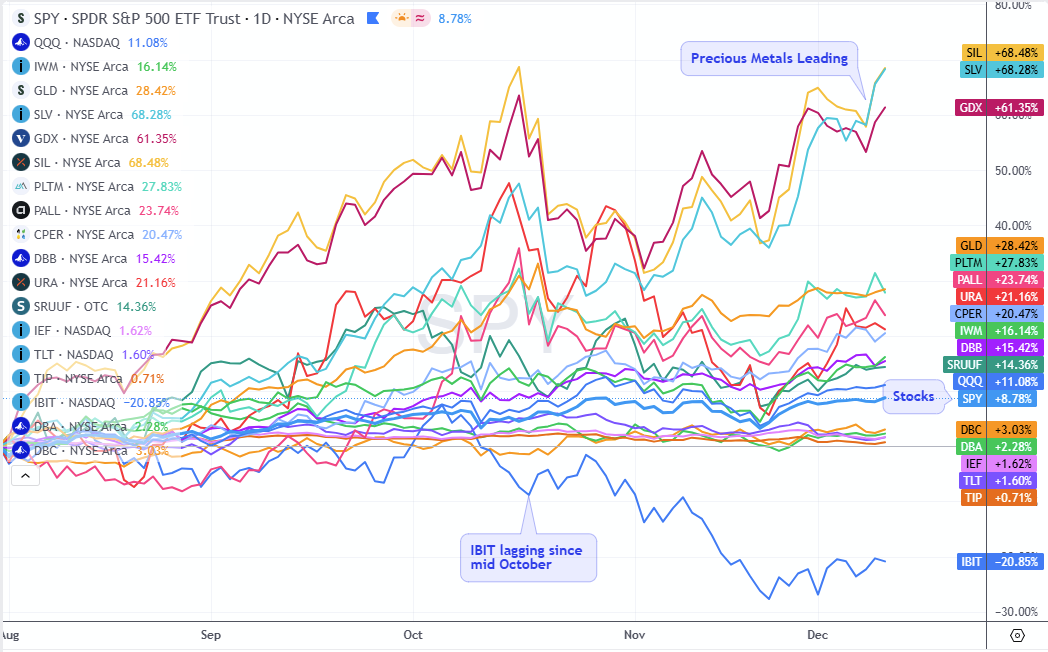
Precious metals related ETFs continue to lead all asset class ETFs this year, and since August. Silver (SLV) and the Gold/Silver Miners ETFs are at the top with 60+ percent gains since August. GLD is up a measly 28.42%. SPY is up a respectable 8.78%, but lagging QQQ (+11%) and IWM (+16%). It’s been a great run for stocks, but an even better run for precious and industrial metals. The bond ETFs are barely positive, while the Bitcoin ETF is the lone loser over this timeframe
In addition to StockCharts, I use TradingView charts[1] to analyze three different timeframes, create comparison charts and access a wide array of indicators.
Gold Consolidates as Silver Surges
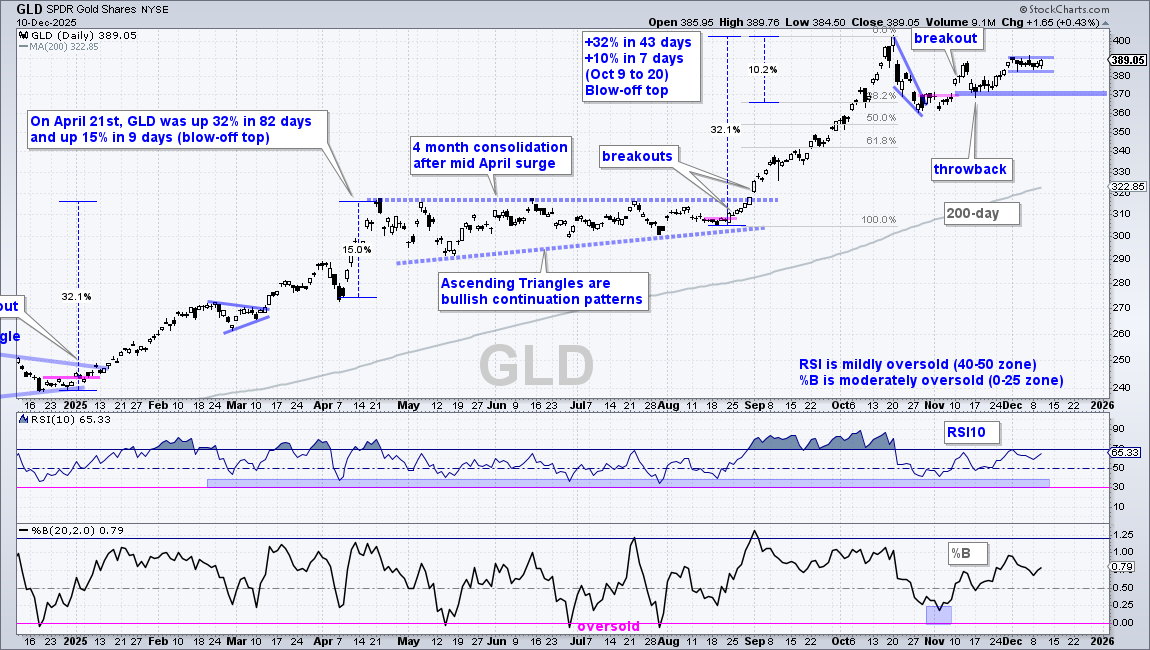
The Gold SPDR (GLD) remains in a leading uptrend with a new high in October and price well above the rising 200-day SMA. Short-term, GLD corrected with a sharp falling wedge into late October, broke out, tested the breakout and moved to 390 by December 1st. The ETF has since consolidated with a tight range the last seven days. A range breakout would be bullish and open the door to new highs.
The breakout level and mid November low combine to mark first support at 370 for GLD. A close below this level would lead to a deeper correction, but still within the confines of a long-term uptrend. The next target would then be the 61.8% retracement zone in the 340 area.
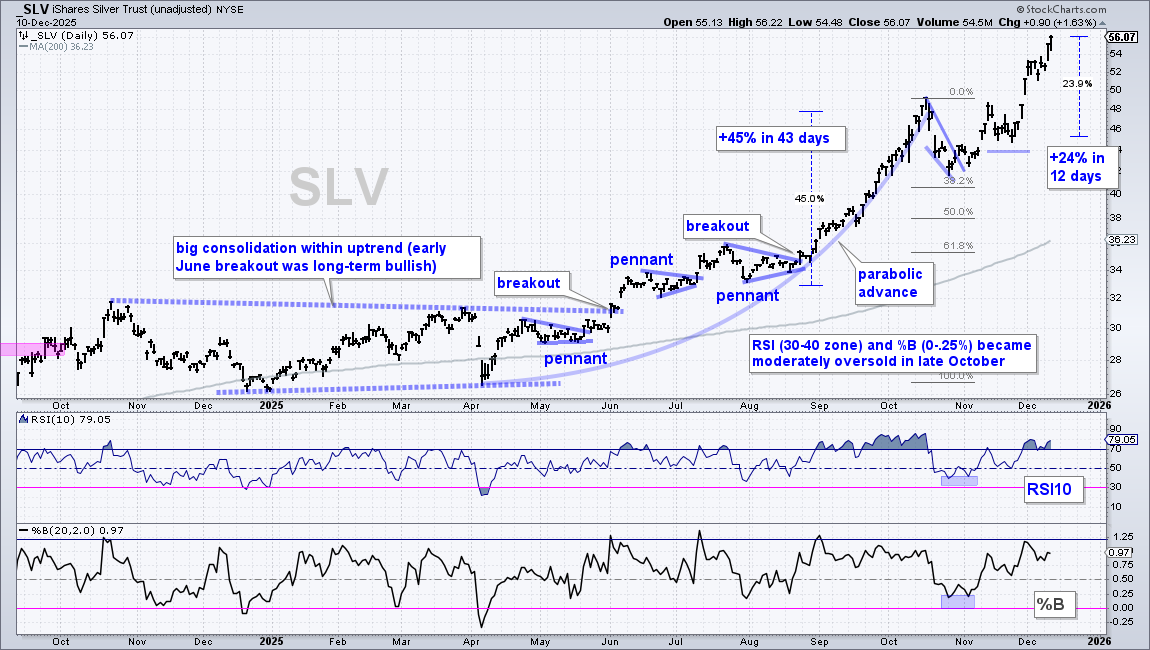
The Silver ETF (SLV) extended on its advance with a surge to new highs. SLV is now up 24% in the last 12 days. This is what silver does best. Note that the ETF surged 45% from late August to mid October (43 days). Such sharp advances are a sign of strength, but they also signal excess that can lead to sharp pullbacks. We just never know when! Thus, SLV is simply in the midst of a runaway uptrend. The next pullback will be considered an opportunity because SLV is in a leading uptrend.
Gold and Silver Miners Challenge Highs
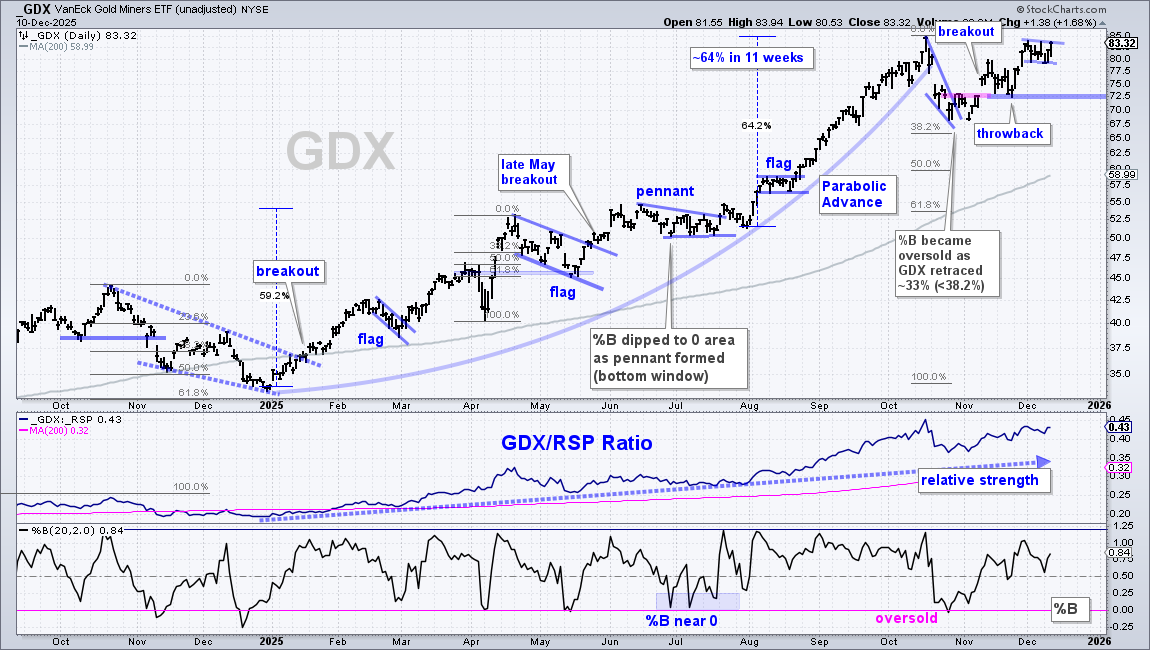
The Gold Miners ETF (GDX) surged to new highs in mid October, corrected with a steep wedge into late October and broke out with a surge in early November. After a throwback to the breakout zone, the ETF resumed its advance with a move towards the October high. A small flag formed the last two weeks and a breakout at 85 would lead to new highs. First support is set at 72 (thick blue line). A break here would argue for a correction, perhaps back towards the rising 200-day SMA and 50% retracement line.
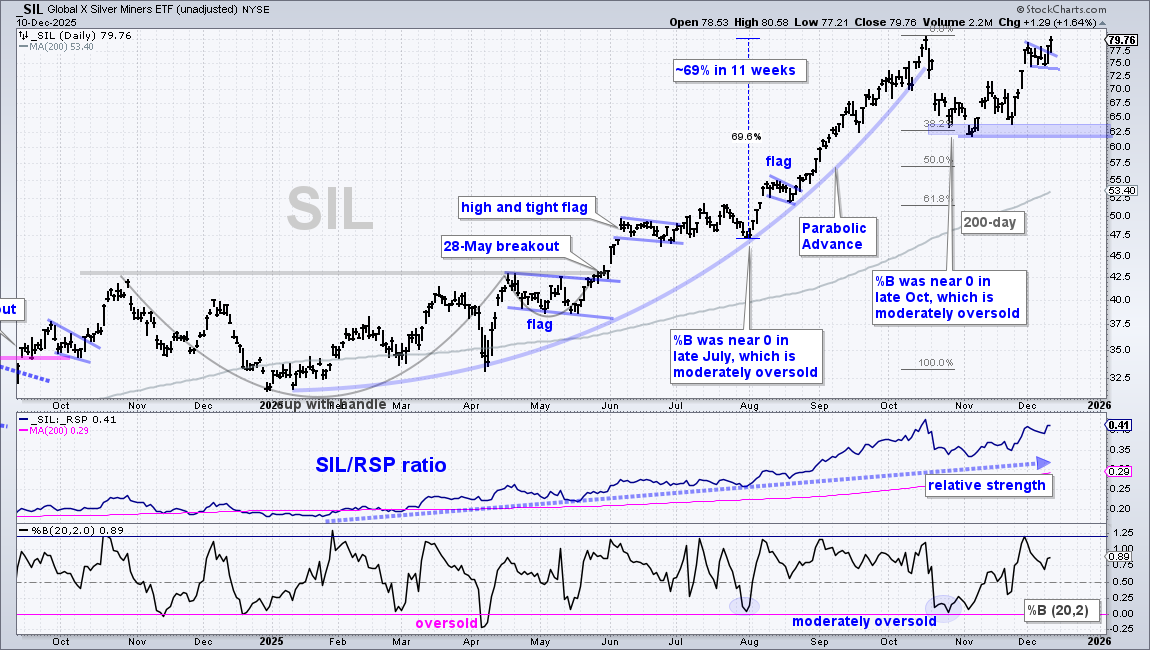
The Silver Miners ETF (SIL) got its mojo back as it surged to the October high this week. SIL is the most erratic of the four precious metals ETFs (GLD, SLV, GDX, SIL). However, it will follow silver, which in turn follows gold. The long-term trend is up with the October-November lows marking key support in the 62-63 area (blue shading).
Copper Breaks October High as DBB Hits New High
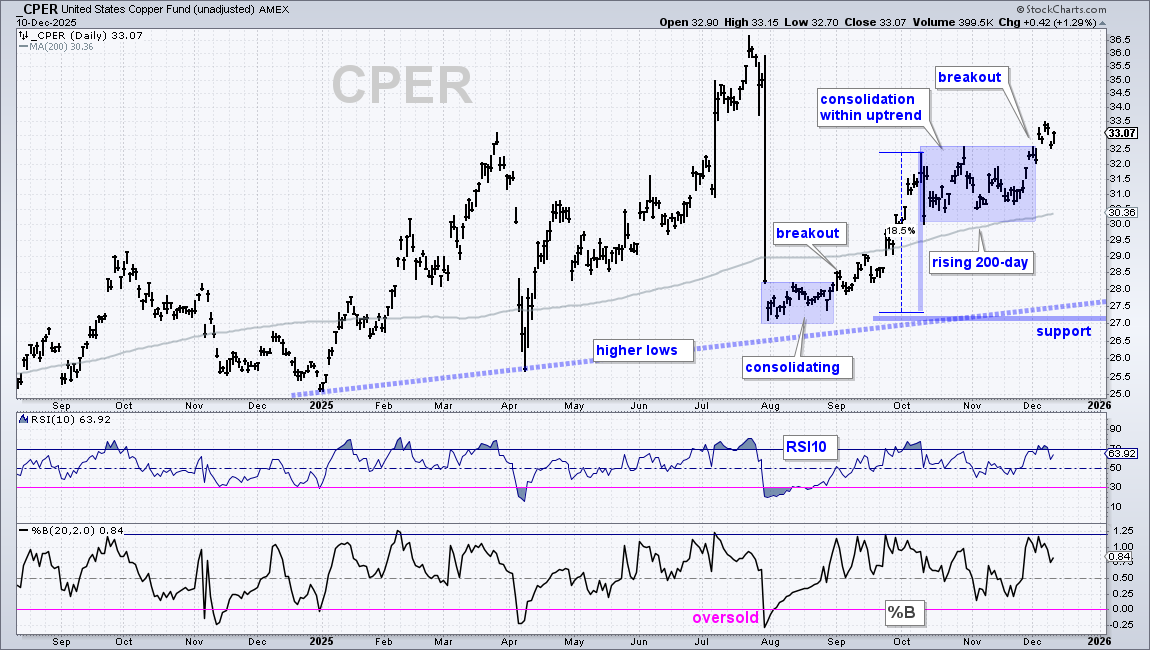
There is no change in the Copper ETF (CPER). CPER remains in a long-term uptrend with higher highs and higher lows since early 2025. CPER is also above the rising 200-day SMA. The ETF advanced from 27 to 32.5 (+18.5%) and then consolidated with a trading range into November. A consolidation after an advance is a bullish continuation pattern. It is the pause that refreshes and sets the stage for the next move. CPER broke out with a surge above 32.5 last week. Note that copper is a pretty volatile commodity, which means CPER could fall back into the consolidation zone (blue shading) and still be in an uptrend. While I am tempted to mark long-term support at 30, I will refrain for now and leave long-term support at 27.
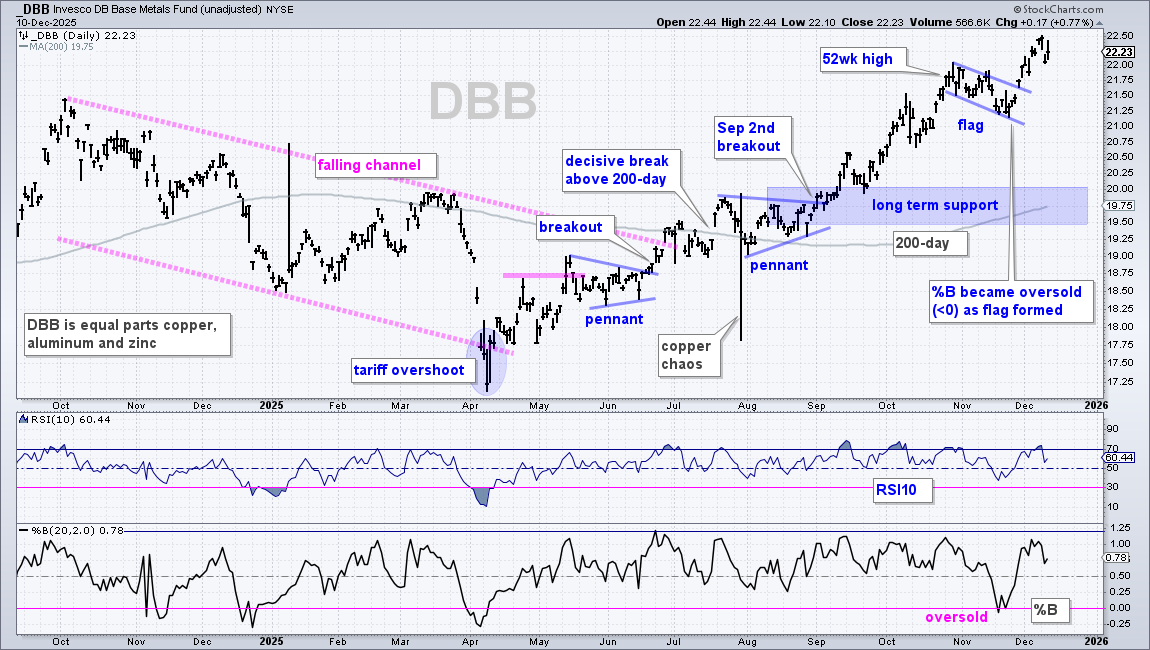
There is no change in the DB Base Metals ETF (DBB). DBB surged to new highs in October, corrected with a falling flag into November and broke out in late November. Also notice that %B became oversold on November 18th. This is a classic combination for trading pullbacks within uptrends (bull flag and oversold condition). DBB extended its flag breakout with new highs again this week. There is no setup now, just a leading uptrend.
Uranium Bounces off Support
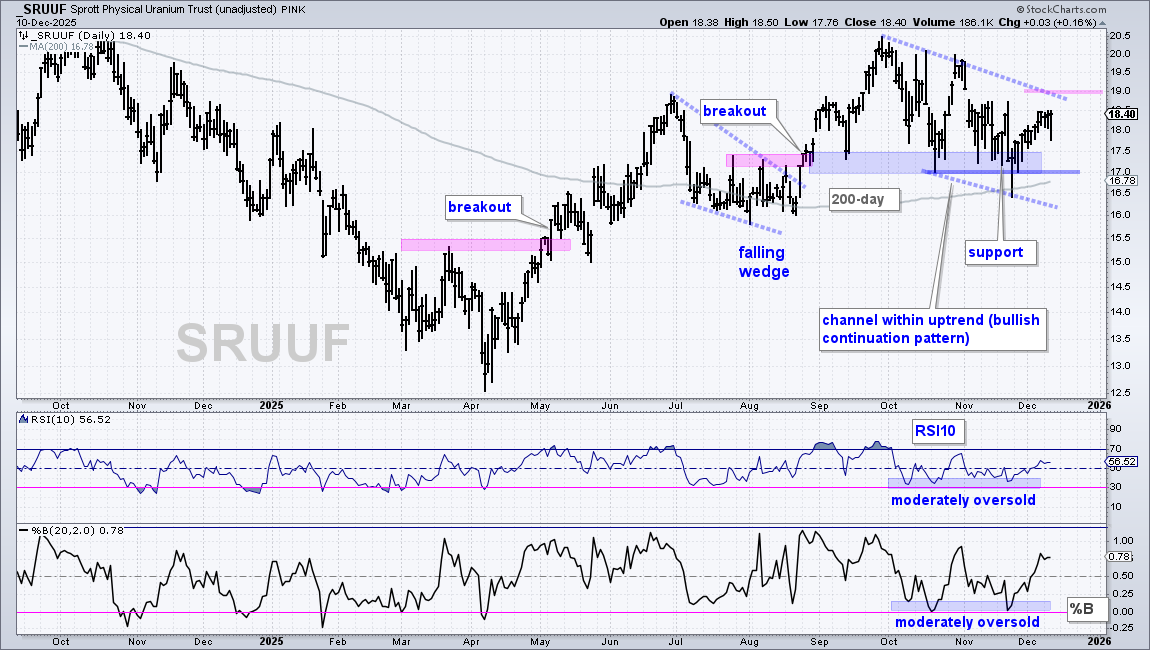
The Sprott Physical Uranium (SRUUF) remains in a long-term uptrend and within a choppy correction since October. The long-term trend is up with price above the rising 200-day SMA. After surging from late August to late October, the ETF corrected with a decline back to the 17-17.50 area. The breakout zone (pink shading) turned into support, which held since September (blue shading). The blue dashed lines define the falling channel correction and a breakout at 19 would be bullish. Short-term, the ETF affirmed support with a bounce off this zone the last three weeks.
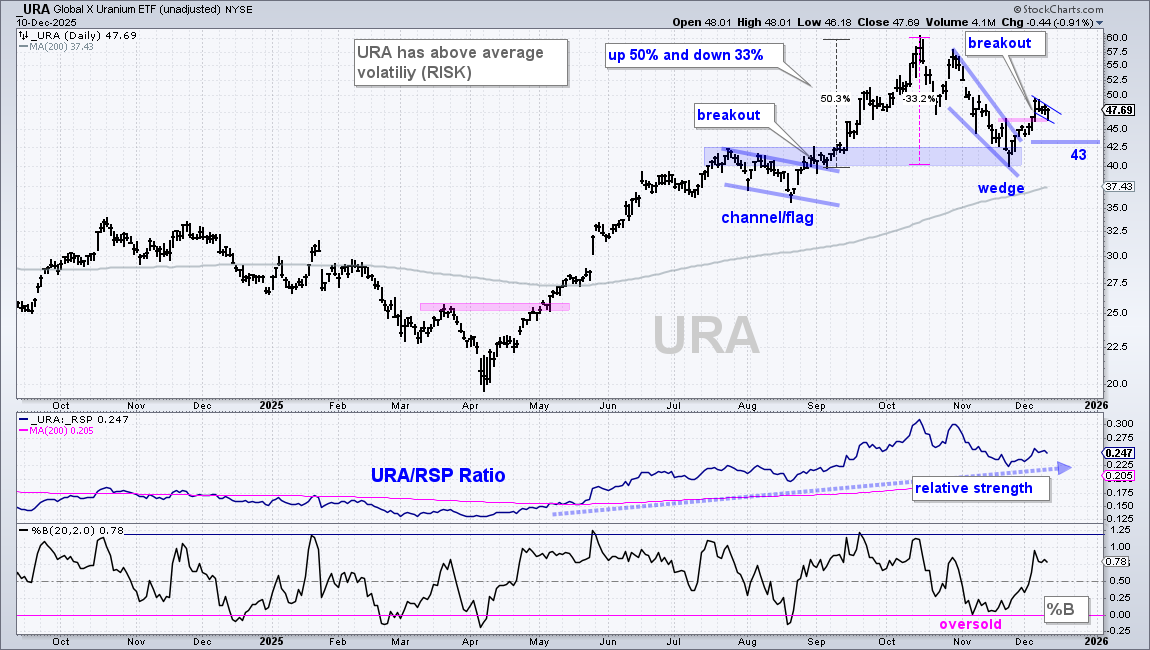
The Uranium ETF (URA) recently corrected with a falling wedge that held above the rising 200-day SMA. URA remains in a long-term uptrend with a new high in October and price well above the rising 200-day SMA. The falling wedge is a correction within this uptrend. Notice that URA found support at broken resistance (blue shading) and broke out with a surge into early December. After a move from 40 to 50, a small pennant formed and a breakout here would be bullish. A strong breakout should hold so I am marking re-evaluation support at 43. A move below 43 would erase the breakout surge and negate the breakout.
Note that URA includes Oklo (OKLO), a stock that advanced 180% from early September to mid October, and fell 55% into late November. Welcome to the rodeo. During this period, URA surged 50% and then fell 33%.
IBIT Gets Oversold Bounce within Downtrend
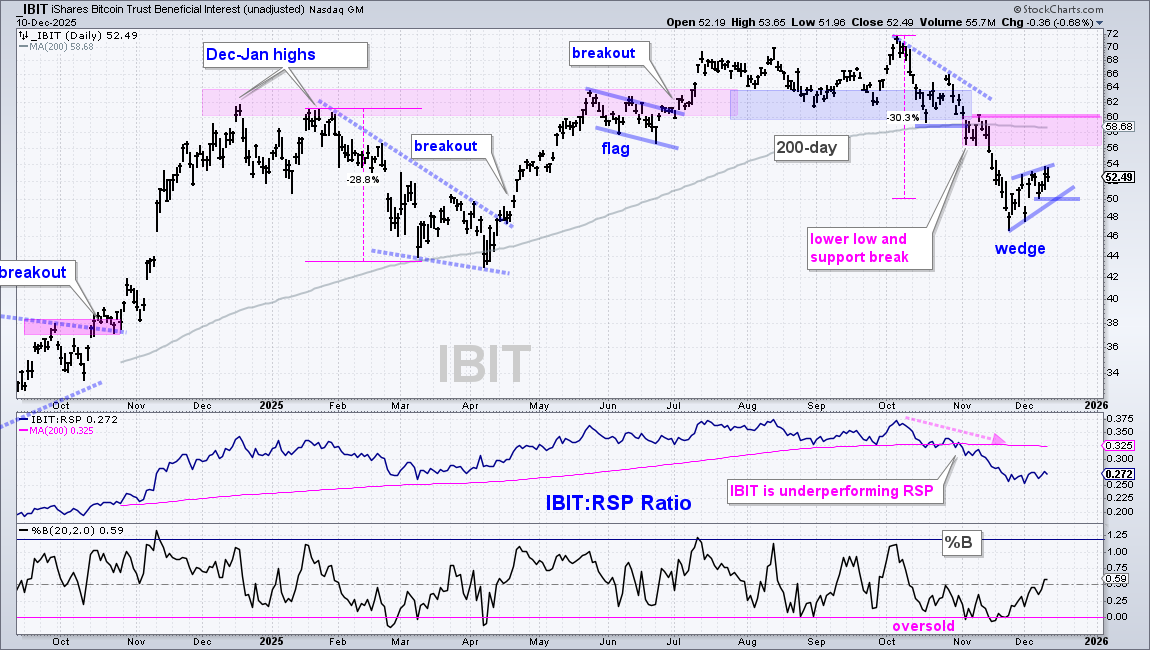
The Bitcoin ETF (IBIT) broke down on November 4th with a support break and cross below the 200-day SMA, which turned down the last few weeks. IBIT is in a long-term downtrend and the weakest of the asset class ETFs. Broken support and the 200-day SMA mark long-term resistance in the 56-60 area. Short-term, IBIT became oversold with the plunge to 48 and bounced the last three weeks. This is deemed an oversold bounce within a bigger downtrend. Wedge support is set at 50 and a break here would signal a continuation lower.
7-10Yr TBond ETF Tests Neckline Support
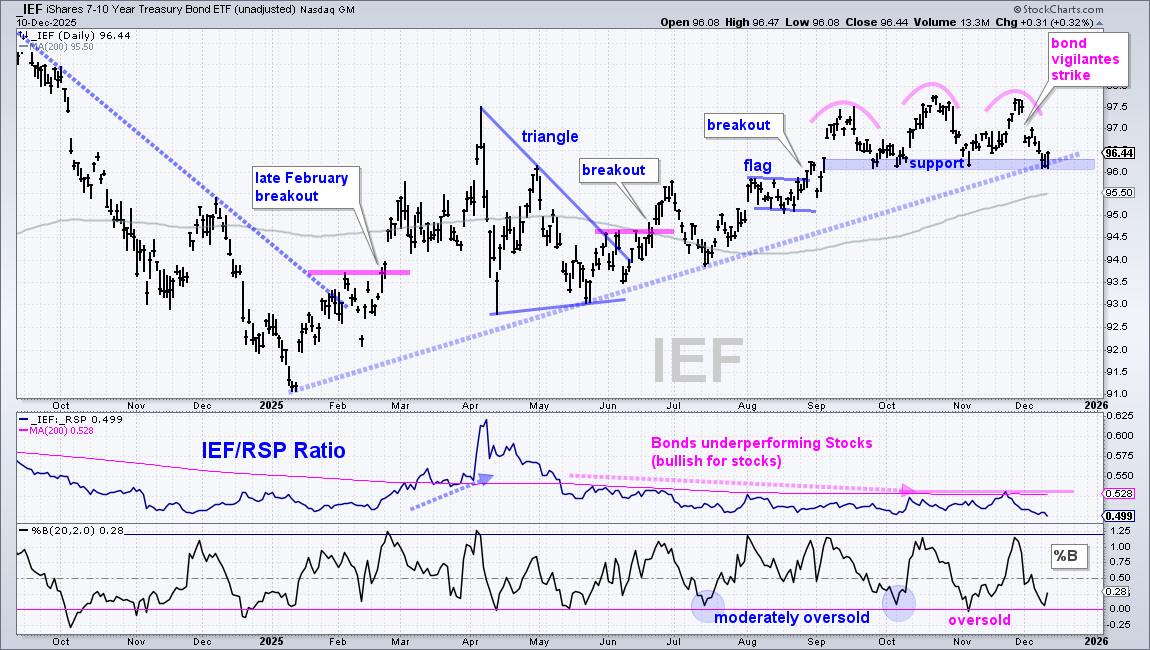
The 7-10Yr TBond ETF (IEF) fell sharply in December and tested neckline support this week. Technically, the long-term trend is still up with a series of higher highs and higher lows throughout the year. IEF stalled since September with a trading range that established support in the 96 area with bounces in early October and early November. IEF is once again testing support here in December. A bounce off this zone would keep the uptrend alive. A close below 96 would break support and reverse the uptrend.
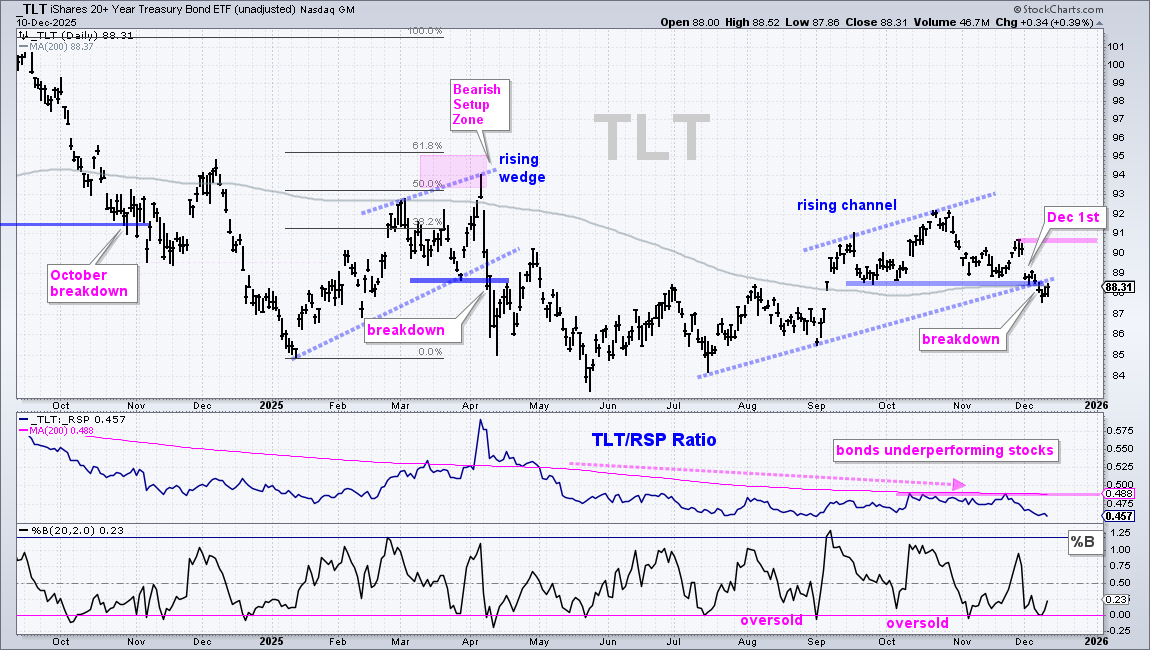
The 20+Yr TBond ETF (TLT) is more sensitive to the outlook for long-term rates because it holds bonds with longer maturities. TLT is weaker than IEF because it broke its 200-day SMA and September-November lows (thick blue line). It all started with the plunge below 89 on December 1st. TLT continued lower after this plunge and the breakdown is bearish until proven otherwise. The late November high marks resistance (pink line). A break above this level would be bullish for TLT (bonds).
DISCLAIMER: This content provided strictly for informational and educational purposes. It should not be interpreted as an offer to buy or sell any security, nor as a solicitation to engage in any investment activity. Nothing here constitutes a recommendation regarding any specific security, portfolio, transaction, or investment strategy.
At times, the author or affiliates may hold positions or interests in securities discussed. Any stocks or examples mentioned are not endorsements or suggestions to purchase. This material does not consider your individual financial goals or circumstances, and you should seek guidance from a qualified financial or investment adviser before making any trading or investment decisions.
Past performance does not guarantee future results.
Send feedback to support(at)trendinvestorpro.com or use the contact form. [2]