Headlines
- Amazon Maintains Uptrend with Bounce off Support
- Arista Networks Ends Correction with Breakout
- Johnson Controls Test Breakout with Throwback
- Tempus AI Attempts Breakout after Correction
- AbbVie Consolidates above Breakout Zone
I will update the Market Regime page later today.
Previous Reports Covering Stock Trends, Setups and Breakouts
December 3rd: [1] Autodesk (ADSK), Quanta Power (PWR), Freeport McMoRan (FCX), Norfolk Southern (NSC), CSX Corp (CSX)
November 19th: [2]Gen Digital (GEN), Qualcomm (QCOM) and Unity Software (U)
November 12th [3]: Nucor (NUE), Danaher (DHR), Pfizer (PFE), Northrop Grumman (NOC), Norfolk Southern (NSC), AES Corp (AES)
November 5th [4]: Consumer Staples SPDR (XLP), Costco (COST), CSX Corp (CSX), Heico (HEI), Entergy (ETR), Excel Energy (XEL)
October 29th: [5] Cadence Design (CDNS), Tesla (TSLA), Burlington (BURL), Newmont Mining (NEM), Freeport McMoran (FCX)
Amazon Maintains Uptrend with Bounce off Support
Amazon (AMZN) is perhaps the closest thing to Alphabet right now. Amazon has a large cloud business, they are developing their own chips (Trainium) and they have a massive customer base. Amazon has an AI partnership with Anthropic.
The stock is in a long-term uptrend, but has gone nowhere this year. It was trading in the 220 area in January and is currently trading around 228 here in December. The overall trend is up because the stock hit a new high in November and remains above its 200-day SMA. There is a ton of support in the 210-220 area as the stock bounced off this zone in August, October and November. The bulls clearly have the edge as long as 210 holds.
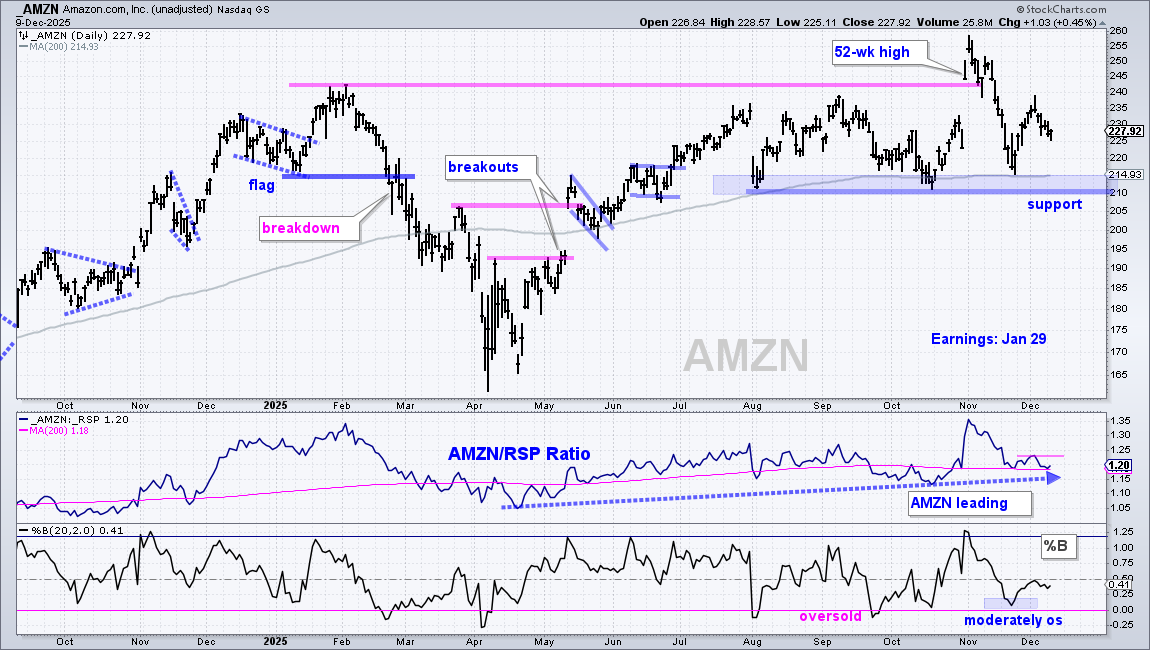
The middle window shows the price-relative trending higher since May. Relative performance waned after the October surge as the price-relative fell back to its 200-day SMA. A break above the early December high would show a return to relative strength.
Arista Networks Ends Correction with Breakout
Arista Networks (ANET) is part of the AI datacenter trade because they supply cloud networking gear and Ethernet switching. They competitor, Cisco (CSCO), was featured on October 1st [6] as it turned up after a support test. Note that ANET has above average volatility and risk. The stock gained over 150% from April to October and fell some 28% from late October to late November.
The long-term trend is up with a new high in late October and price above the rising 200-day SMA. ANET fell sharply in November, but this decline looks like a normal correction within an uptrend because it returned to the 200-day SMA and retraced around 61.8% of the prior advance.
A falling wedge formed and the stock broke the wedge line with a surge in late November. ANET stalled into December with short-term resistance at 132. A breakout here would be bullish and argue for further gains. Upon a breakout, a close below 120 would warrant a re-evaluation.
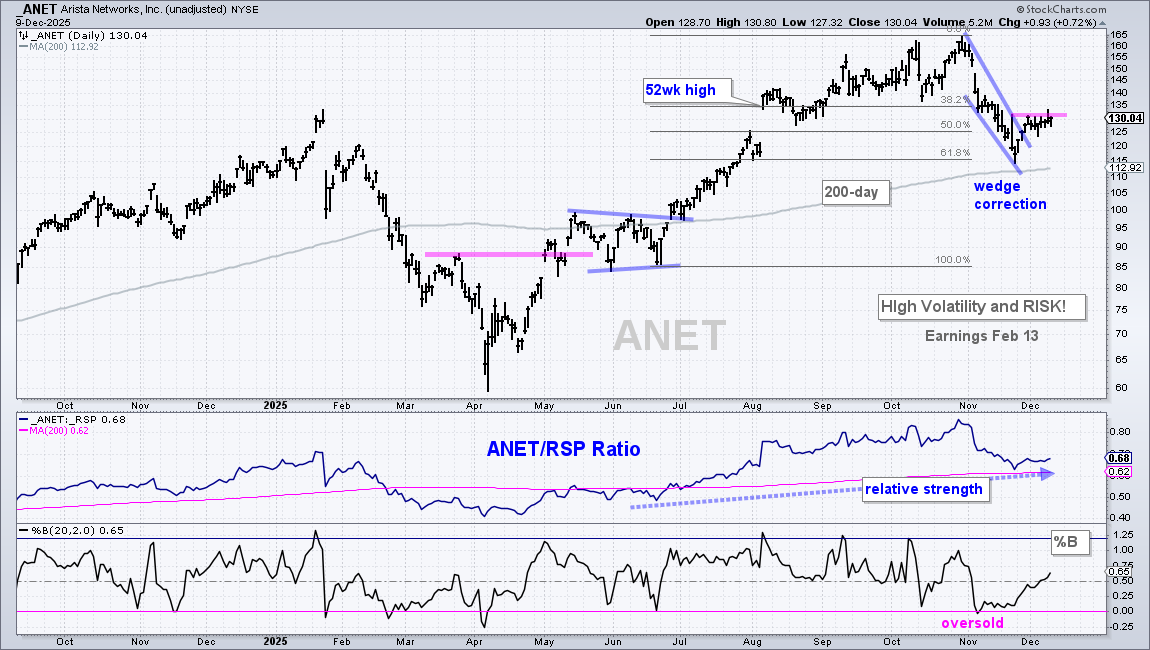
The middle window shows the price-relative (ANET/RSP ratio) rising as the stock outperforms the broader market. Relative performance waned in November as the stock corrected, but the price-relative is holding above its 200-day and could be turning up.
Johnson Controls Test Breakout with Throwback
Johnson Controls (JCI) is part of the energy trade. The company provides thermal management solutions as well as security and fire protection systems. The stock is part of the Industrials SPDR (XLI) and the First Trust Nasdaq Clean Edge Smart GRID Infrastructure Index Fund (GRID).
JCI is in a leading uptrend with a new high in November and price above the rising 200-day SMA. After surging from early April to late July, the stock consolidated with a trading range from August to October. JCI broke out in late October, surged in early November and then fell back to the breakout zone. The blue shading marks broken resistance, which turns into support. I view the decline back to the breakout zone as throwback that provides a second chance to partake in the breakout.
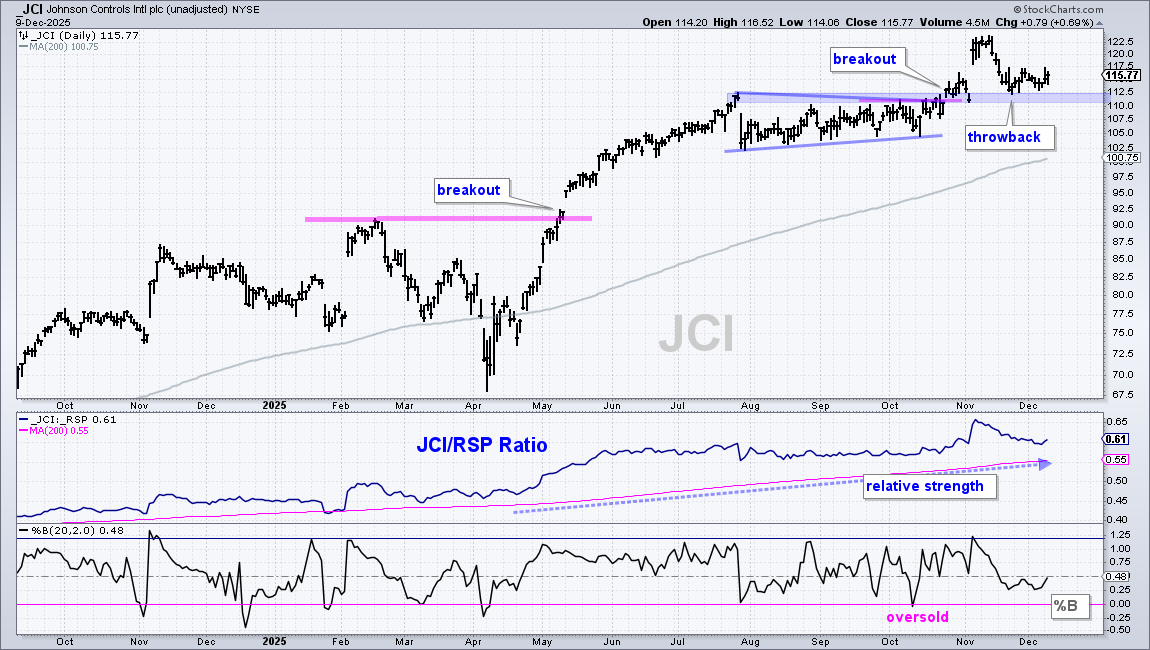
The middle window shows the price-relative (JCI/RSP ratio) moving above its 200-day SMA in early February and staying above as the stock outperformed. JCI remains an outperformer.
Tempus AI Attempts Breakout after Correction
Tempus AI (TEM) is a healthcare tech company that uses AI and machine learning to build diagnostic platforms for oncology, cardiology, radiology and depression. TEM is part of the Biotech SPDR (XBI) and the ARK Genomic Revolution ETF (ARKG). As with ANET, this stock has above average volatility and risk. With a $13.5 billion market cap, it fits into the mid-cap space.
TEM is in a long-term uptrend with a 52-week high in October and price above the 200-day SMA. After hitting a new high, the stock corrected with a decline back to the 200-day. TEM firmed in the 65 area and surged in late November. A falling wedge formed and the stock is attempting a breakout. Short-term, I see a surge in late November and a small flag in December. A breakout at 80 would be bullish. A close below 69 would call for a re-evaluation.
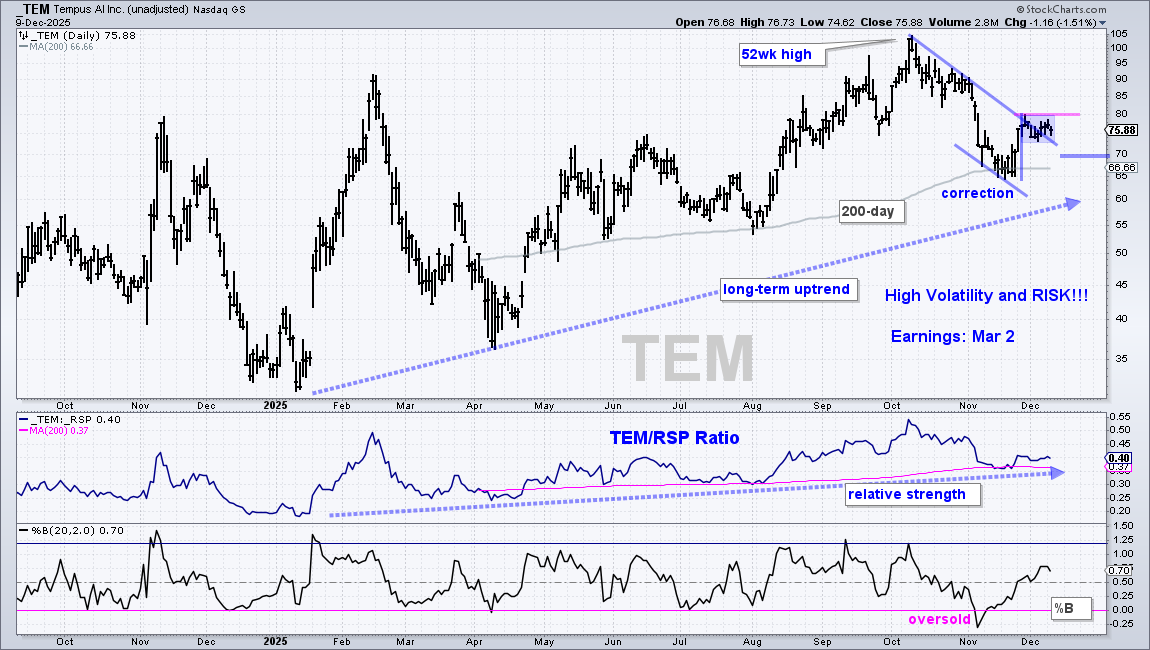
The indicator window shows the price-relative (TEM/RSP ratio) rising throughout 2025. Relative performance waned as the stock corrected in November and the price-relative hit the 200-day SMA. It turned up the last two weeks as TEM started to outperform again.
AbbVie Consolidates above Breakout Zone
AbbVie (ABBV) is a major pharmaceutical company with a $394 billion market cap. It is the third biggest holding (7.24%) in the Healthcare SPDR (XLV).
ABBV is in a long-term uptrend with a breakout in September and price well above the rising 200-day SMA. Price action turned choppy after the breakout as the stock fell back to the breakout zone in October, bounced into November and formed a falling wedge into December. Overall, I view this as a big consolidation above the breakout zone. ABBV is in good shape as long as 210 holds.
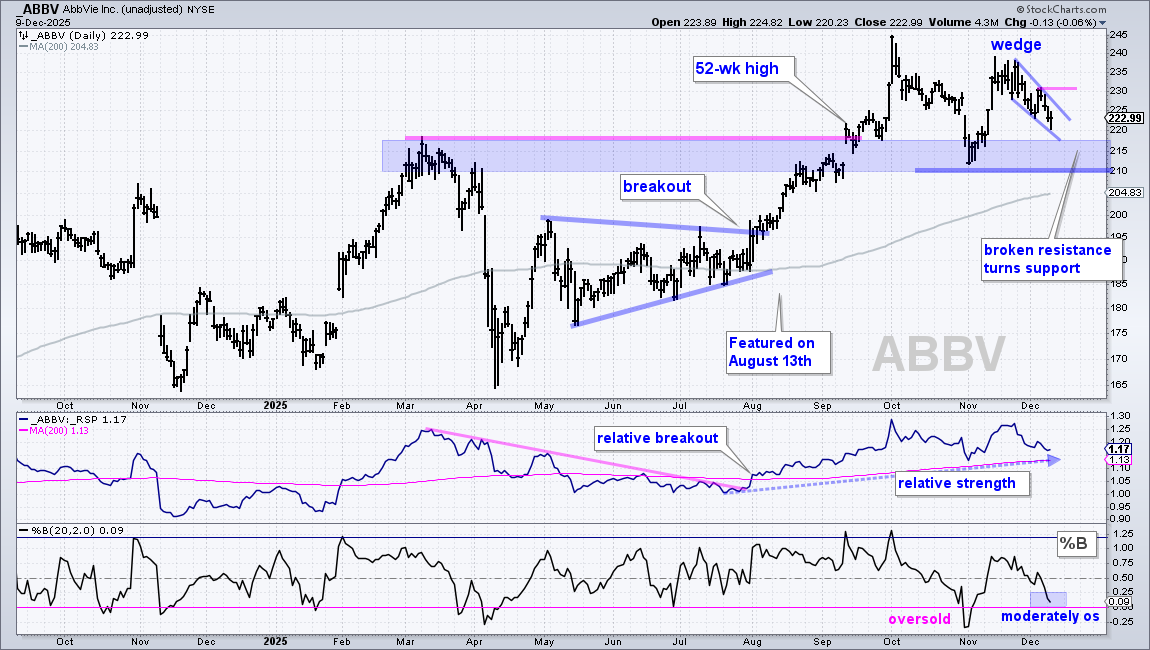
Short-term, the stock surged in early November and corrected with a falling wedge. A move above 231 would break wedge resistance and signal a continuation higher. The middle window shows the price-relative (ABBV/RSP ratio) trending higher since August (relative strength). The lower window shows %B becoming moderately oversold with a move into the 0-.25 area this week.
DISCLAIMER: This content provided strictly for informational and educational purposes. It should not be interpreted as an offer to buy or sell any security, nor as a solicitation to engage in any investment activity. Nothing here constitutes a recommendation regarding any specific security, portfolio, transaction, or investment strategy.
At times, the author or affiliates may hold positions or interests in securities discussed. Any stocks or examples mentioned are not endorsements or suggestions to purchase. This material does not consider your individual financial goals or circumstances, and you should seek guidance from a qualified financial or investment adviser before making any trading or investment decisions.
Past performance does not guarantee future results.
Send feedback to support(at)trendinvestorpro.com or use the contact form. [7]