Flag Breakouts in Tech-Related ETFs – Housing, Regional Banks and Retail Do an About Face
Posted By
Arthur Hill, CMT
On
In
Archive |
No Comments
Headlines
A Mixed Bull Market
SPY Bounces off Support Zone (plus QQQ)
October Lows, November 20th Highs and Flags (MAGS, XLK)
Semiconductors Hold Up as AI ETFs Rebound
Small-caps Reflect the Chaos
Banks ETFs Hold October Lows and Break Out
Housing ETFs Surge as 10yr T-Yield Falls
What a Difference Two Weeks/Days Make
Infrastructure and Telecom Still Leading
A Mixed Bull Market
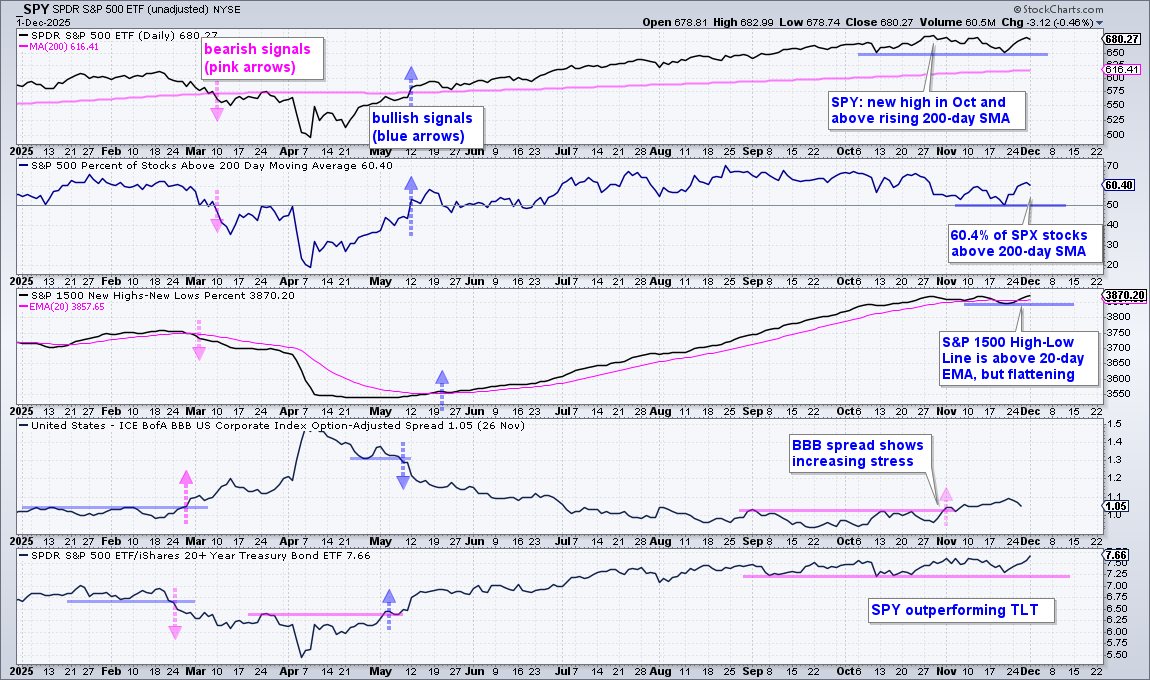
The weight of the evidence remains bullish for stocks, despite sizable pockets of weakness within the stock market. SPY is above its rising 200-day SMA and held its October low (650). The most important benchmark for US stocks remains strong. SPX %Above 200-day SMA bounced off the 50% level and is currently at 60%. The cup is clearly half full when more than 50% of S&P 500 stocks are above their 200-day SMAs. A break below 650 in SPY and 50% in SPX %Above 200-day SMA would be negative.
The middle window shows the S&P 1500 High-Low Line dipping below its 20-day EMA in November, but turning back up as stocks rebounded last week. A move below the late November low would show new lows expanding and be negative. BBB yields spreads widened to their highest levels since September, which shows increasing stress in the credit markets. However, risk assets (SPY) continue to outperform safe-havens (TLT), which favors risk on.
SPY Bounces off Support Zone as QQQ Breaks Flag Line
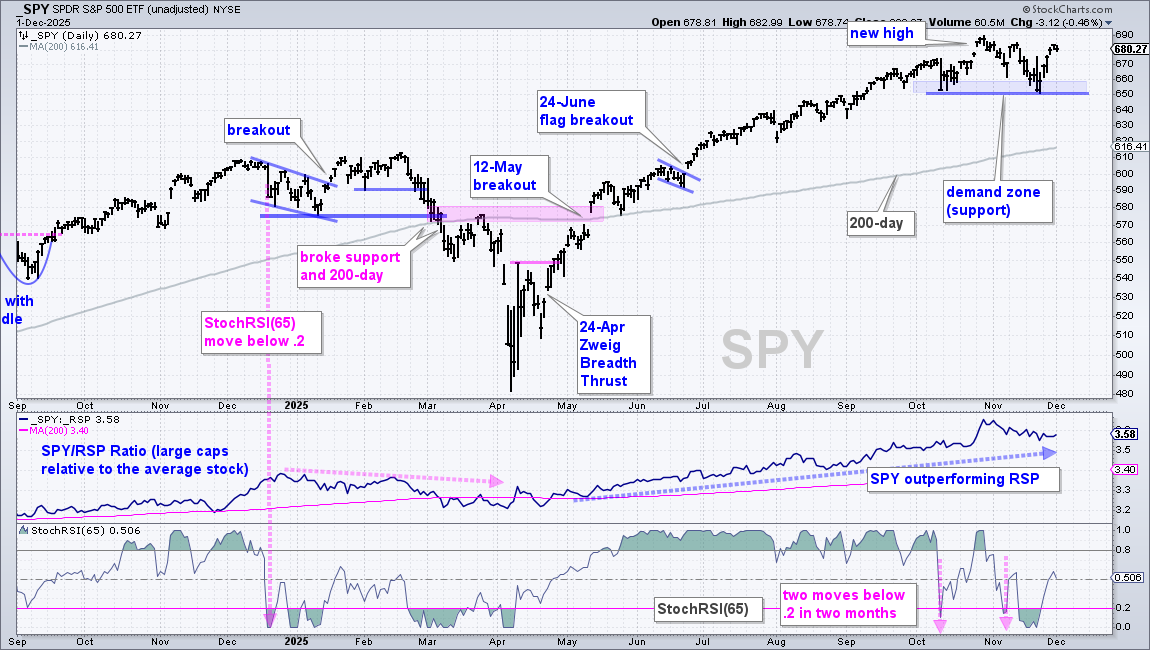
SPY remains in a long-term uptrend with a new high in late October and price well above the 200-day SMA. Short-term, the ETF stalled in the 650-690 area with a trading range since early October. SPY remains the strongest of the major index ETFs because it held support in the 650-660 area in late November and surged above 680. This late November surge confirms the support zone. A break below 650 would reverser the immediate uptrend and argue for a correction, perhaps back to the rising 200-day SMA.
The indicator window shows StochRSI(65) plunging below .20 twice in the last two months. These moves mark a downward momentum thrust, which shows a material increase in selling pressure. Such moves can foreshadow a correction, similar to what we saw in December 2024. Notice, however, that SPY traded sideways from December to February and did not break down until early March 2025.
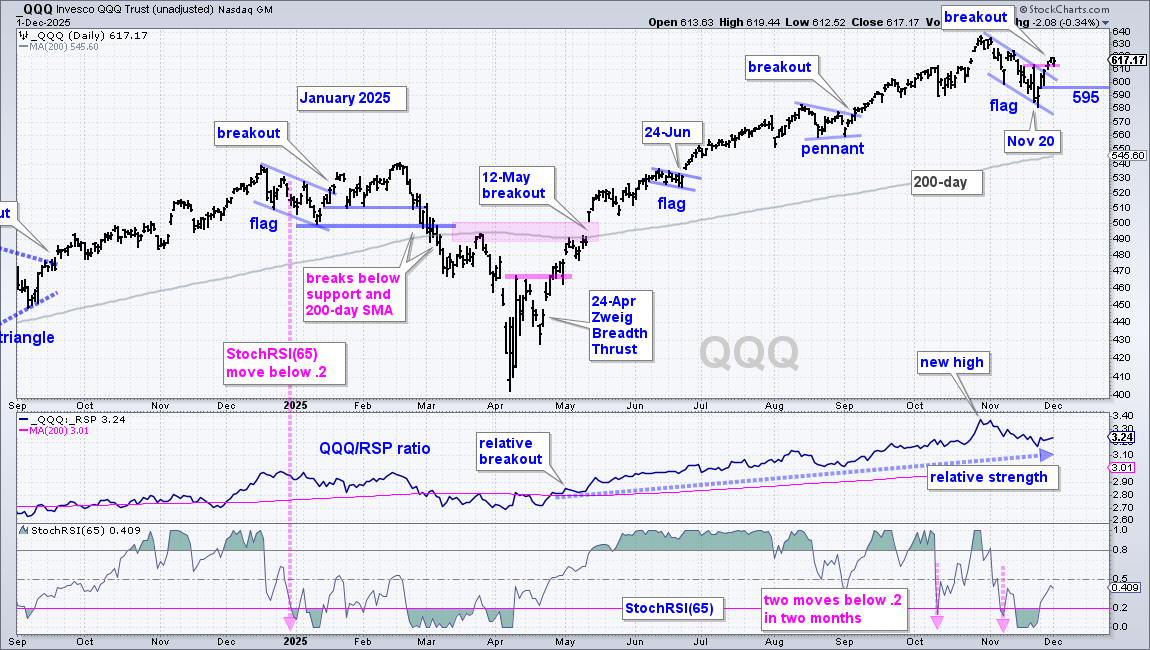
The next chart shows QQQ breaking the October lows with a sharp decline into November 20th and then surging above the November 20th high. November 20th saw a strong open (>610) and a weak close (<590). QQQ countered this bearish price action with a surge back above 610 and break above the high on November 20th. Overall, the November decline looks like a falling flag, which marks a correction within an uptrend. QQQ broke flag resistance and this is bullish price action, provided it holds. A close below 595 would negate the flag breakout and call for a re-evaluation.
Current price action is similar to what we saw in January 2025. StochRSI(65) broke below .20 in late December to signal a bearish momentum thrust and start of a correction. QQQ formed a falling flag into January and broke out with a surge in mid January. QQQ held this flag breakout for a few weeks, but ultimately negater the breakout in late February and broke down in early March.
October Lows, November 20th Highs and Flags
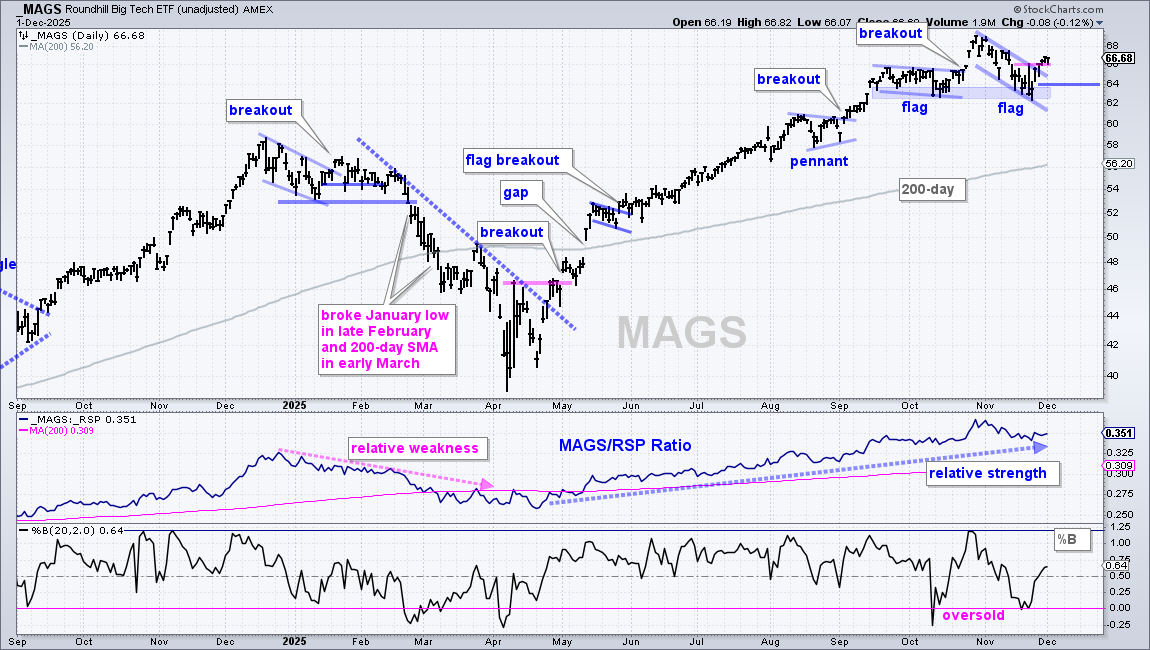
The October lows mark benchmark lows chartists can use to gauge relative performance. Names that held these lows showed relative strength during the November decline. Similarly, the high on November 20th marks a benchmark high. Names that broke this high in late November also show relative strength.
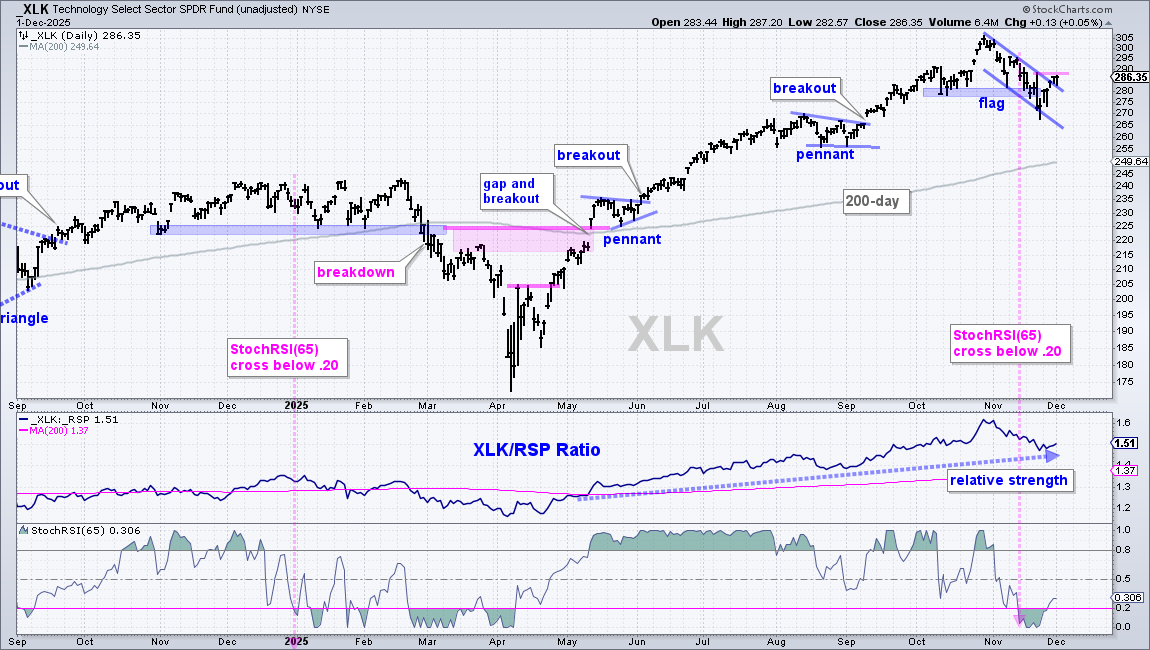
Many tech-related ETFs formed falling flag patterns in November. After steep advances in September-October, a correction or pullback is quite normal. Moreover, falling flags are typical for short-term corrections or pullbacks after a sharp advance. ETFs breaking their flag lines and November 20th highs are leading. It is important that these flag breakouts hold. A short 1-3 day pullback is now possible, perhaps back to the upper line of the flag. A decline that erases the Thanksgiving week gains would negate the flag breakouts and call for a re-evaluation.
The next chart shows the Technology SPDR (XLK) breaking below its October low with a sharp decline into November 20th (relative weakness). XLK rebounded with the rest of the market last week, but has yet to break its high on November 20th. I see a falling flag on the price chart and follow through above 290 would complete the flag breakout. XLK is still the largest sector (34.57%) in the S&P 500. Within tech, semiconductors (38.24%) and software (32.54%) are the biggest industry groups.
Semiconductors Hold Up and AI ETFs Rebound
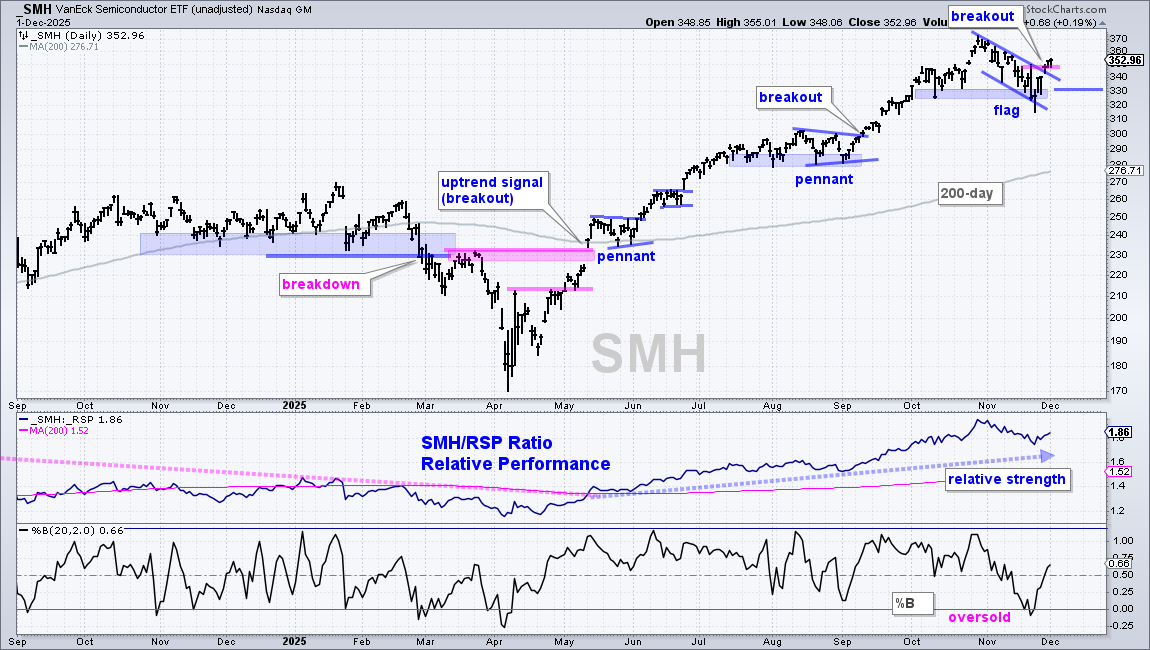
The market is split as a whole and also within certain sectors. Within XLK, semis and AI names remain relatively strong, but software, cloud and cybersecurity are relatively weak. The Software ETF (IGV), Cloud Computing ETF (SKYY) and Cybersecurity ETF (CIBR) broke their October lows and remain below their November 20 highs. The first chart shows the Semiconductor ETF (SMH) holding its October low and breaking the high on November 20th. A flag breakout is working with re-evaluation support set at 330.
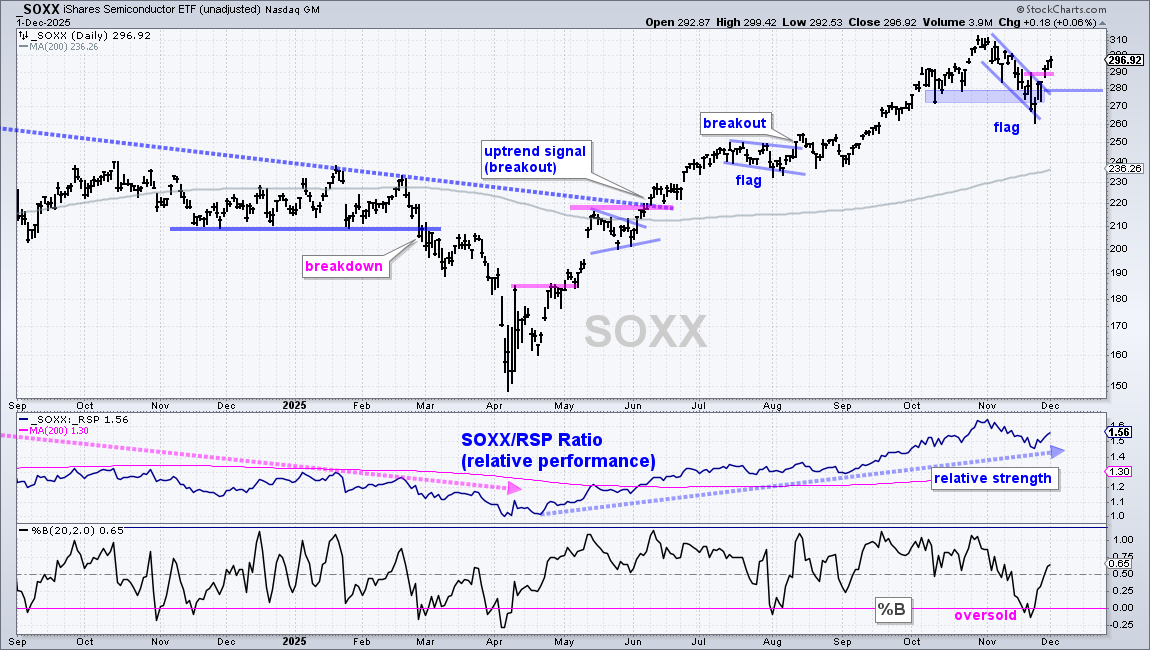
The next chart shows the Semiconductor ETF (SOXX) breaking its October low, but recovering with a flag breakout and surge above the November 20th high. Re-evaluation support is set at 280.
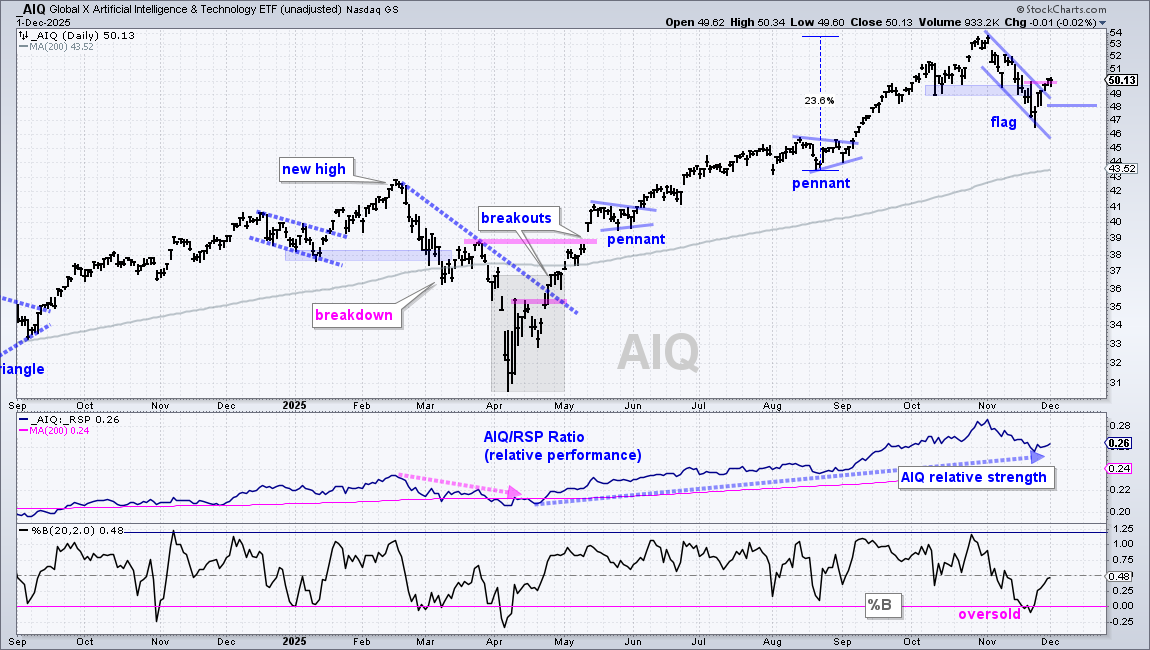
The next chart shows the Global AI & Tech ETF (AIQ) with a flag breakout and re-evaluation support at 48.
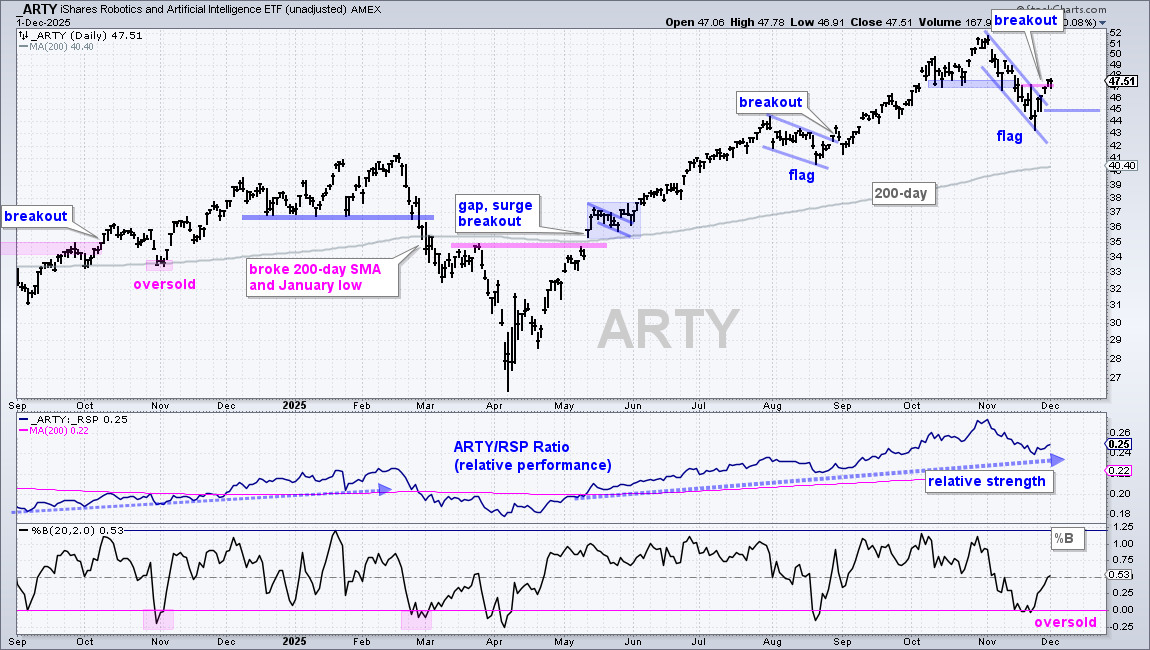
The next chart shows the Robotics AI ETF (ARTY) flag breakout and re-evaluation support at 45.
Small-caps Reflect the Chaos
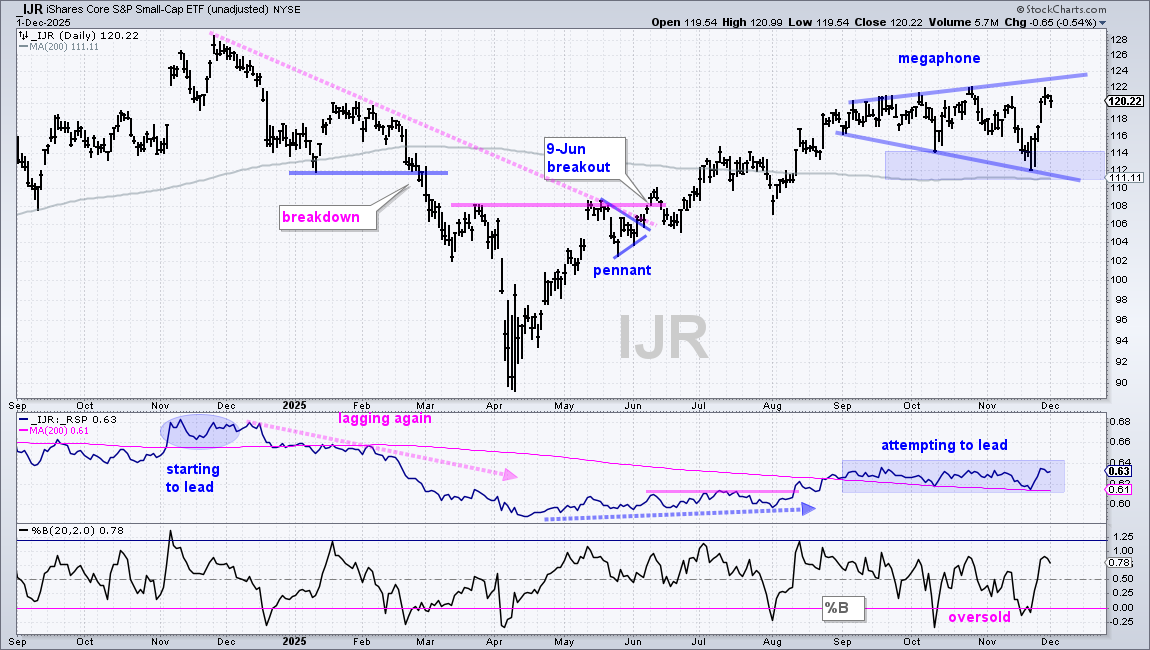
The S&P SmallCap 600 SPDR (IJR) led the market higher with an 8% surge from November 21st to 28th (5 trading days). A megaphone pattern formed since September with higher highs and lower lows. This pattern reflects chaos and uncertainty with its erratic price swings. The October-November lows and 200-day SMA mark long-term support at 111. A break below 111 would reverse the long-term uptrend
Banks ETFs Hold October Lows and Break Out
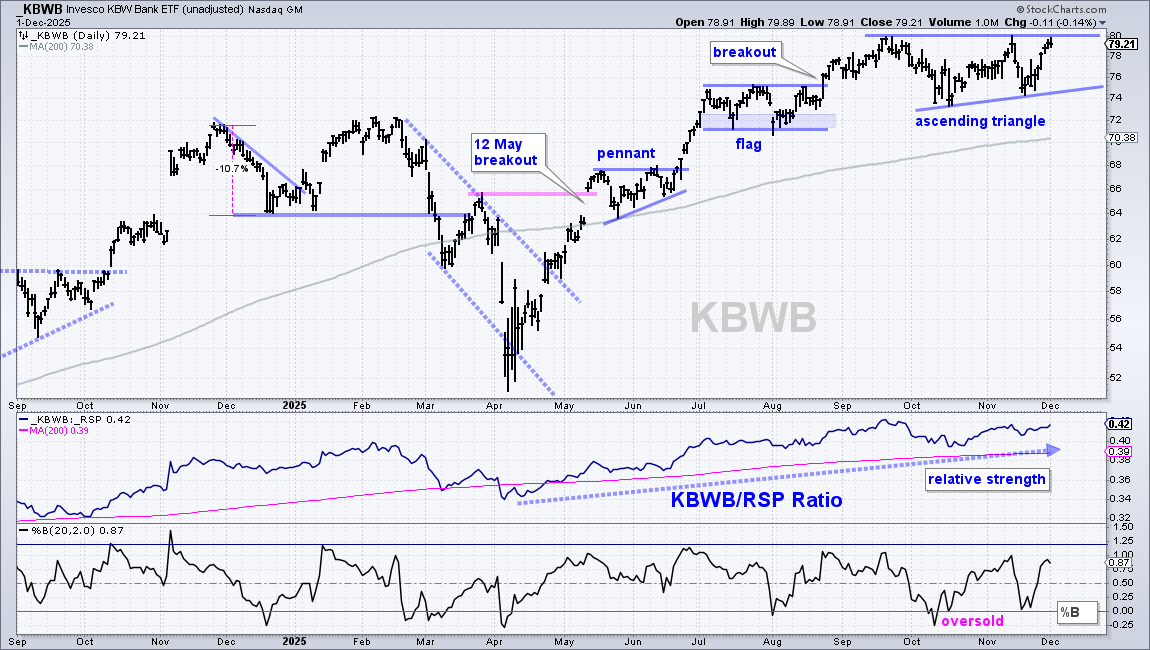
The KBW Bank ETF (KBWB) continues to lead within the finance sector. The chart below shows KBWB with a new high in September, price well above the rising 200-day SMA and a rising price-relative (KBWB/RSP ratio). Most recently, KBWB consolidated with an Ascending Triangle, which is a bullish continuation pattern. A breakout at 80 would signal a continuation of the leading uptrend. A close below 74 would negate this pattern.
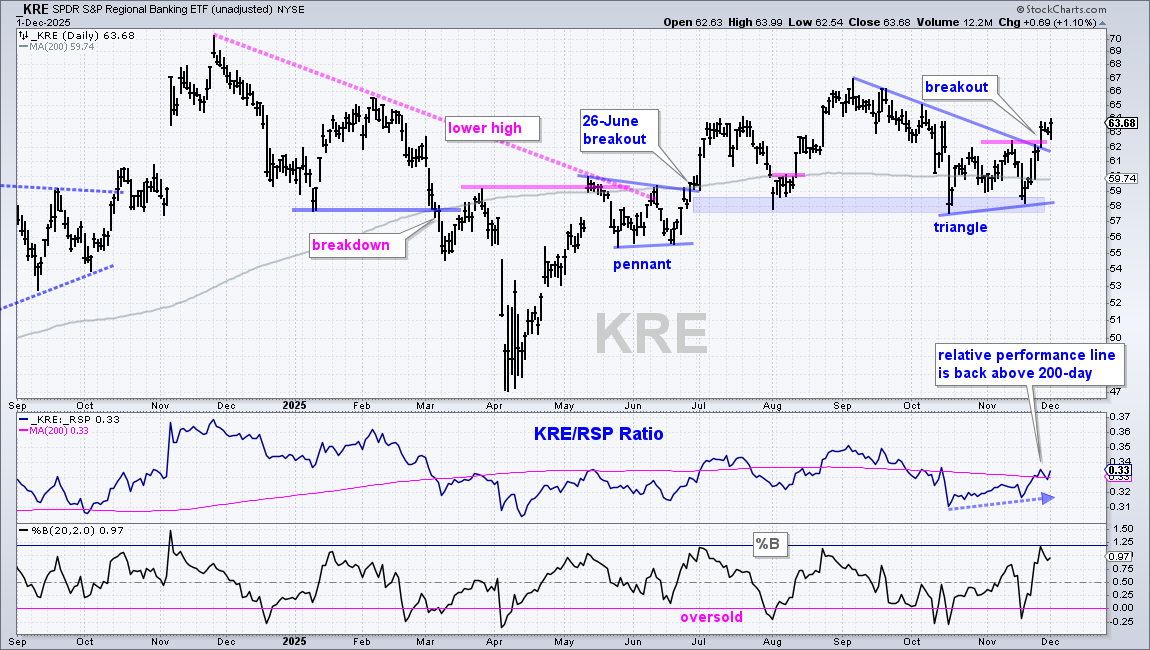
The next chart shows the Regional Bank ETF (KRE) moving from laggard to leader over the last seven weeks. KRE formed a higher low from October to November (relative strength). It then broke the mid November high with a surge in late November. Overall, KRE advanced from 47 to 66 (April to August) and then consolidated with a triangle. The triangle is a consolidation within an uptrend, which makes it a bullish continuation pattern. Thus, the breakout signals a continuation higher and targets a move towards the 2024 highs (70). A close below 58 would negate this pattern.
Housing ETFs Surge as 10yr T-Yield Falls
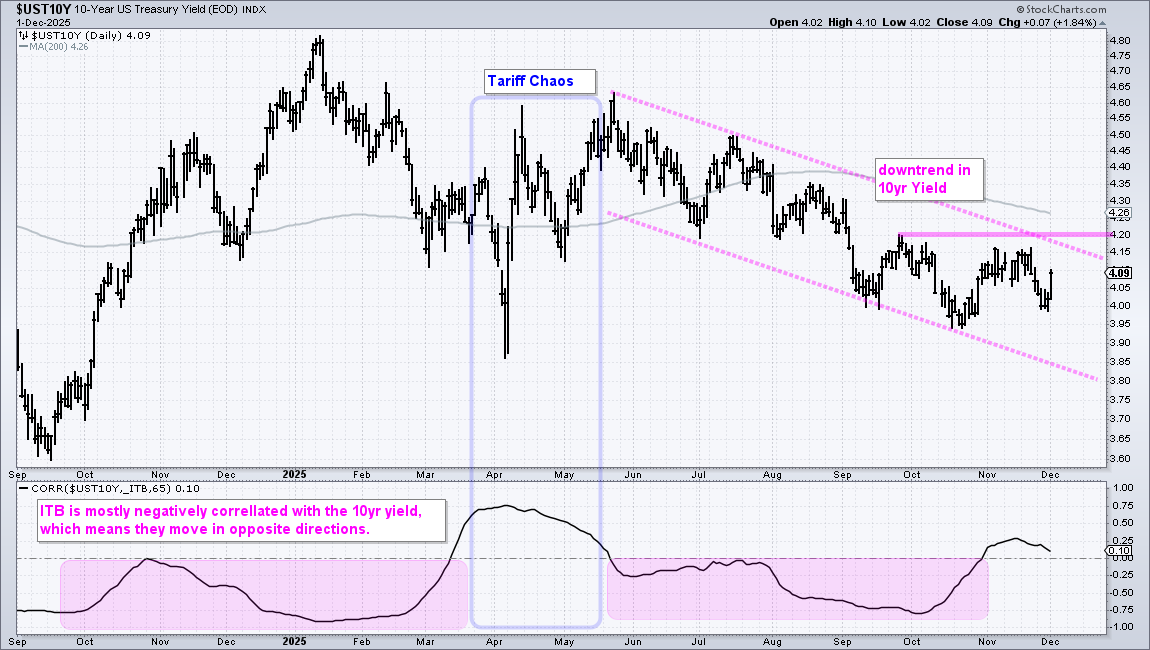
The 10yr T-Yield ($TNX) fell from 4.15% to 4% from November 20th to 26th. This sharp decline lifted housing stocks as the Home Construction ETF (ITB) and Homebuilders ETF (XHB) broke out. However, the 10yr T-Yield surged back to the 4.10% area on Monday and cannot seem to push through 3.95%. The chart below shows the 10yr Yield in a clear downtrend since late May. The September-November highs mark resistance in the 4.15-4.20 percent area. A breakout at 4.20% would be bullish for yields and bearish for bonds. Until such a breakout, the downtrend rules. Note that a breakout at 4.20% could be negative for housing, banks and small-caps.
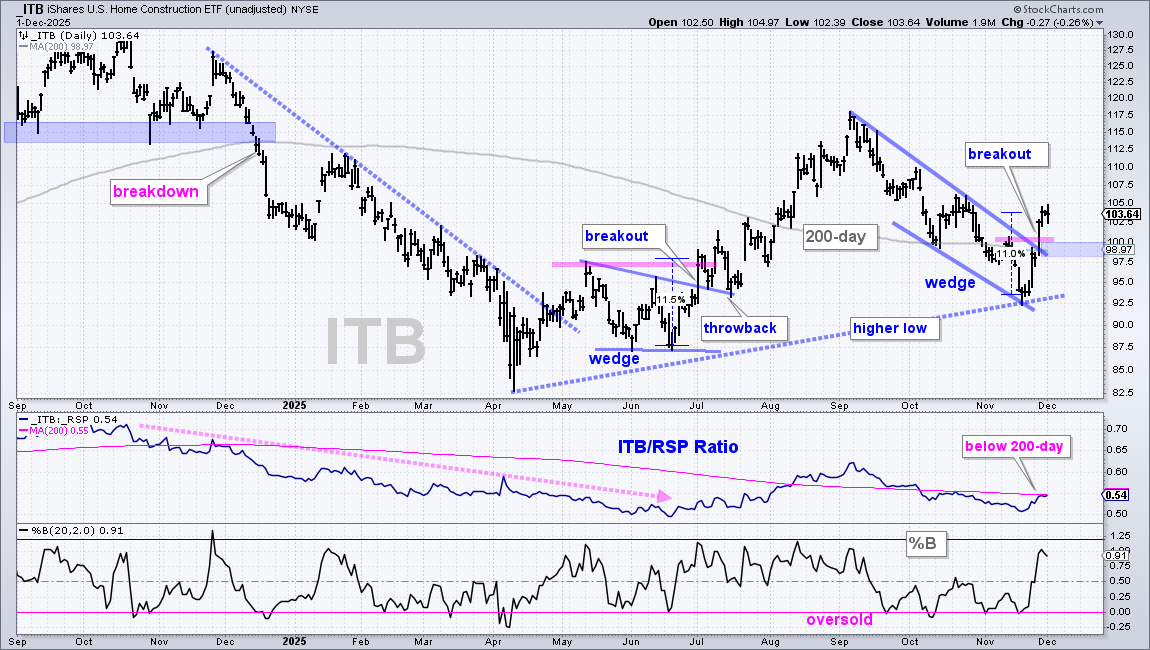
A downtrend in the 10yr yield is positive for ITB because these two are negatively correlated (for the most part). The chart below shows ITB falling from September to November and then breaking out in late November with an 11% surge. Notice that the early July breakout started with an 11.5% surge – and there was a throwback to the wedge line after this breakout surge (mid July). ITB also broke a wedge line in late November and the breakout zone turns first support (98-100) to watch on a throwback (blue shading). Waiting for a throwback would also offer a better risk/reward ratio.
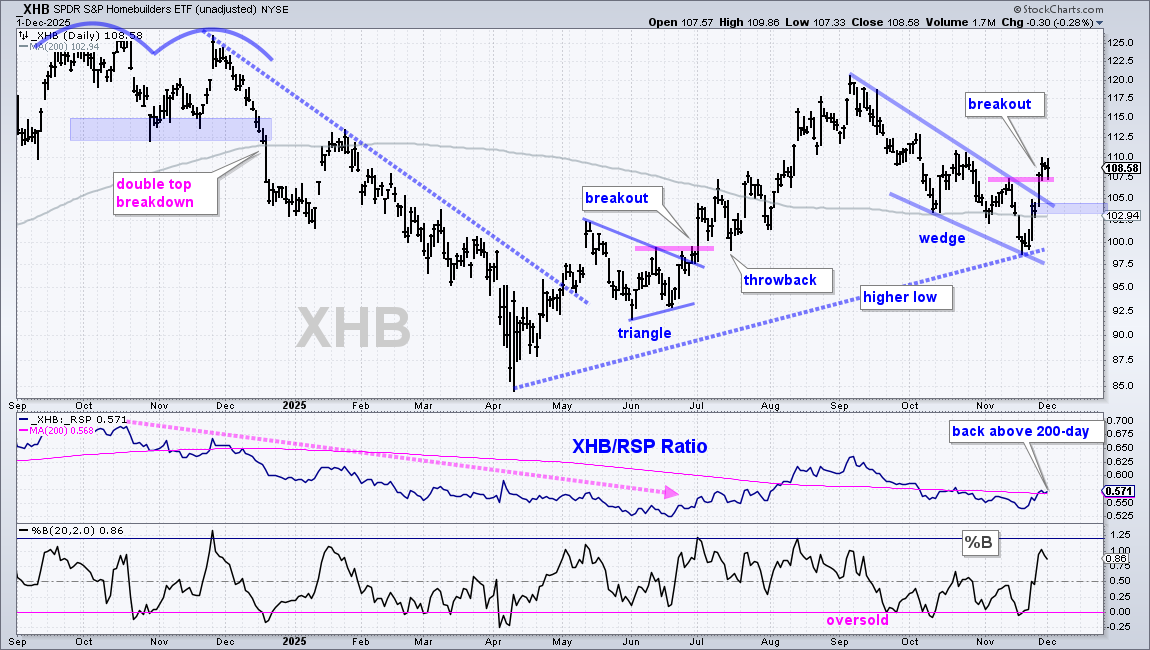
The next chart shows the Homebuilders ETF (XHB) with similar characteristics.
What a Difference Two Weeks/Days Make (XRT)
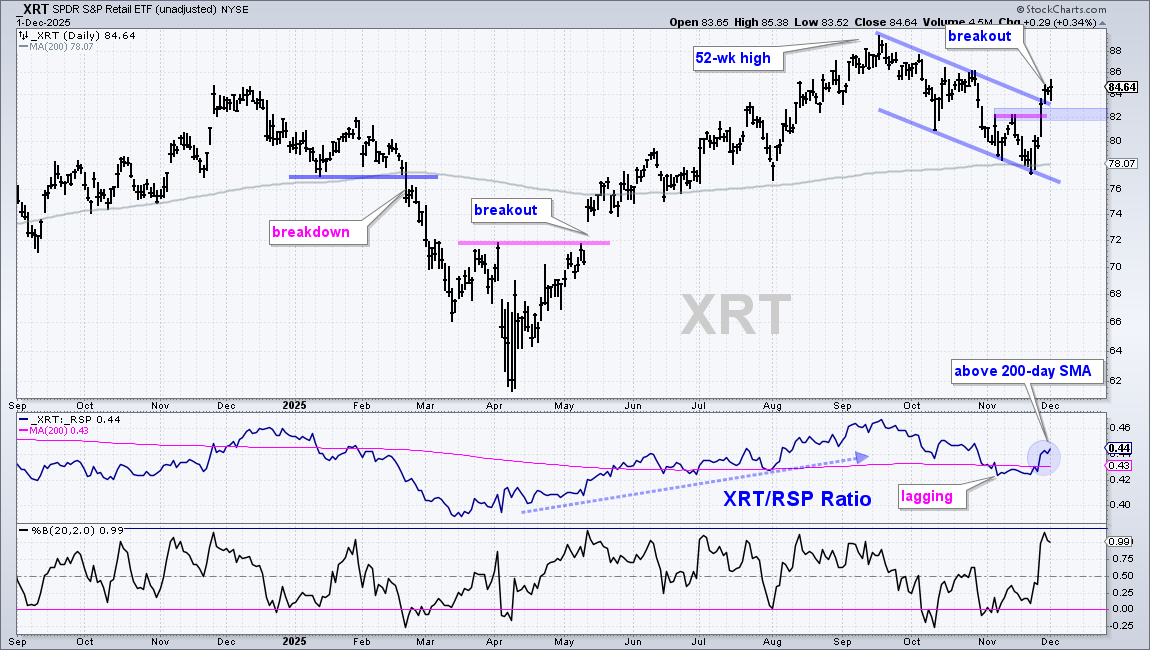
The Retail SPDR (XRT) was in a precarious spot two weeks ago as it closed below its 200-day SMA on November 20th and the price-relative was below its 200-day SMA. This situation abruptly changed as XRT surged above its mid November high and the price-relative recaptured its 200-day SMA. XRT also broke the falling channel line as it moved from laggard to leader. Black Friday and Cyber Monday expectations can do wonders. Technically, there is a breakout on the price chart with the breakout zone turning first support to watch on a throwback (blue shading).
Infrastructure and Telecom Still Leading
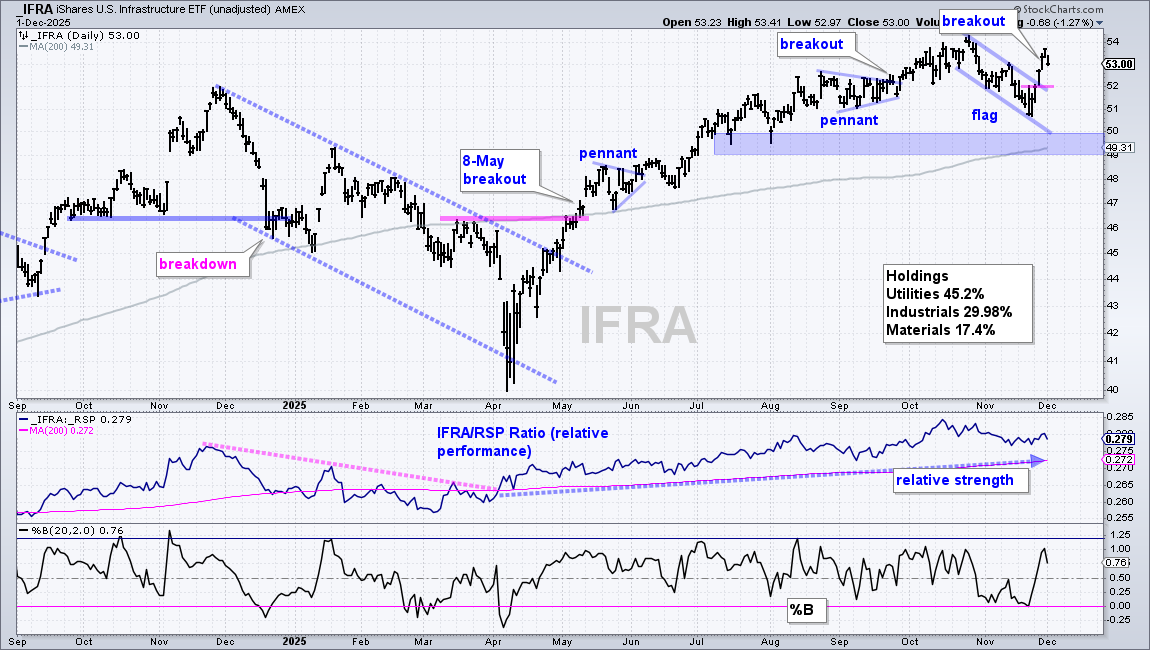
The Infrastructure ETF (IFRA) and the Telecom ETF (IYZ) remain in leading uptrends and recently broke out of short-term pullback patterns. The chart below shows IFRA with a new high in October, a flag into November and a flag breakout in late November. In the middle window, the price-relative (IFRA/RSP ratio) remains above its 200-day SMA as IFRA shows long-term relative strength.
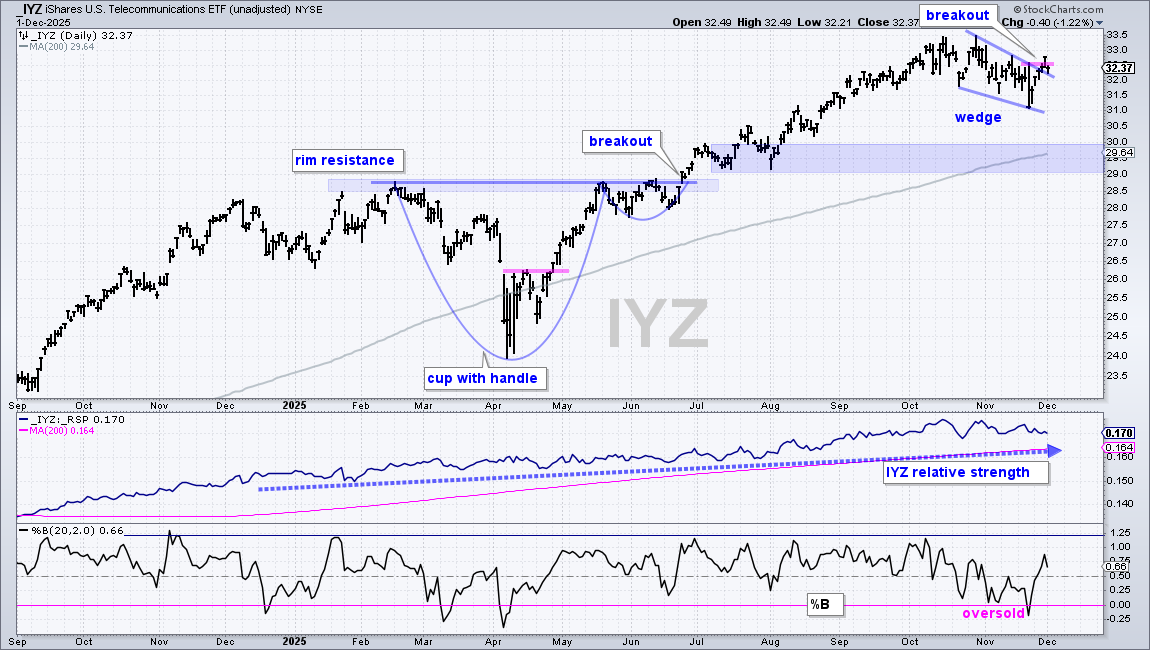
The next chart shows IYZ with new highs in October, a falling wedge into November and a breakout surge in late November. In the middle window, the price-relative (IYZ/RSP ratio) remains above its 200-day SMA, which means IYZ is outperforming.
DISCLAIMER: This content provided strictly for informational and educational purposes. It should not be interpreted as an offer to buy or sell any security, nor as a solicitation to engage in any investment activity. Nothing here constitutes a recommendation regarding any specific security, portfolio, transaction, or investment strategy.
At times, the author or affiliates may hold positions or interests in securities discussed. Any stocks or examples mentioned are not endorsements or suggestions to purchase. This material does not consider your individual financial goals or circumstances, and you should seek guidance from a qualified financial or investment adviser before making any trading or investment decisions.
Past performance does not guarantee future results.
Send feedback to support(at)trendinvestorpro.com or use the contact form. [1]