Copper Consolidates as DBB becomes Oversold – Bond and Uranium ETFs Set Up
Posted By
Arthur Hill, CMT
On
In
Archive |
No Comments
Headlines
Precious Metals Lead as Bitcoin Lags
Gold and Silver Surge after Pullbacks
Gold and Silver Miners Follow Gold
Copper Consolidates within Uptrend
Uranium Forms Bullish Triangle
Bonds Bounce after becoming Oversold
Bitcoin in Downtrend and Underperforming
The next report will be the Friday Chart Fix (November 21th).
The next Premium report/video will be on Tuesday, December 2nd.
Holiday Scheduling
Next week is a holiday Week with Thanksgiving on Thursday and Black Friday. Trading is typically slow and uneventful during this shortened week so I take the chance to spend time with family and friends. There will not be any reports or videos next week.
Thursday, November 27th: Market Closed.
Friday, November 28th: Market Closes at 1PM.
Saturday, November 29th: Systematic Signals and Ranking Table Updates
Precious Metals Lead as Bitcoin Lags
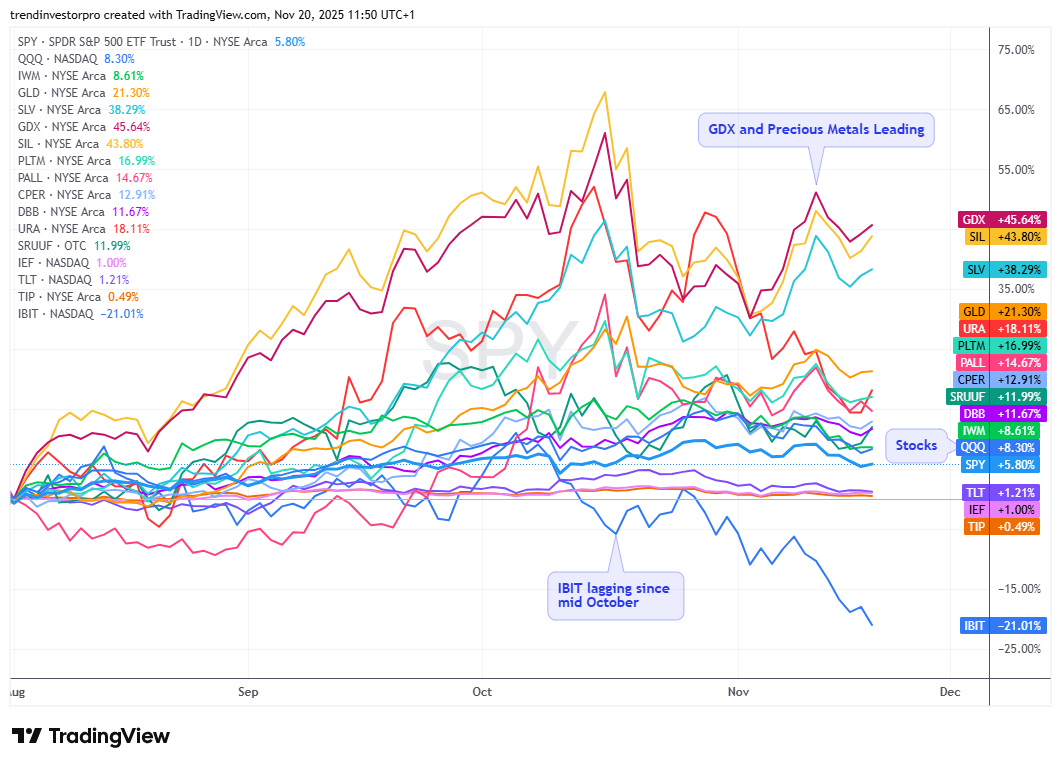
Asset class performance since August is quite telling. Precious metals related ETFs are leading the charge with the Gold Miners ETF (GDX) up some 46%. Copper (CPER), Base Metals (DBB) and Uranium (SRUUF) are in the middle of the pack with double digit gains. Stocks are at the low end with QQQ and IWM up over 8%. These 8+ percent gains look small because the gains in metals are so big. Even lowly bonds are up since August with positive numbers for TLT, IEF and TIP. Only one asset is down: the Bitcoin ETF (IBIT). Signs of relative and absolute weakness became apparent in mid October when IBIT was down over 5% and the other 16 ETFs were positive.
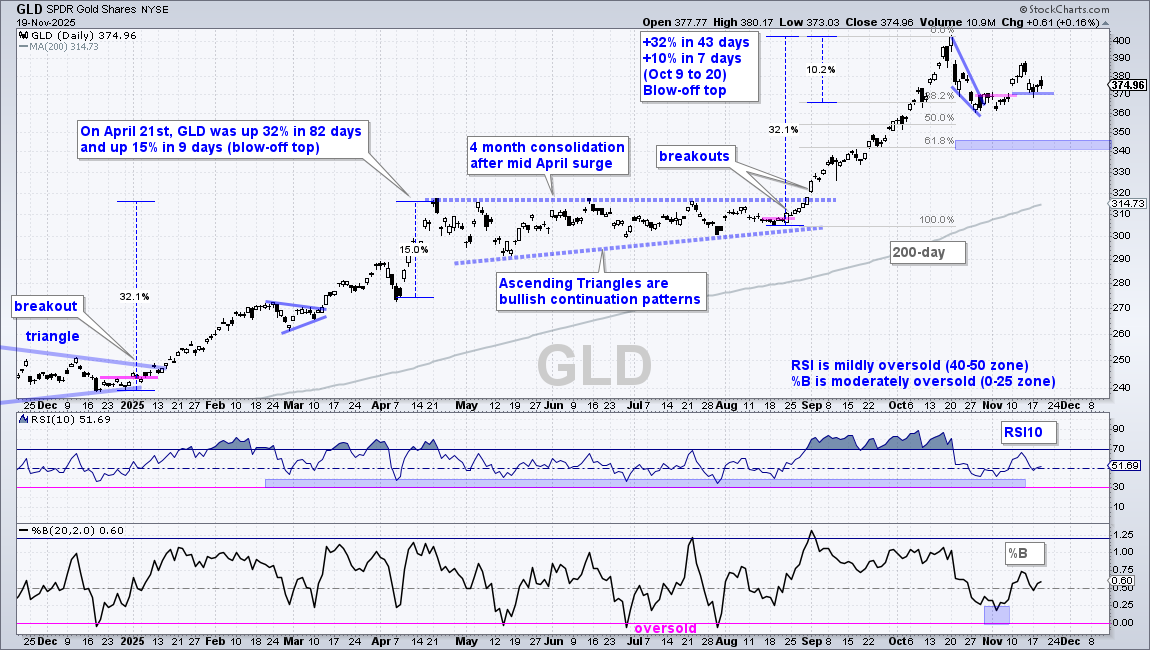
The Gold SPDR (GLD) remains in a long-term uptrend with a new high in mid October and price well above its rising 200-day SMA. Short-term, GLD corrected with a steep falling wedge that retraced 38-50 percent of the August-October surge and turned back up with a breakout on October 30th. GLD surged in early November, and then fell back to the breakout zone on Friday-Monday (370 area). A close below 370 would negate the breakout and, perhaps, lead to a deeper pullback. The next area to watch would be the 340 area, which is marked by the 61.8% retracement. Even with a decline to 340, GLD would still be in a long-term uptrend and such a decline would be deemed a correction within this uptrend.
Now is the time to plan your trade. Plan for different scenarios and decide what you are going to do should GLD break 370. Are you going to hold and exit on a long-term trend change? Are you going to exit and then wait for the next setup to materialize?
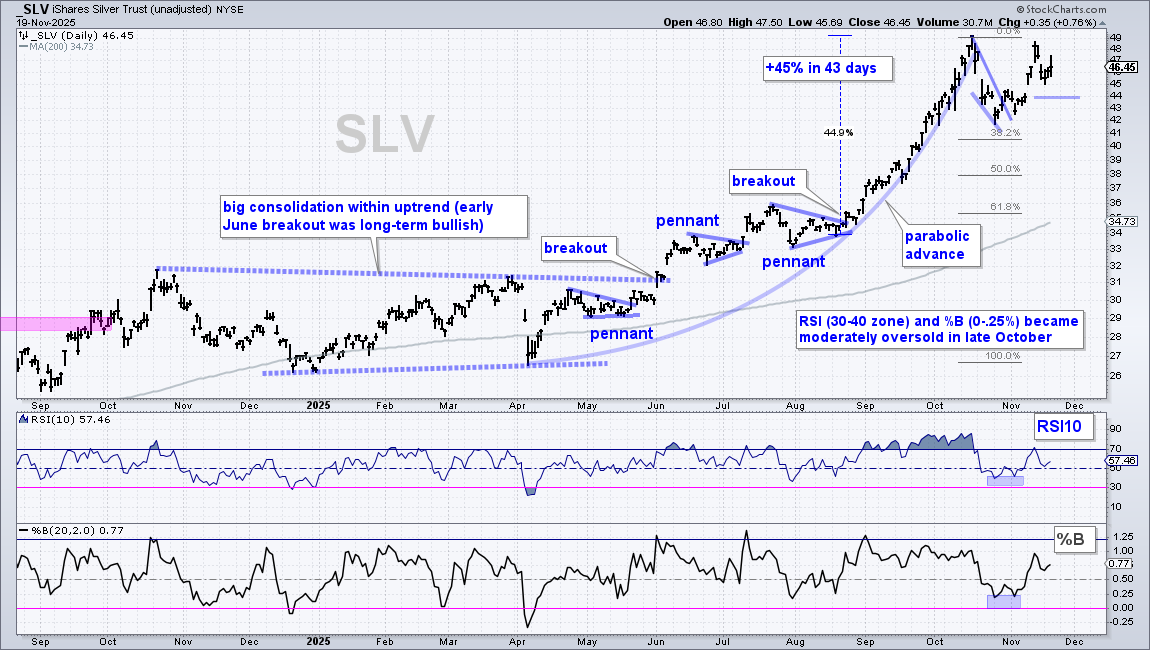
The next chart shows the Silver ETF (SLV) going parabolic with a surge into mid October. SLV then corrected with a sharp pullback and broke the wedge line in late October. This breakout remains valid as long as 44 holds. A break below 44 would negate the breakout and put SLV back in correction mode. Corrections are unpredictable. We could see a trading range between 42 and 49 or a pullback that exceeds the October low. Silver will follow gold, but the moves will be more exaggerated (volatile). A 50% retracement of the entire parabolic advance would extend to the 38 area.
GDX Holds Breakout as SIL Stutters
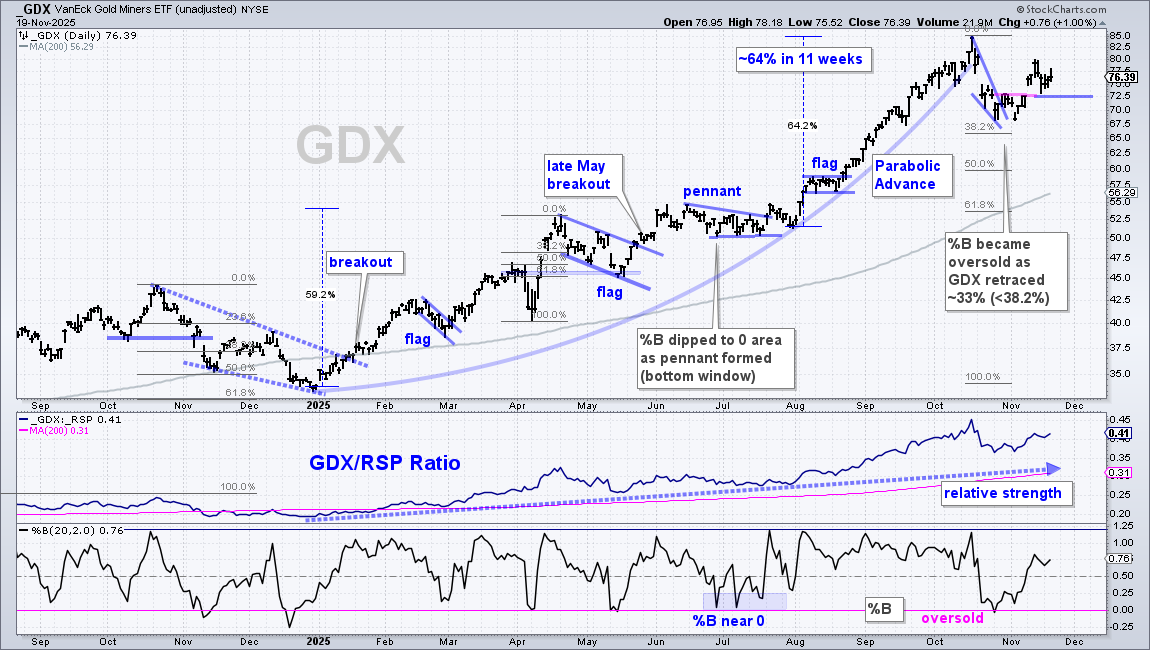
The Gold Miners ETF (GDX) steadily advanced from January to July and then went parabolic from August to early October. GDX then corrected with a steep wedge, broke the wedge line in late October and short-term resistance with a strong move in early November. This short-term breakout is valid as long as 72.50 holds. A close below 72.5 would negate the breakout and put GDX back in corrective mode. In theory, GDX could retrace 50% of the 2025 advance and still be in a long-term uptrend (above the rising 200-day SMA).
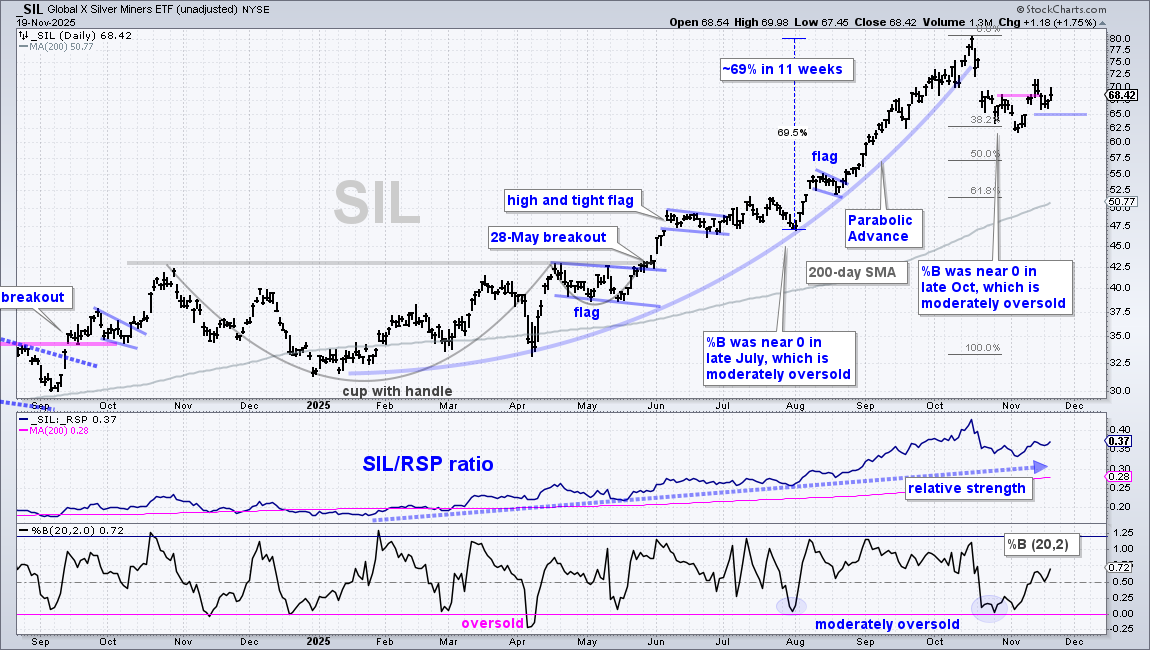
The next chart shows the Silver Miners ETF (SIL) with a similar chart. SIL broke short-term resistance with a rebound in early November, but remains well below its mid October high. SLV, in contrast, surged back to its October high last week. SIL is lagging and looks the most vulnerable of the four. It is also the most volatile (risky). A break below 65 would negate the early November breakout and put SIL back in corrective mode.
Copper Consolidates as Base Metals Become Oversold
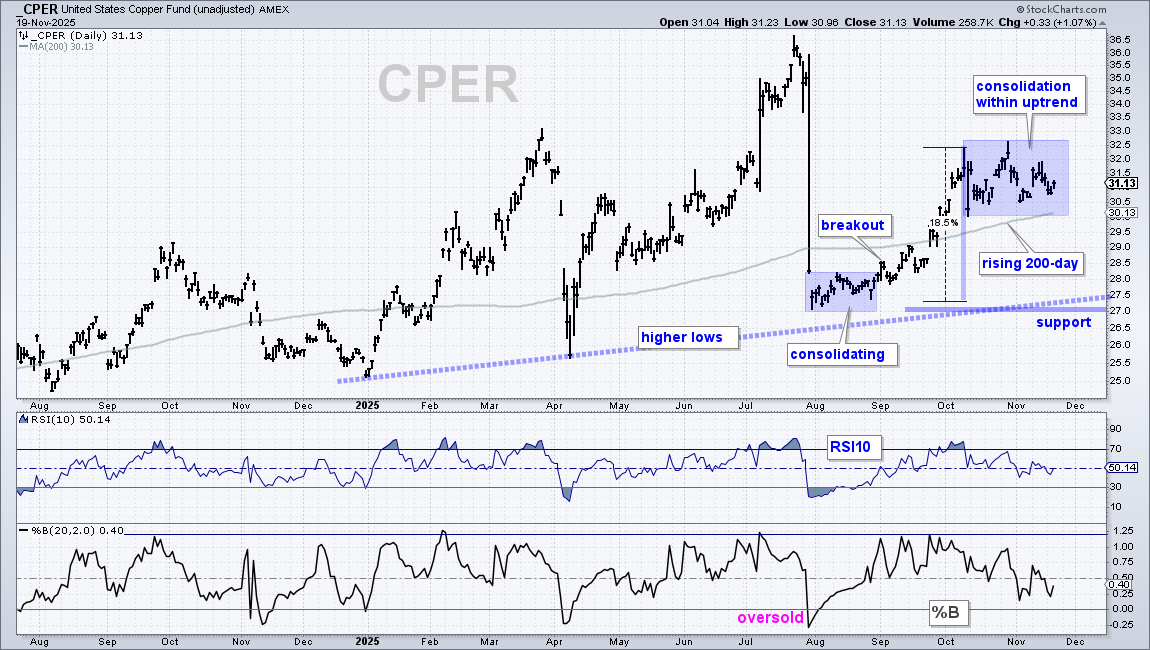
The Copper ETF (CPER) remains in a long-term uptrend with price consolidating after an 18.5% surge (no change). CPER is also consolidating above the rising 200-day SMA, which is positive. A consolidation within an uptrend or after a sharp advance is typically a bullish continuation pattern. As such, I expect an upside breakout and continuation higher. While a break below the 200-day SMA would seem negative, I would not view this as a bearish trend signal because CPER shows a propensity to break the 200-day and then rebound (see April and late July). Long-term support remains at 27.
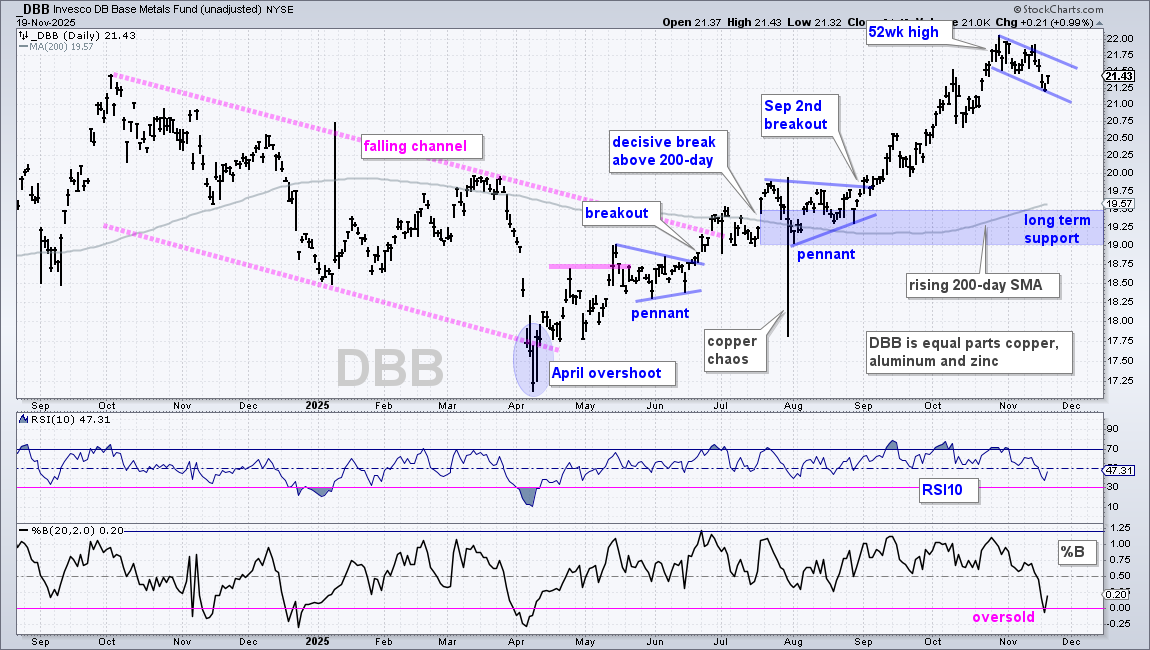
The DB Base Metals ETF (DBB) remains in a leading uptrend with a new high in late October. DBB pulled back in November and became oversold this week as %B dipped below 0 (lower window). This is the first oversold reading since breaking above the 200-day SMA in July. Oversold conditions within leading uptrends present opportunities to enter the trend at a discount. On the price chart, DBB formed a falling flag of sorts and a breakout at 21.75 would reverse this short-term slide.
Uranium ETF Bounces off Support Zone
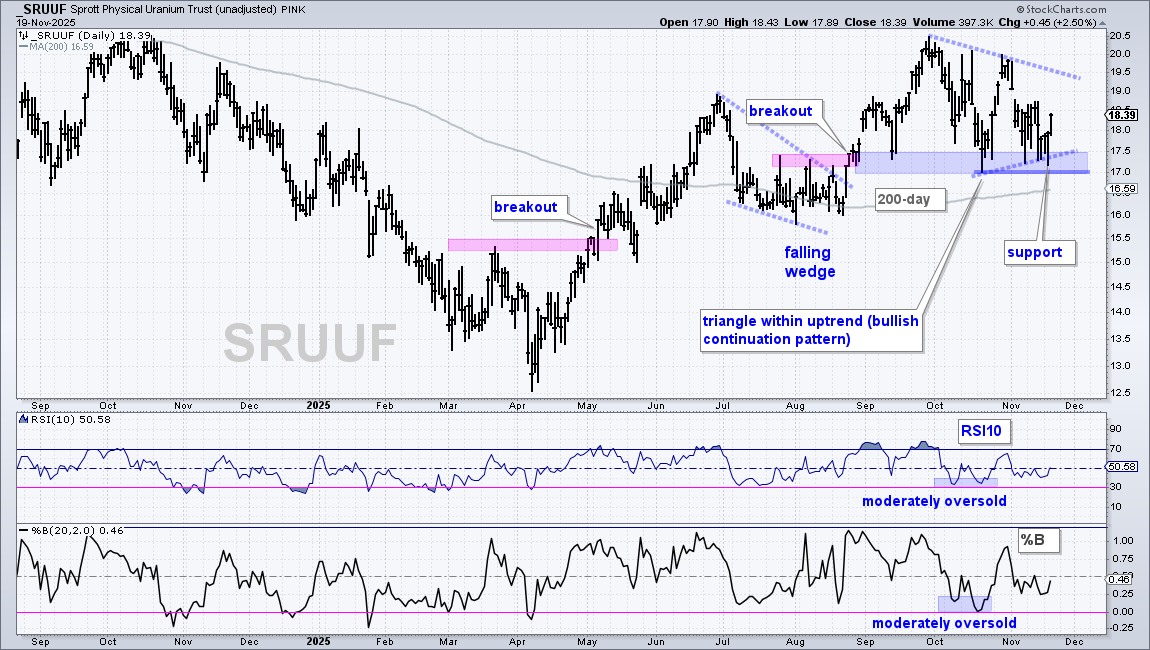
There is no change in the Sprott Physical Uranium ETF (SRUUF), which remains in a long-term uptrend and above the rising 200-day SMA. After the September surge, the ETF moved into a volatile trading range since October. Broken resistance turned support in the 17-17.5 area and held with bounces in late October and early November. A triangle is now taking shape, and this is a continuation pattern. A breakout at 20 would signal an end to the correction and a resumption of the long-term uptrend. Short-term, SRUUF is attempting to bounce off the support zone again this week. This bounce offers a lower risk entry opportunity to anticipate a triangle breakout at 20. A close below 17 would break support and negate the setup.
IEF Consolidates above Support Zone
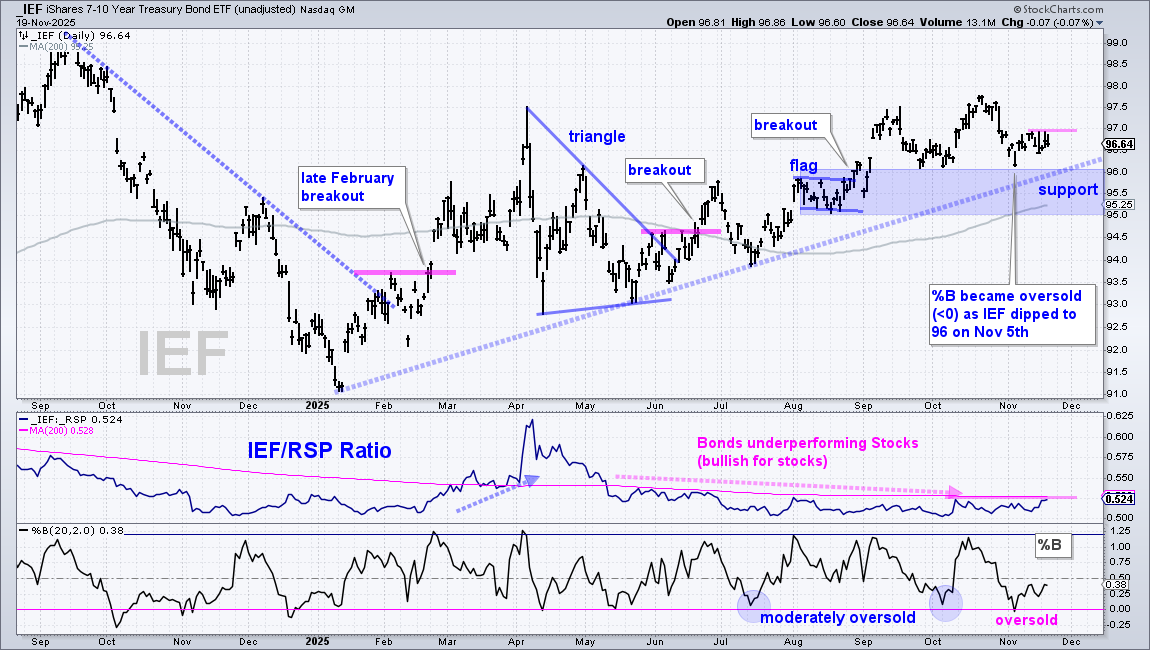
I am going focus on the 7-10Yr TBond ETF (IEF) for the bond market because the 20+Yr TBond ETF (TLT) is lagging IEF. The chart below shows IEF with an uptrend since the February breakout. The ETF forged higher highs and higher lows since this breakout and remains above its rising 200-day SMA. Long-term support is set in the 95-96 area. Short-term, IEF consolidated above this support zone with a trading range since mid September. The ETF fell back to 96 in early November and then stalled the last two weeks. Short-term resistance is set at 97 and a breakout here would provide the first bullish signal. A breakout would signal an upturn and continuation of the long-term uptrend. Also notice that %B became oversold as IEF fell to 96 on November 5th.
Bitcoin Extends after Breakdown
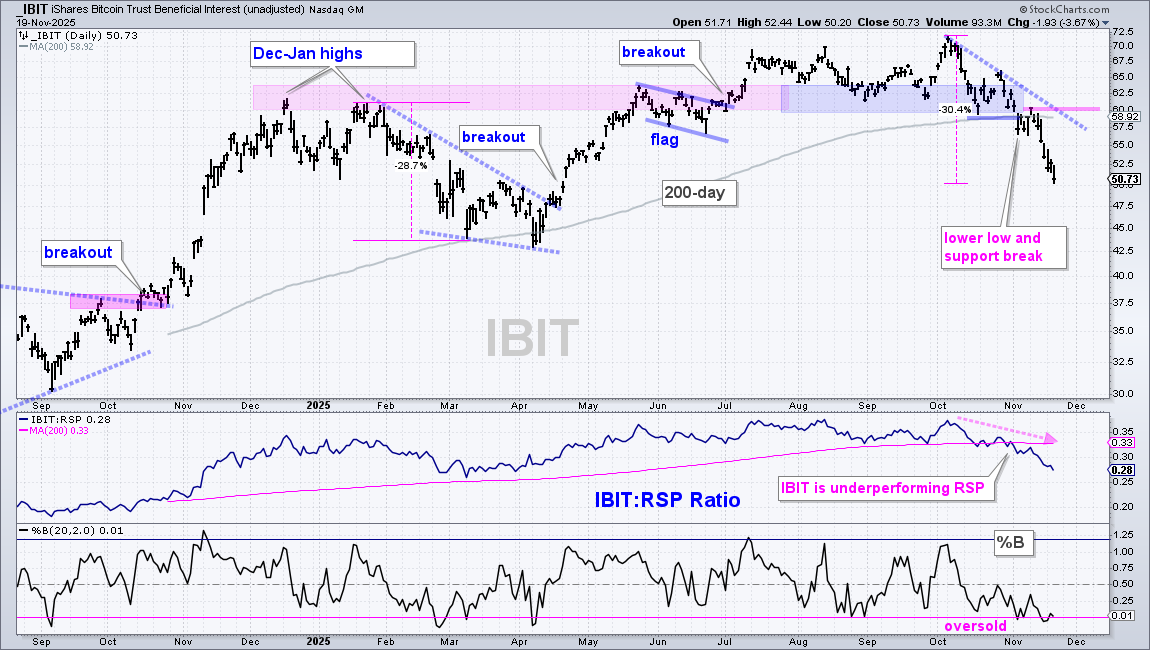
The Bitcoin ETF (IBIT) broke down on November 4th and accelerated lower the last seven days. From high to low, IBIT is down around 30% the last 32 trading days. This decline compares to the 28.7% decline in January-February, which covered 33 trading days. IBIT is clearly oversold, but also broken. The long-term trend is down and I do not see a bullish setup. While oversold conditions could give way to a bounce, this would be just an oversold bounce within a stronger downtrend. The broken support zone in the 60 area turns first resistance. Here we also have the 200-day SMA, which is starting to roll over. The middle window shows IBIT underperforming the S&P 500 EW ETF (RSP) as the price-relative (IBIT:RSP ratio) broke its 200-day SMA in mid October and extended sharply lower in November.
DISCLAIMER: This content provided strictly for informational and educational purposes. It should not be interpreted as an offer to buy or sell any security, nor as a solicitation to engage in any investment activity. Nothing here constitutes a recommendation regarding any specific security, portfolio, transaction, or investment strategy.
At times, the author or affiliates may hold positions or interests in securities discussed. Any stocks or examples mentioned are not endorsements or suggestions to purchase. This material does not consider your individual financial goals or circumstances, and you should seek guidance from a qualified financial or investment adviser before making any trading or investment decisions.
Past performance does not guarantee future results.
Send feedback to support(at)trendinvestorpro.com or use the contact form. [2]