Headlines
- TradingView Charts with 3 TimeFrames
- Qualcomm Tests Breakout Zone
- Gen Digital Surges after Deep Pullback
- Unity Software Tests Support after Throwback
I will update the Market Regime page later today.
Holiday Scheduling
Next week is a holiday Week with Thanksgiving on Thursday and Black Friday. Trading is typically slow and uneventful during this shortened week so I take the chance to spend time with family and friends. There will not be any reports or videos next week.
- Thursday, November 27th: Market Closed.
- Friday, November 28th: Market Closes at 1PM.
- Saturday, November 29th: Systematic Signals and Ranking Table Updates
Previous Reports Covering Stock Trends, Setups and Breakouts
November 19th [1]: Nucor (NUE), Danaher (DHR), Pfizer (PFE), Northrop Grumman (NOC), Norfolk Southern (NSC), AES Corp (AES)
November 5th [2]: Consumer Staples SPDR (XLP), Costco (COST), CSX Corp (CSX), Heico (HEI), Entergy (ETR), Excel Energy (XEL)
October 29th: [3] Cadence Design (CDNS), Tesla (TSLA), Burlington (BURL), Newmont Mining (NEM), Freeport McMoran (FCX)
October 22nd: [4] CrowdStrike (CRWD), Palo Alto Networks (PALO), StandardAero (SARO), Veeva System (VEEV), Home Construction ETF (ITB), Homebuilders ETF (XHB) , Home Depot (HD)
October 15th: [5]Archer Daniels (ADM), Costco (COST), Train Technologies (TT), Emerson Electric (EMR), Network Appliance (NTAP), Samsara (IOT)
TradingView Charts with 3 Timeframes
The following charts are from TradingView because I want to show three timeframes with annotations. Here is an affiliate link for more information on their charts and the Black Friday deal. [6]
SharpCharts from StockCharts are as crisp and clean as they get, and StockCharts ACP offers access to some great indicators. Annotating works great with SharpCharts, but it is cumbersome with StockCharts ACP.
I like to see three timeframes when looking for trading setups. These TradingView charts show a daily candlestick chart in the top window with the 200-day SMA, %B (20,2) and the price-relative (symbol/RSP ratio). %B is used to find oversold conditions within an uptrend, while the price-relative measures relative performance.
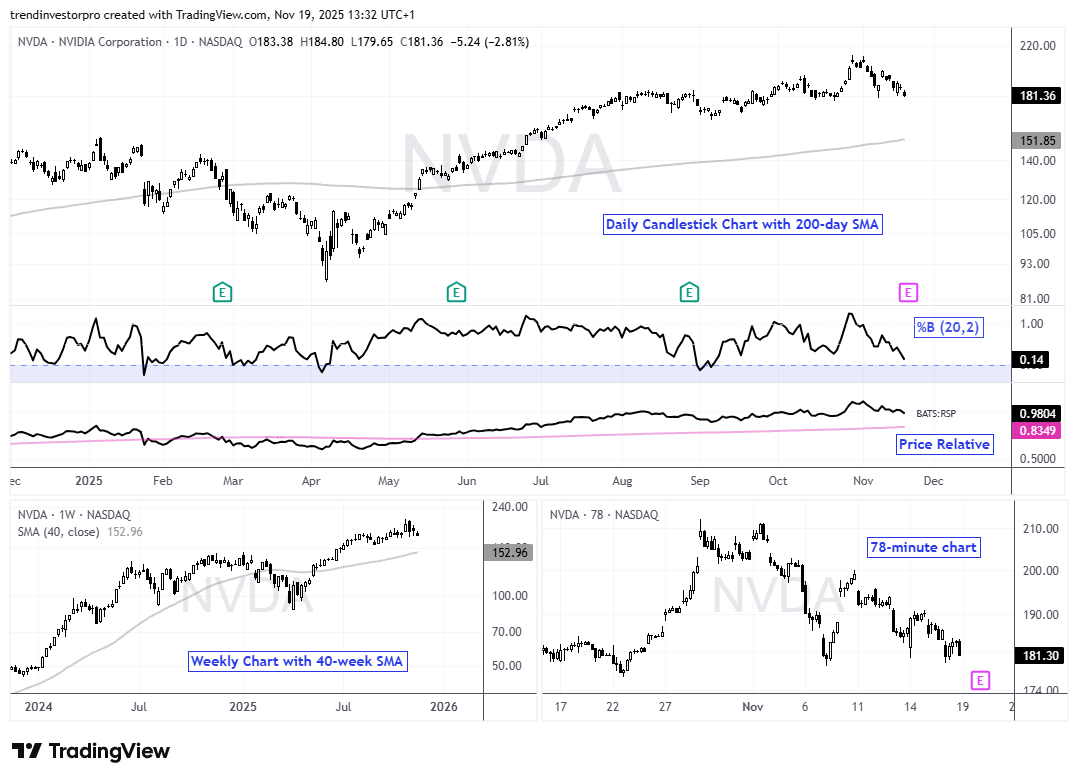
Below the daily chart, we have a weekly candlestick charts with a 40-week SMA. This chart provides a long-term perspective. Short-term, there is a 78-minute candle, which is 5 candles per day (390 minutes in a normal trading day).
TradingView runs some great Black Friday deals. I signed up a few years ago and renew every year with the Black Friday deal. Here is an affiliate link. [6]
Qualcomm Tests Breakout Zone
Qualcomm (QCOM) is part of the Semiconductor ETF (SMH), and perhaps even part of the AI trade with its new chip offerings. QCOM also offers products and services for cellphones and computers.
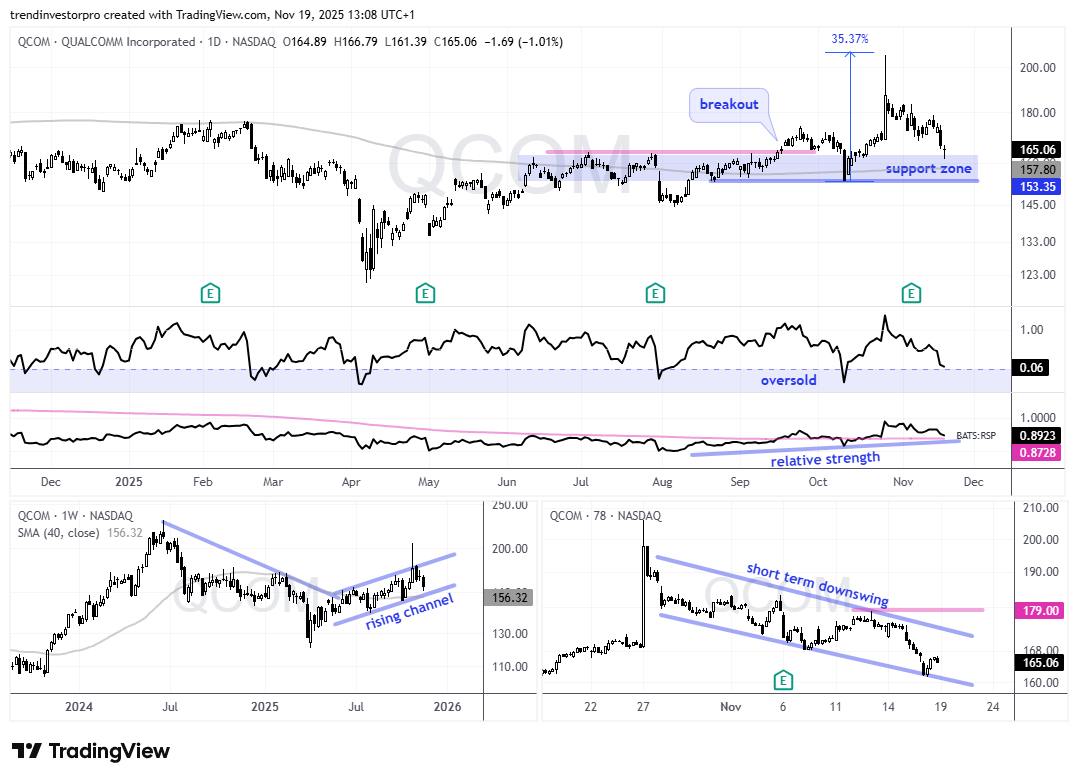
The weekly chart (lower left) shows a rising channel since June 2025 and price above the 40-week SMA. The daily chart sports a breakout in September, a hard throwback on October 10th and a surge above 180 with a long white candlestick. Even though the stock gave back the one-day surge, it is trading near the top of a support zone (blue shading). This zone stems from broken resistance and the October low. Overall, I see a 35% surge from the October 10th low and a correction after this surge. The 78 minute chart defines this pullback with resistance marked at 179. A breakout here would reverse this downswing and argue for a continuation higher. A close below the October 10th low would call for a re-evaluation.
Gen Digital Surges after Deep Pullback
Gen Digital (GEN) is part of the Cybersecurity ETF (CIBR). The company provides cybersecurity and other systems management services under the brands Norton, AVAST, CCleaner, Avira and Lifelock.
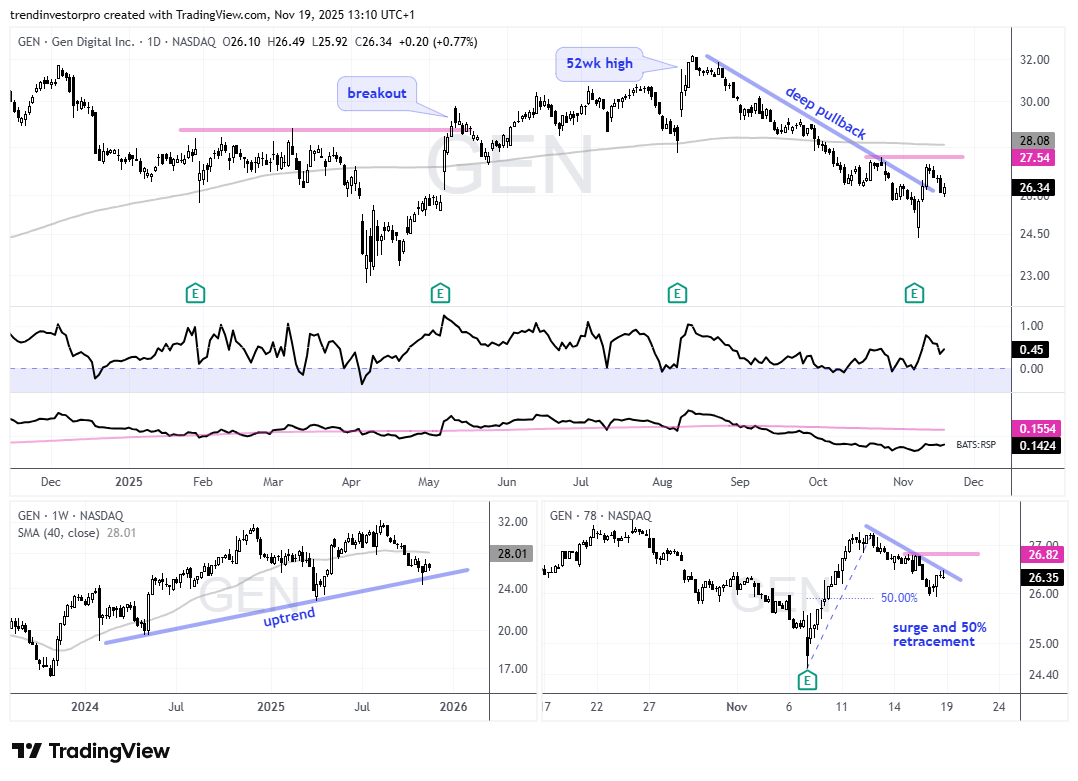
The weekly chart (lower left) shows an overall uptrend with price falling back to the trendline extending up from 2024. A hammer formed three weeks ago as buying pressure appeared in the 25 area. On the daily chart, GEN hit a new high in August and fell back with a deep pullback into early November. The stock then surged with three strong days and broke the trendline. This is the first step towards a trend reversal. Follow through above the late October high would complete this reversal. The 78-minute chart shows the stock retracing 50% of the early November surge and firming with a bounce on Tuesday. A breakout at 26.82 would provide the first sign that GEN will attempt a bigger breakout on the daily chart.
Unity Software Tests Support after Throwback
Unity Software (U) is part of the Software ETF (IGV), but a very small part with a .43% weighting. The company provides software and services to develop video games for phones, tablets, consoles and augmented reality.
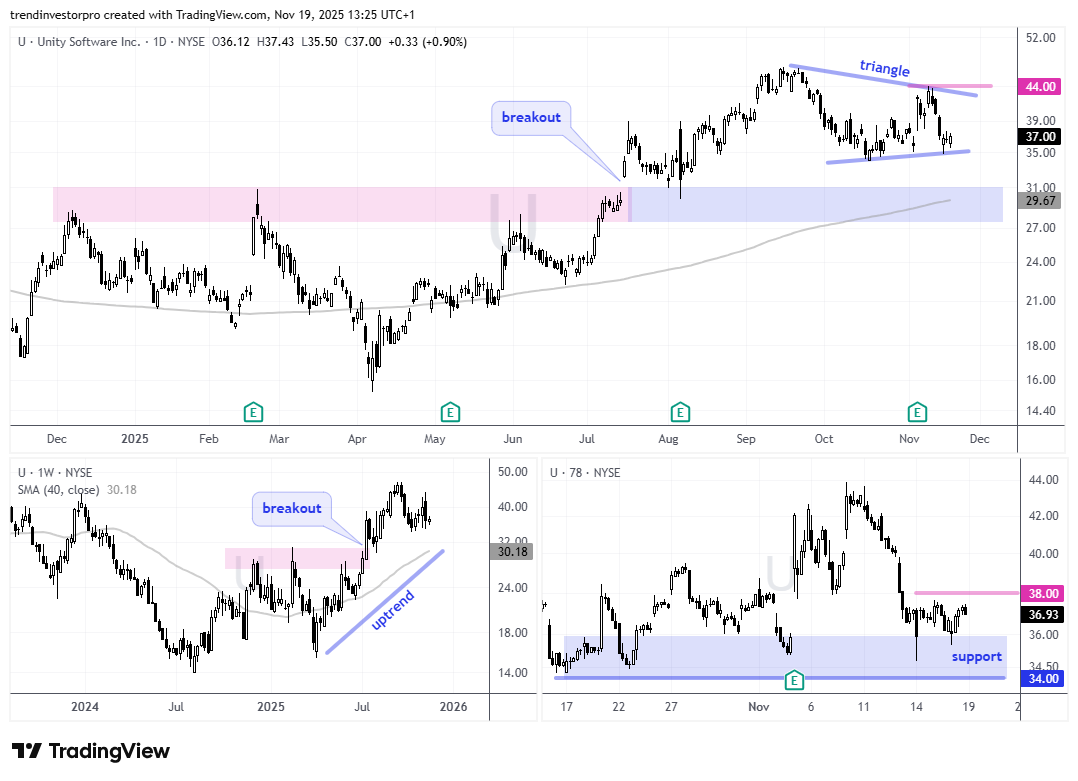
This next chart shows price without the indicators. The weekly chart shows a big breakout in early July and move to 52-week highs in September. On the daily chart, the stock consolidated after the April-September run with a triangle above the resistance zone. A triangle after an advance is a bullish continuation pattern and a breakout at 44 would signal a continuation higher. Short-term, the stock surged after earnings in early November, but gave it all back with a decline back to the 35 area last week. Unity then firmed the last three days, which is why I am drawing the lower line of the triangle. This 35 area is a make or break zone. The 78-minute chart shows a support zone in the 34-36 area (blue shading). A breakout at 38 would provide the first sign of a successful test and increase the chances for a bigger triangle breakout. A close below 34 would call for a re-evaluation of this bullish setup.
DISCLAIMER: This content provided strictly for informational and educational purposes. It should not be interpreted as an offer to buy or sell any security, nor as a solicitation to engage in any investment activity. Nothing here constitutes a recommendation regarding any specific security, portfolio, transaction, or investment strategy.
At times, the author or affiliates may hold positions or interests in securities discussed. Any stocks or examples mentioned are not endorsements or suggestions to purchase. This material does not consider your individual financial goals or circumstances, and you should seek guidance from a qualified financial or investment adviser before making any trading or investment decisions.
Past performance does not guarantee future results.
Send feedback to support(at)trendinvestorpro.com or use the contact form. [7]