Gold/Silver Surge from Oversold Levels – Bond/Uranium ETFs Set Up – Bitcoin Lags with Downtrend
Posted By
Arthur Hill, CMT
On
In
Archive |
No Comments
Headlines
Precious Metals Lead as Bitcoin Lags
Gold and Silver Surge after Pullbacks
Gold and Silver Miners Follow Gold
Copper Consolidates within Uptrend
Uranium Forms Bullish Triangle
Bonds Bounce after becoming Oversold
Bitcoin in Downtrend and Underperforming
The next report will be the Friday Chart Fix (November 14th).
The next Premium report/video will be on Tuesday, November 18th.
Precious Metals Lead as Bitcoin Lags
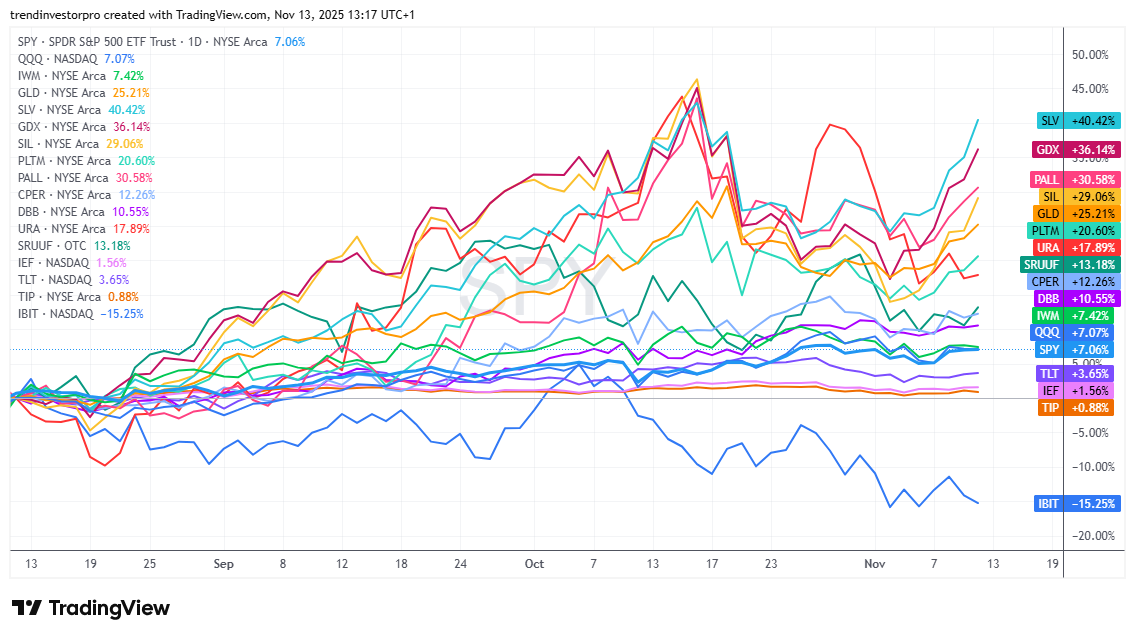
Precious metals continue to lead the pack with the Silver ETF (SLV) sporting the biggest gain over the last three months (+40%). Industrial metals are also outperforming stocks with the Copper ETF (CPER) and DB Base Metals ETF (DBB) up over 10%. QQQ is up a measly 7%. Even bonds are up with TLT gaining 3.65% and IEF up 1.5%. The Bitcoin ETF (IBIT) is the lone decliner with a 15.25% loss over the last 65 days (blue line at bottom).
Gold, silver and gold miners set up in late October with oversold conditions in long-term uptrend. They bounced sharply the last 12 days, which puts them back in the trend-monitoring phase (no setup). Copper is setting up with a possible flag and uranium has a bullish triangle forming. Bonds are also in setup mode as they bounce from oversold levels the last five days. Bitcoin is in a downtrend and off the radar for bullish setups.
Gold and Silver Surge after Pullbacks
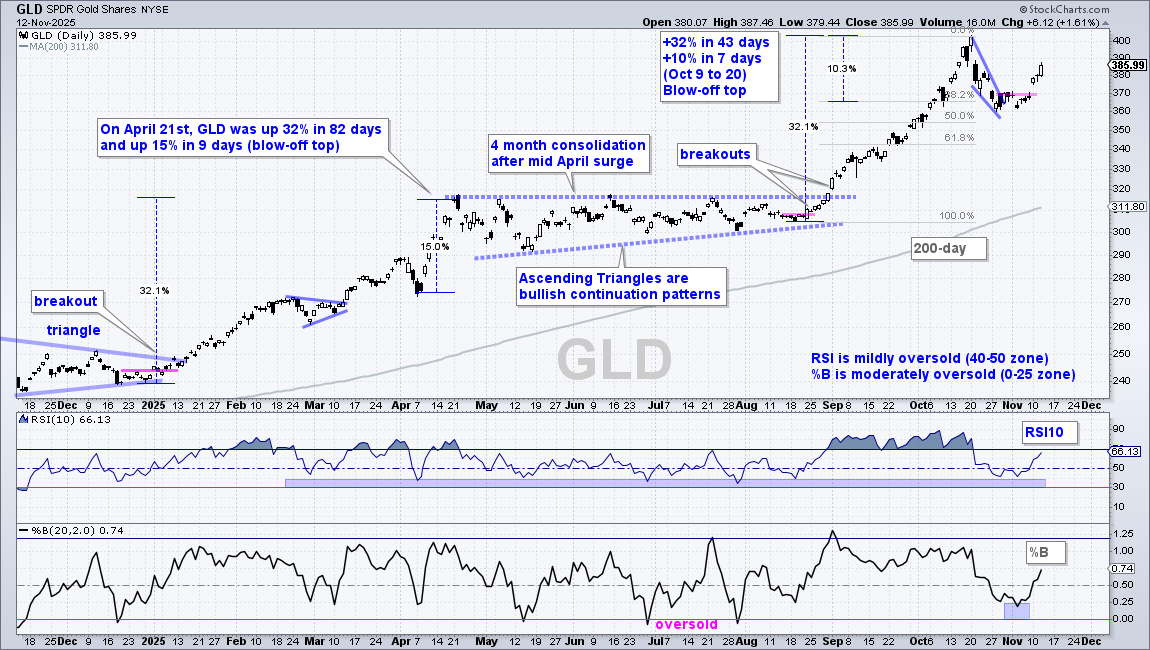
The Gold SPDR (GLD) resumed its uptrend with a fractional breakout on October 30th and a surge this week. Even with the sharp decline in late October, GLD was still in a leading uptrend and this decline was deemed a pullback/correction within that uptrend. Also notice that %B was moderately oversold with a dip into the 0-.25 area. As noted on October 30th[1], the decline retraced 38-50 percent with a steep falling wedge and triggered a marginal breakout with a close above 370 (370.13). After dipping and stalling the last few days, GLD surged this week to solidify the breakout.
Short-term, a close below 370 would negate the wedge breakout and argue for a deeper correction within the uptrend. I could mark support using the lows from late October to early November (360), but I think this would be a minor support level. In other words, GLD could break 360 and still be correcting within a long-term uptrend. Therefore, I am not going to mark support right now.
The Silver ETF (SLV), Gold Miners ETF (GDX) and Silver Miners ETF (SIL) are going to follow gold. They are positively correlated to gold and move in the same direction, but in different measures because they are more volatile than gold. The 21-day annualized standard deviation numbers are: GLD 34%, SLV 46%, GDX 58% and SIL 61%. These are volatile names so expect a wild ride. One strategy is to use GLD for signals and trade the other names for leverage. GLD signals are less prone to whipsaw because GLD has the lowest volatility of the four.
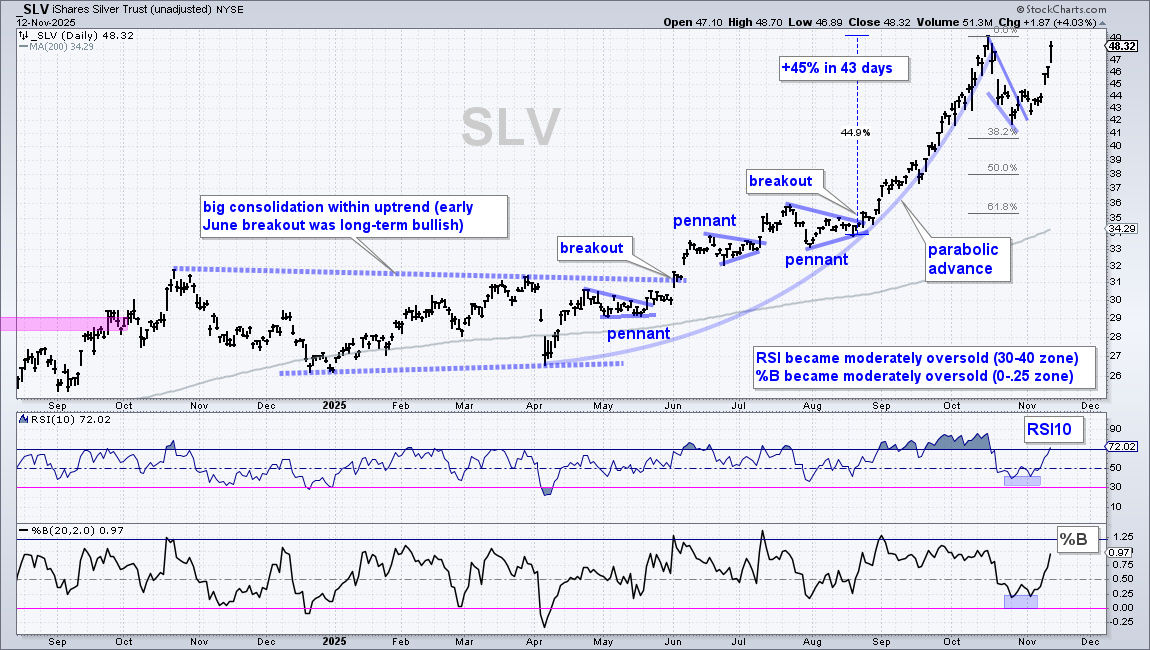
The next chart shows the Silver ETF (SLV) with a parabolic advance into mid October, a sharp correction into late October and a 14% gain the last 12 days. This decline retraced about a third of the 45% advance from August to October, which is normal for a correction. Also, notice that RSI(10) and %B(20,2) became moderately oversold with moves into the 30-40 and 0-.25 areas, respectively. Moderately oversold readings are also “normal” in strong uptrends. This is because eager buyers step in before a truly oversold condition emerges.
Gold and Silver Miners Surge along with Gold
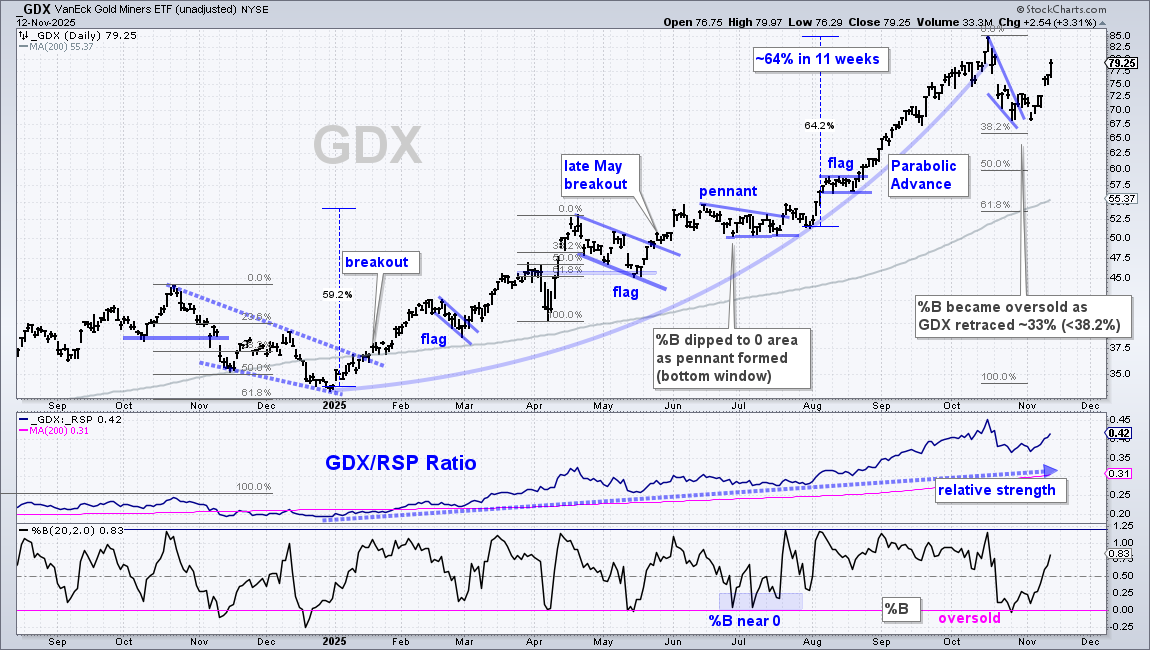
The next chart shows the Gold Miners ETF (GDX) with a similar profile: parabolic advance, sharp pullback, oversold condition, ~33% retracement and November surge. GDX gapped up on Monday and it is important that this gap holds. A close below 72.5 would fill the gap and argue for more corrective price action, possibly a dip to the 50% retracement zone.
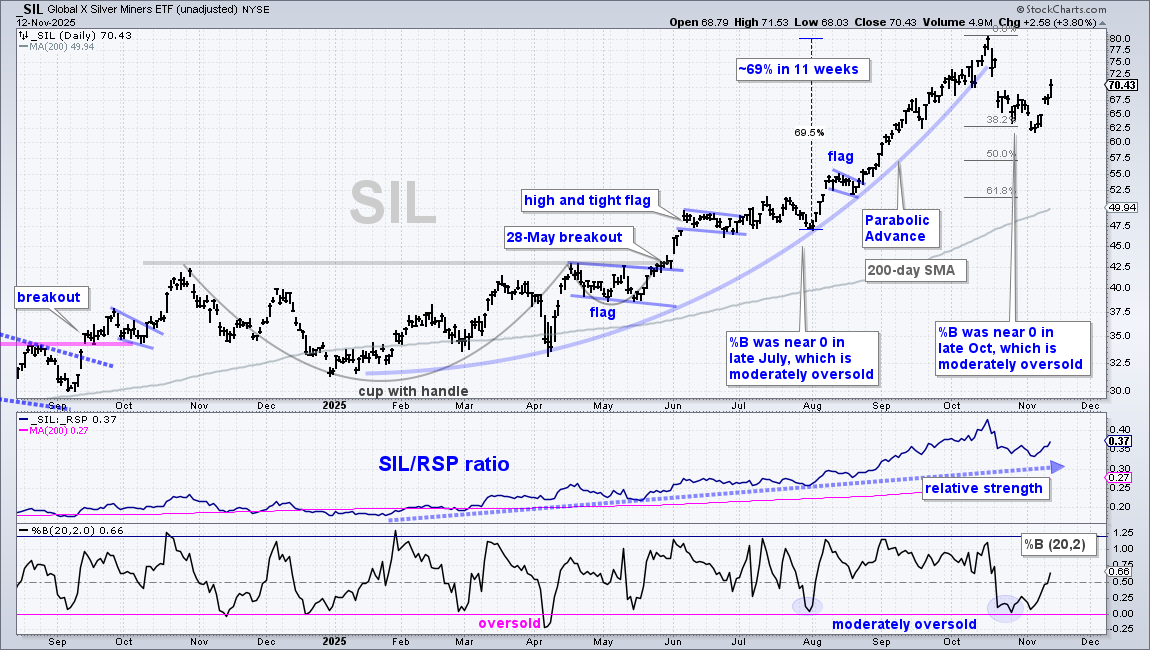
The next chart shows the Silver Miners ETF (SIL) exceeding the 38% retracement line with a deeper pullback. SIL also forged a lower low from late October to early November. Nevertheless, it participated in the November surge with an 8% gain the last 12 days.
Copper Consolidates within Uptrend
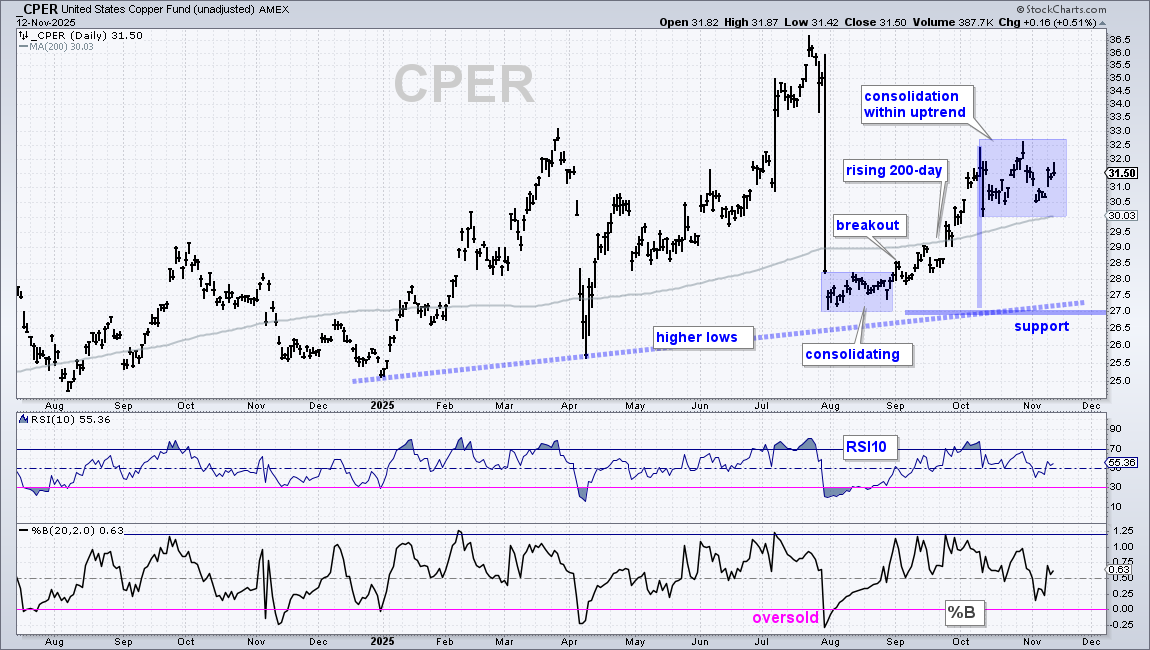
The Copper ETF (CPER) remains in a volatile uptrend with higher lows throughout 2025, higher highs in March and July, and price above the rising 200-day SMA. Volatile moves pushed CPER below its 200-day in April and late July, but higher lows ultimately formed and the uptrend extended. These dips were mean-reversion opportunities (excessive pullbacks). Most recently, CPER surged from late September to early October and then consolidated the last five weeks (blue rectangle). I view this as a bullish continuation pattern, similar to a flag. A breakout would signal a continuation of the uptrend and target a move to new highs. Long-term support remains at 27.
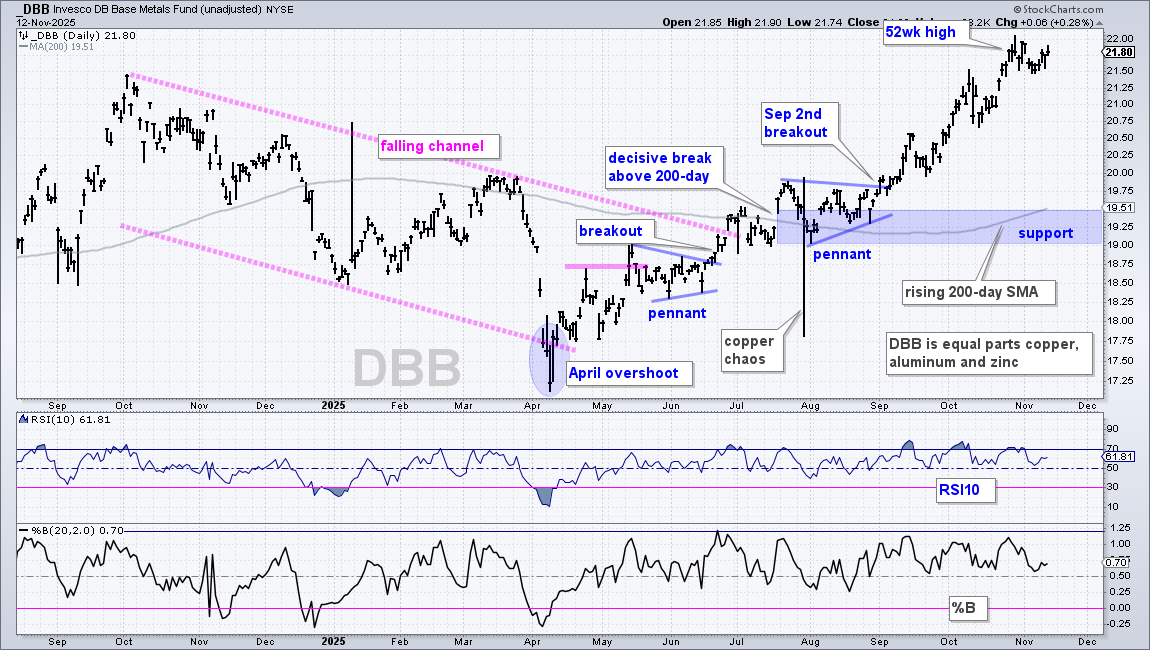
The DB Base Metals ETF (DBB) is stronger than CPER because it hit a 52-week high in late October. Strength in its other two components, zinc and aluminum, pushed DBB to new highs. I do not see a setup on this chart, just a leading uptrend. ETFs with new highs in late October are in leading uptrends. Support remains in the 19-19.25 area for now.
Uranium Forms Bullish Triangle
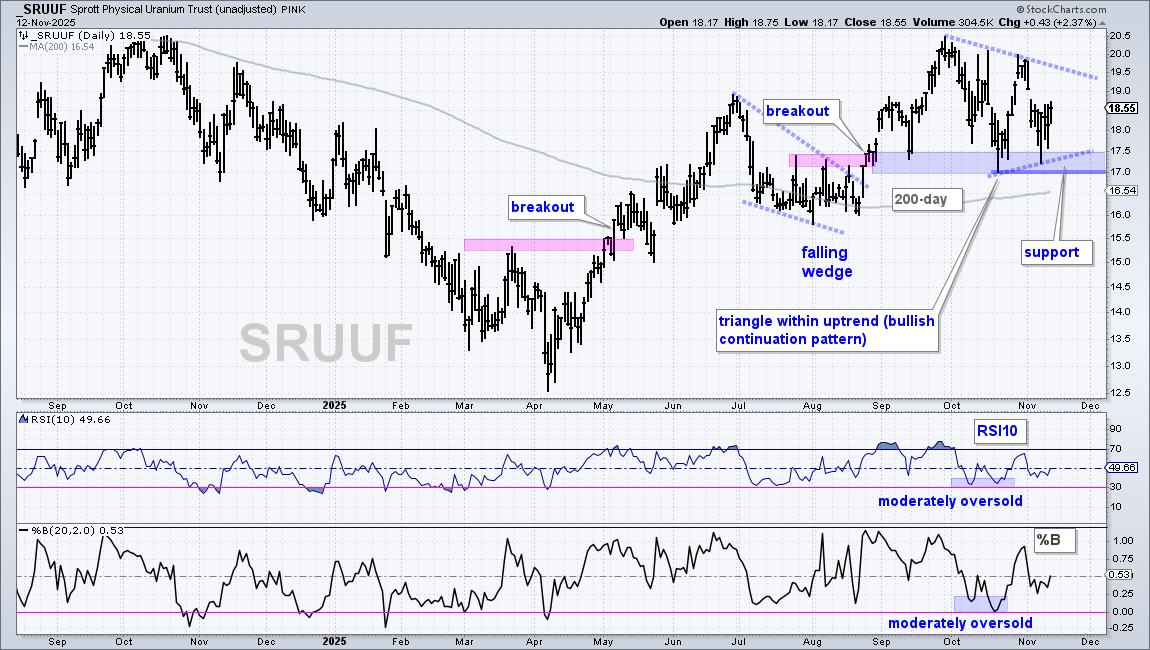
The Sprott Physical Uranium ETF (SRUUF) remains in a long-term uptrend with price above the rising 200-day SMA. After the September surge, the ETF moved into a volatile trading range since October. Broken resistance turned support in the 17-17.5 area and held with bounces in late October and early November. A triangle is now taking shape, and this is a continuation pattern. A breakout at 20 would signal an end to the correction and a resumption of the long-term uptrend. Short-term, SRUUF is attempting to bounce off the support zone this week. This bounce offers a lower risk entry opportunity to anticipate a triangle breakout at 20. A close below 17 would break support and negate the setup.
Bonds Bounce after becoming Oversold
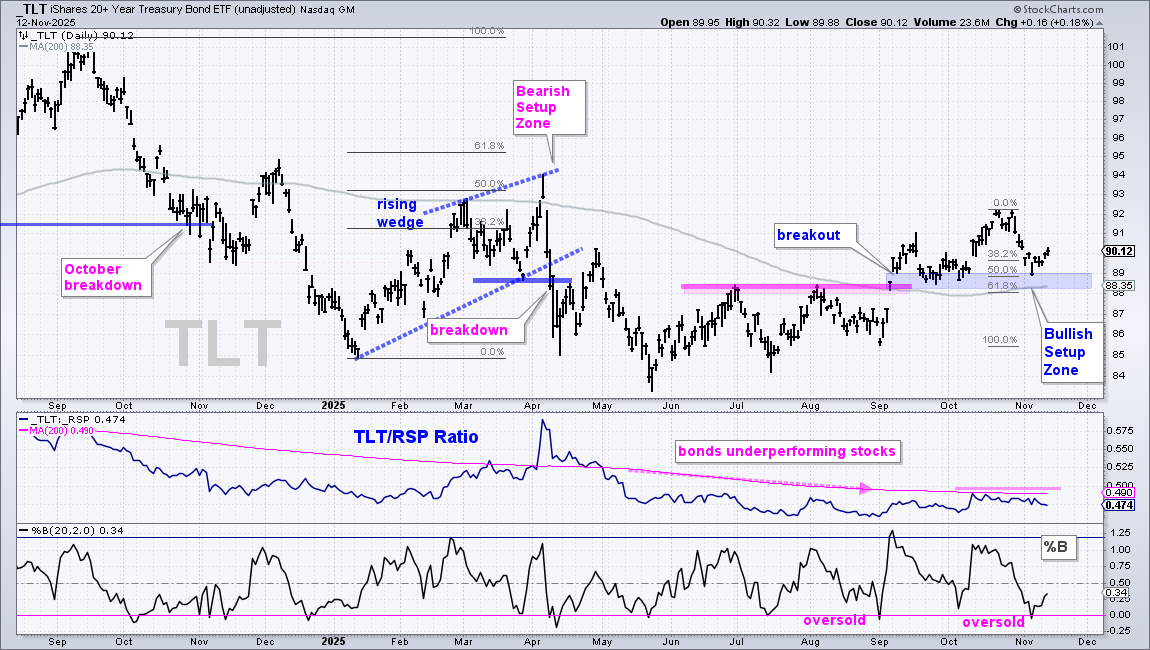
The 7-10Yr TBond ETF (IEF) and 20+Yr TBond ETF (TLT) fell sharply into early November to become oversold within uptrends. While I would not call these leading uptrends, the longer trends are up and oversold conditions present opportunities to trade the trend. TLT reversed its downtrend as it broke resistance and the 200-day SMA in early September. Follow through has been limited, but the ETF held above the breakout zone and 200-day SMA. With the decline into early November, %B became oversold (<0) and TLT retraced around 50% of the September-October advance. Thus, we have a Bullish Setup Zone in the 88-89 area (blue shading). This is an area to watch for firming and a short-term reversal, which we are seeing as TLT bounced the last five days. A close below 88 would call for a re-evaluation.
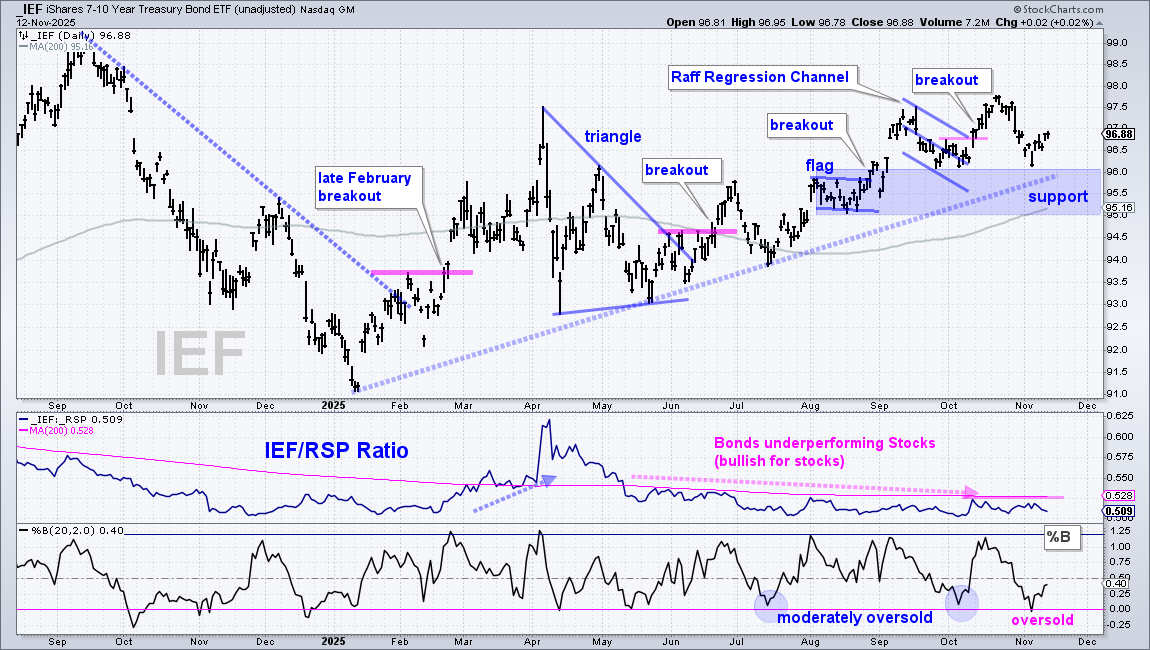
The next chart shows the 7-10Yr TBond ETF (IEF) with an uptrend since the February breakout. IEF hit a new high for 2025 in late October and remains above the rising 200-day SMA. The ETF fell sharply into early November and became oversold with %B dipping below 0. IEF is also trading just above a big support zone marked by the August lows, September lows and rising 200-day SMA. This is a bullish setup and we are seeing IEF bounce the last five days. Long-term support is set at 95, and a close below this level would argue for a re-evaluation.
Bitcoin in Downtrend and Underperforming
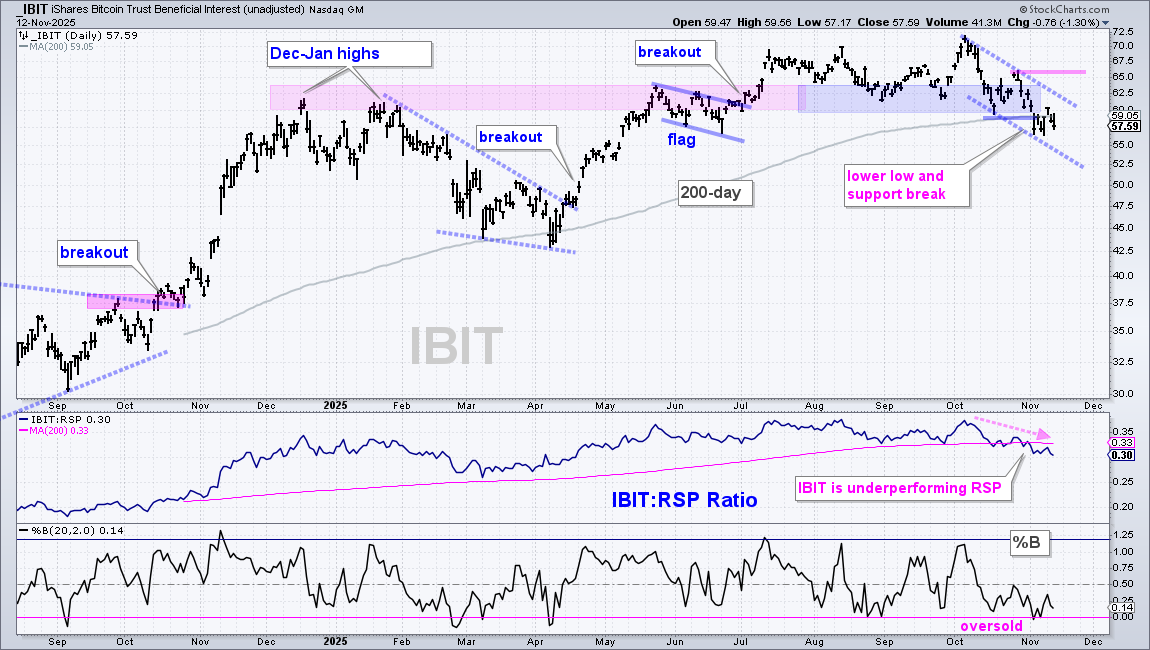
The Bitcoin ETF (IBIT) moved into a long-term downtrend with a break below the summer lows and 200-day SMA on November 4th. IBIT is now trading below its December-January highs and has nothing to show over the last 11 months. If this were a stock, it would not make the relative strength cut. SPY, for comparison, is still over 10% above its February high and 10% above its 200-day SMA. The blue dashed lines mark a falling channel to define the current downtrend with the late October high marking resistance (pink line). In the lower window, the IBIT:RSP ratio fell below the 200-day SMA and hit a multi-month low.
DISCLAIMER: This content provided strictly for informational and educational purposes. It should not be interpreted as an offer to buy or sell any security, nor as a solicitation to engage in any investment activity. Nothing here constitutes a recommendation regarding any specific security, portfolio, transaction, or investment strategy.
At times, the author or affiliates may hold positions or interests in securities discussed. Any stocks or examples mentioned are not endorsements or suggestions to purchase. This material does not consider your individual financial goals or circumstances, and you should seek guidance from a qualified financial or investment adviser before making any trading or investment decisions.
Past performance does not guarantee future results.
Send feedback to support(at)trendinvestorpro.com or use the contact form. [2]