Watching QQQ and MAGS for Clues – 6 Tech Leaders and 6 Laggards – XLU Corrects
Posted By
Arthur Hill, CMT
On
In
Archive |
No Comments
Headlines
Pockets of Weakness Expand
SPY, QQQ, XLK and XLU Hold Up
SPY Outperformance Accelerates
QQQ Has Yet to Signal a Correction
Possible Double Tops for IJH and IJR
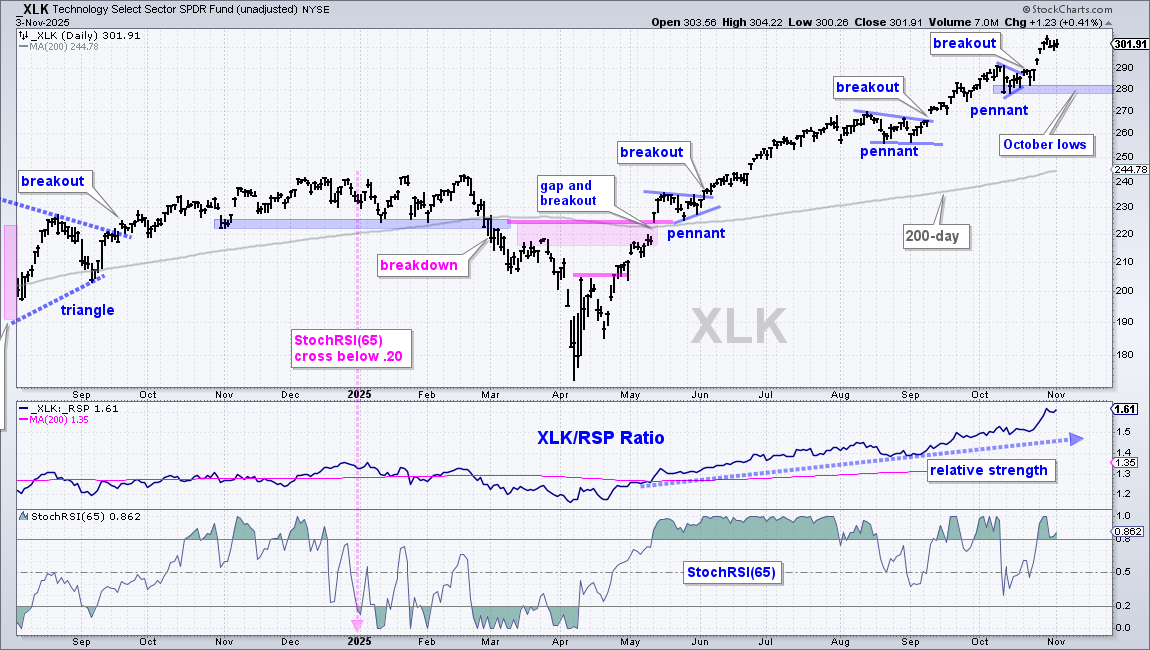
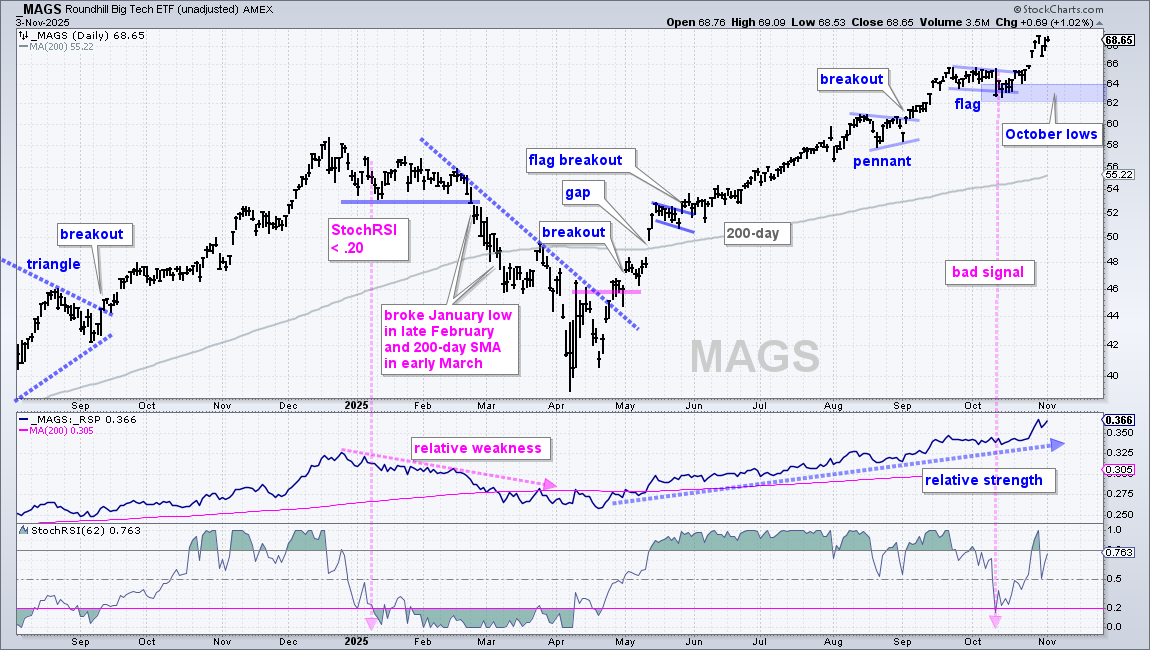
XLK and MAGS Extend on Pennant/Flag Breakouts
Leaders and Laggards with Technology
Utilities SPDR Nears Bullish Setup Zone
Healthcare SPDR Holds Strong
Pockets of Weakness Expand
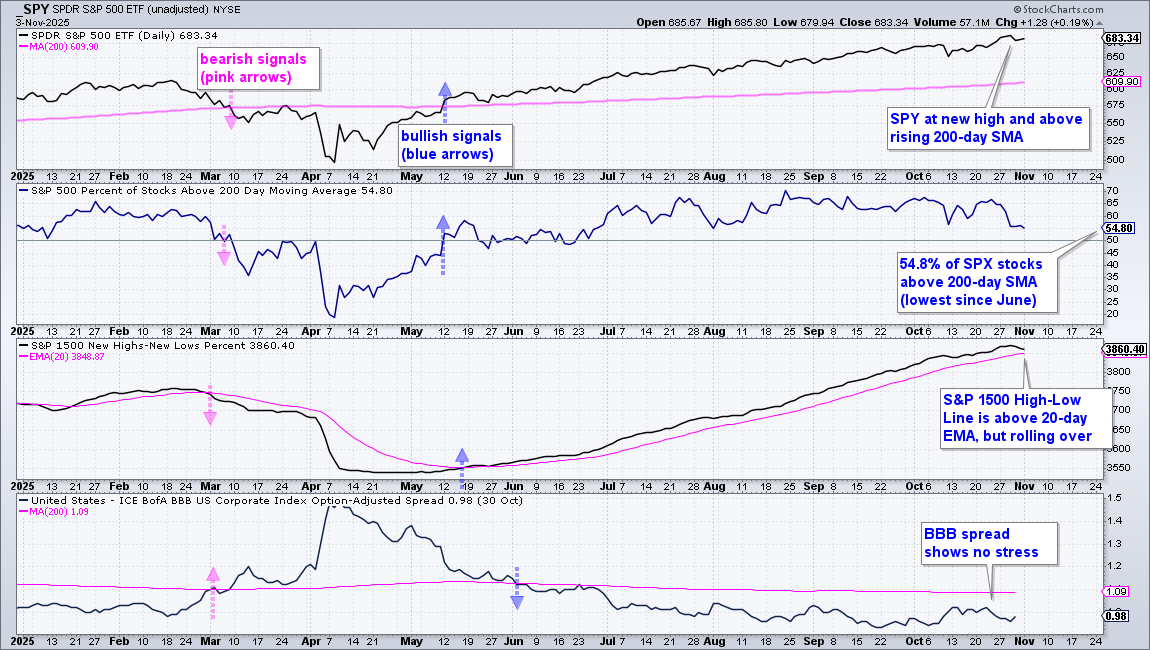
While the weight of the evidence has yet to turn bearish, the market is becoming more split as the pockets of weakness expand. 54.80% of S&P 500 stocks are above their 200-day SMAs, which is the lowest percentage since June. This also means some 45% are in long-term downtrends (below their 200-day SMAs). This is a significant swath of the market. The trouble starts with a move below 50% and bear signal triggers with a move below 40%. Groups with the most stocks in long-term downtrends include regional banks, housing, retail, consumer staples, materials, chemicals and REITs.
In the bottom half of the chart, the BBB yield spread remains at low levels (narrow) and there are no signs of stress in the credit markets. The 3-month Treasury Yield ($UST3M) fell to its lowest level (3.82%) since 2022, which points to a dovish Fed. Even though 35% of S&P 500 stocks are below their 200-day SMAs and there are sizable pockets of weakness within the market, the weight of the evidence is bullish for stocks. There is clearly a bull market somewhere.
SPY, QQQ, XLK and XLU Hold Up
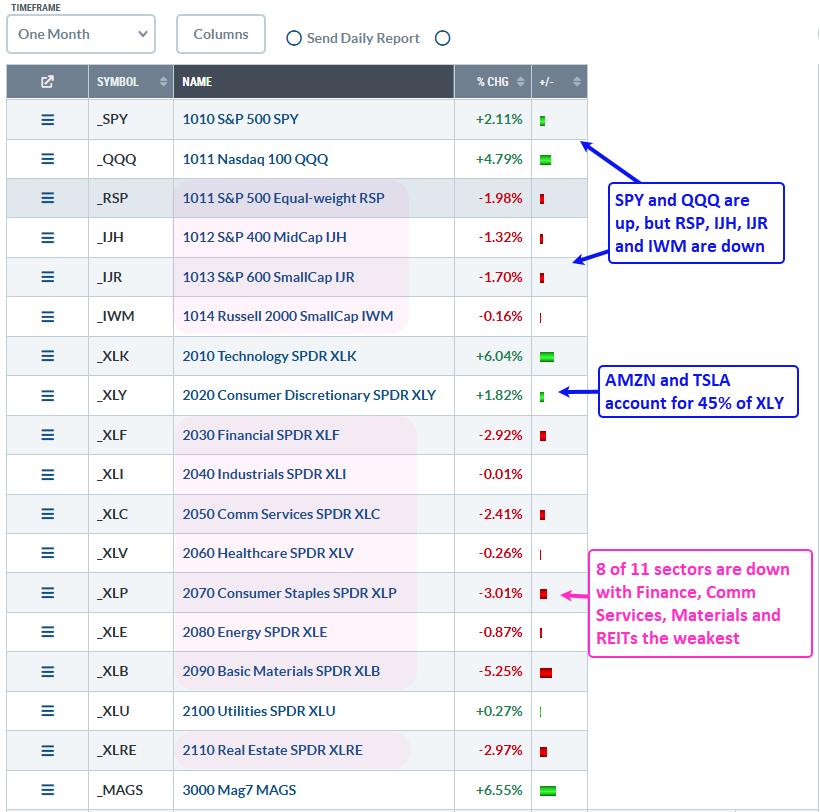
The performance discrepancy between SPY/QQQ and the rest of the market widened over the last few weeks. As we all know, MAG7 stocks are the main drivers for SPY, QQQ, XLK and XLY. The table below shows the percent changes over the last 21 days (one month) for the major index ETFs, 11 sectors and Mag7 ETF (MAGS). SPY and QQQ are up, but small-caps, mid-caps and equal-weights are down. Eight of the eleven sectors are down. XLY is up because AMZN and TSLA account for 45% of the ETF. Tech and Utilities are strong as sectors. Elsewhere, I am seeing relative strength (less weakness) in Healthcare (Biotech, Pharma) and Industrials (Clean Energy, Defense).
SPY Outperformance Accelerates
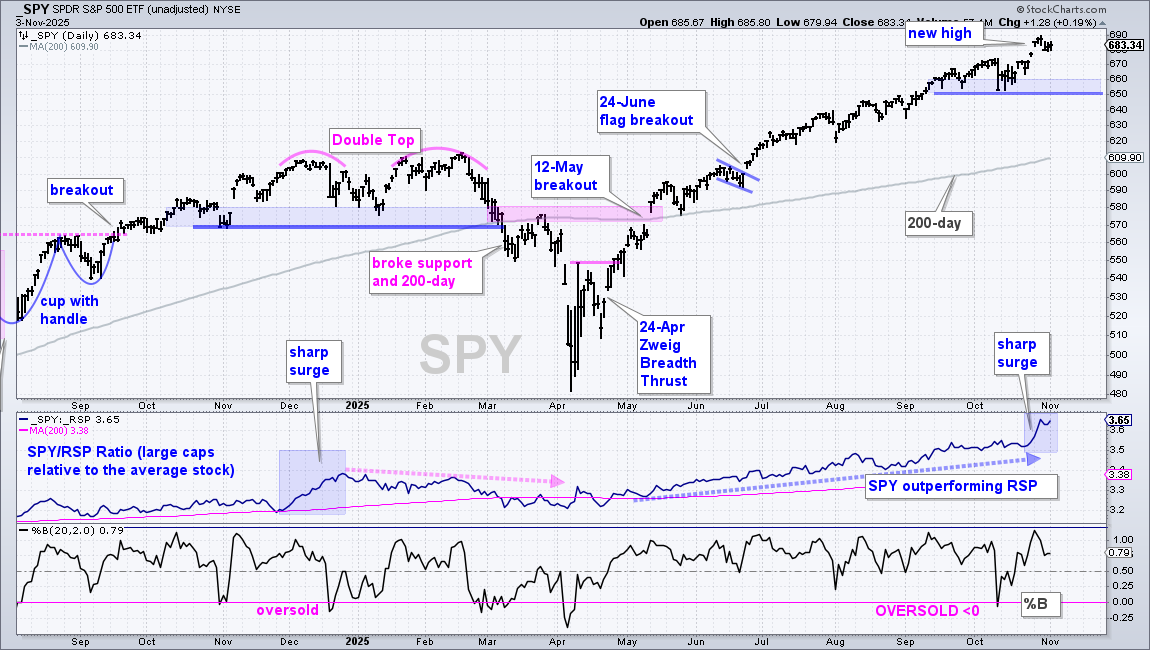
SPY remains in a confirmed uptrend with a new high in late October and price well above the rising 200-day SMA. The lows from mid September and October mark first support in the 650-660 area. The middle window shows the price-relative (SPY/RSP ratio) surging in late October (blue shading). This shows an acceleration in relative strength, relative to the S&P 500 EW ETF (RSP). An acceleration higher after an extended up move signals froth/excess that can lead to a correction. Gold did this in April and October. The performance gap between SPY and RSP is growing, much like it did in December 2024. There was also a sharp surge in December 2024 and this foreshadowed a trading range into December and breakdown in March.
QQQ Has Yet to Signal a Correction
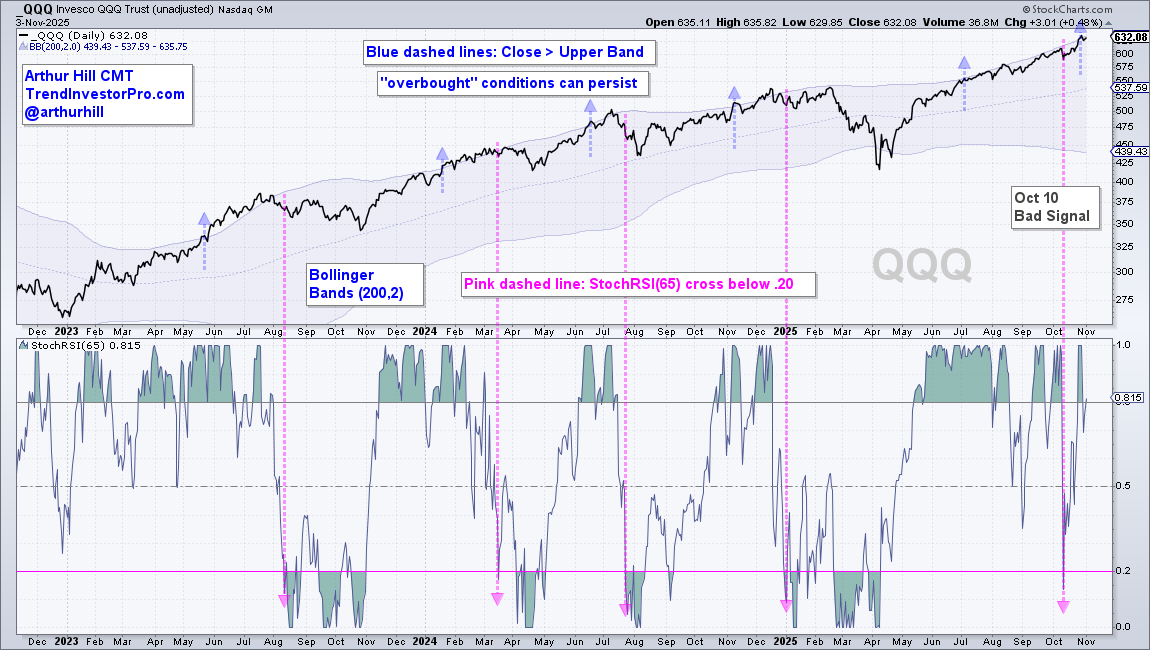
This next chart was posted on Friday. It shows QQQ with Bollinger Bands (200,2) and StochRSI(65). QQQ becomes overbought with a move above the upper Bollinger Band, which means it is 2 standard deviations above the 200-day SMA. The blue arrows show when QQQ initially crossed the upper band. ETFs, especially QQQ, can become overbought and remain overbought as trends extend.
Overbought argues for caution, but we need a momentum indicator to signal an actual downturn. I am using StochRSI(65) with the 65-period Stochastic Oscillator applied to RSI(65). This is the momentum of momentum. I chose 65 days because this is around three months and signals are infrequent. 20 days is too short and produces too many whipsaws. A downturn signals with a cross below .20 (pink arrows).
There was a signal in mid October, but this resulted in a whipsaw as QQQ rebounded to new highs. I remain on guard with QQQ overbought again. A StochRSI(65) move below .20 would signal a downturn and argue for a correction within the uptrend.
Possible Double Tops for IJH and IJR
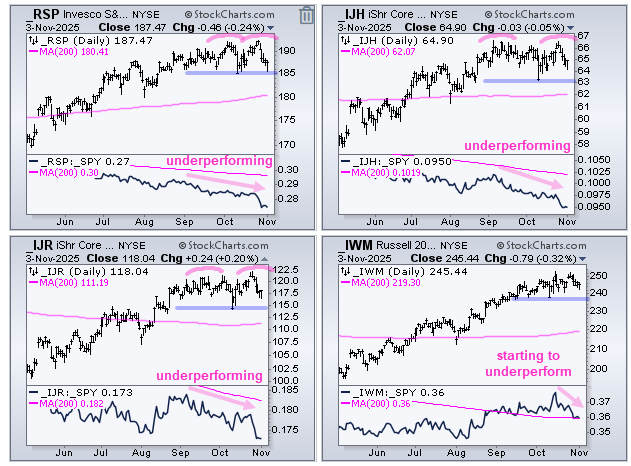
Relative performance is very important when trading stocks and stock-based ETFs. We want to focus on the leaders and avoid the laggards. The average S&P 500 stock, mid-caps and small-caps have been underperforming for some time now. This was not a big problem from May to August because the S&P 500 EW ETF (RSP), S&P MidCap 400 ETF (IJH) and S&P SmallCap 600 SPDR (IJR) advanced. The Russell 2000 ETF (IWM) stayed strong into mid October.
The CandleGlance chart below shows RSP, IJH and IJR stalling since September with possible Double Tops forming (pink arcs). These bearish reversal patterns are confirmed with a break below the intermittent low (blue lines). Basically, the lows from mid September to October hold the key. A break below these lows would reverse the uptrends. Such breaks would also likely lead to an expansion of downtrends and new lows within the indexes.
XLK and MAGS Extend on Pennant/Flag Breakouts
XLK, QQQ and the Mag7 ETF (MAGS) and the tech-related ETFs are positively correlated, which means they move in the same direction. A pullback or correction in XLK means most, if not all, tech-related ETFs will pull back or correct.
It is very difficult to time a pullback within a strong uptrend. With growing pockets of weakness in the broader market, this is perhaps a good time to consider lightening up on positions. At the very least, now is the time to plan your trade and trade according to that plan.
There is a pecking order for signals. First, we have overbought conditions, which can remain as trends extend. Second, we have bearish momentum signals (StochRSI(65)<.20) or a short-term support break (October low). Then we have long-term trend signals (Trend Composite turns negative) and/or the market regime turns bearish (bear market)..
Now is the time to choose an exit strategy. I have yet to get correction signals from SPY, QQQ, XLK or MAGS. These three remain in long-term uptrends and the market regime remains bullish.
Leaders and Laggards within Technology
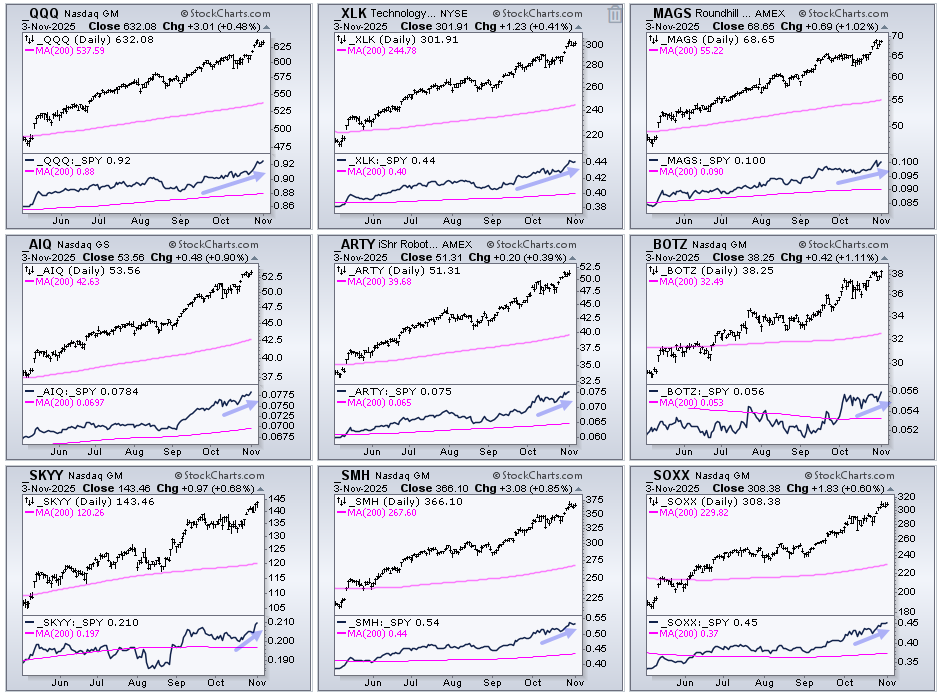
Here is a list of tech-related ETFs with flag or pennant breakouts and new highs in late October: XLK, MAGS, AIQ, ARTY, BOTZ, SKYY, SMH, SOXX. These ETFs are outperforming SPY and performing in line with QQQ, XLK and MAGS. The indicator windows show performance relative to SPY and these price-relatives hit new highs in late October (blue arrows).
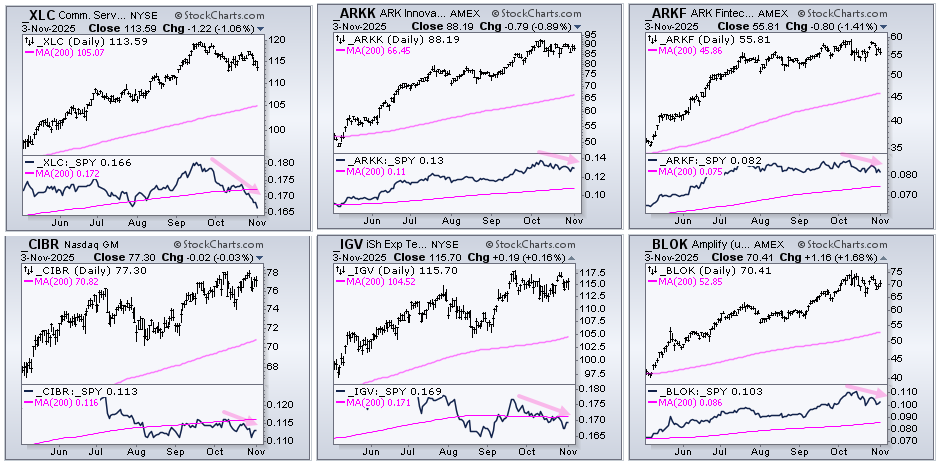
XLC, ARKK, ARKF, CIBR, IGV and BLOK are lagging because they did not hit new highs in late October. These ETFs may be more vulnerable because they are lagging the last four weeks. Their price-relative turned down in October (pink arrows).
Utilities SPDR Nears Bullish Setup Zone
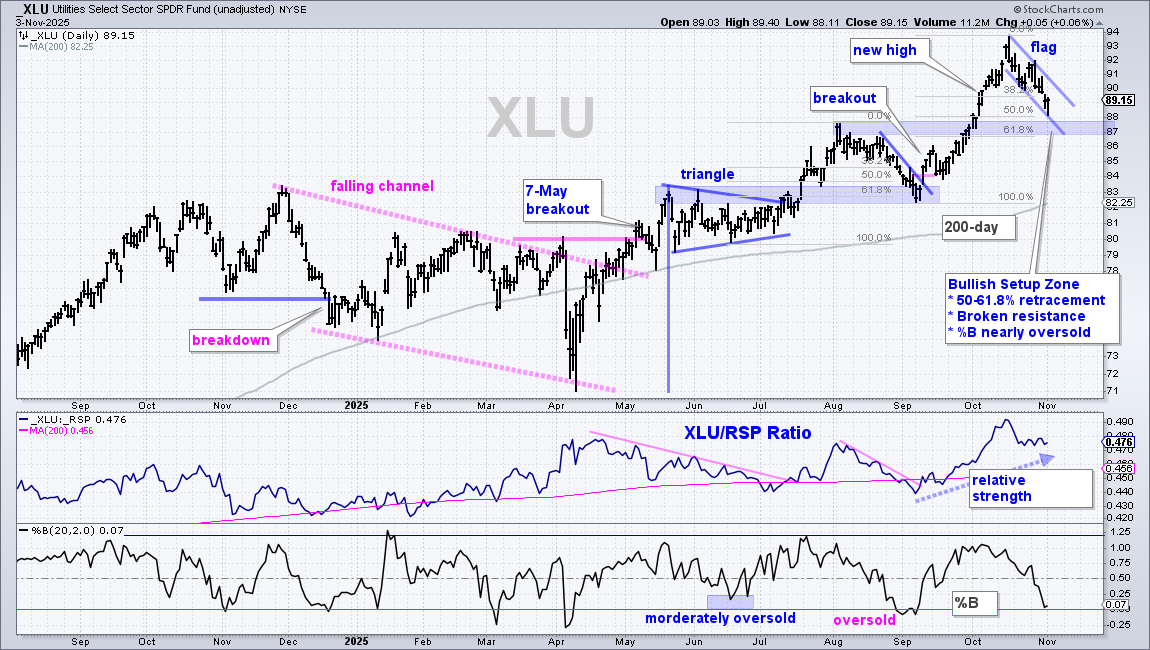
The Utilities SPDR (XLU) is in a long-term uptrend with price above the rising 200-day SMA and a new high in mid October. This means pullbacks present opportunities to trade within the uptrend. However, we never know how far a pullback will extend or how long it might last. I use Bullish Setup Zones and oversold conditions to mark possible areas that may offer support and lead to a reversal. XLU is near such a zone (blue shading). First, a 50-61.8% retracement would extend to the 87-88 area. Second, broken resistance turns support in this area. Third, %B is nearly oversold and would become oversold with a move below zero. And finally, a falling flag is taking shape. XLU remains just above this zone so I will give it a little more time and watch price action unfold.
Healthcare SPDR Holds Strong
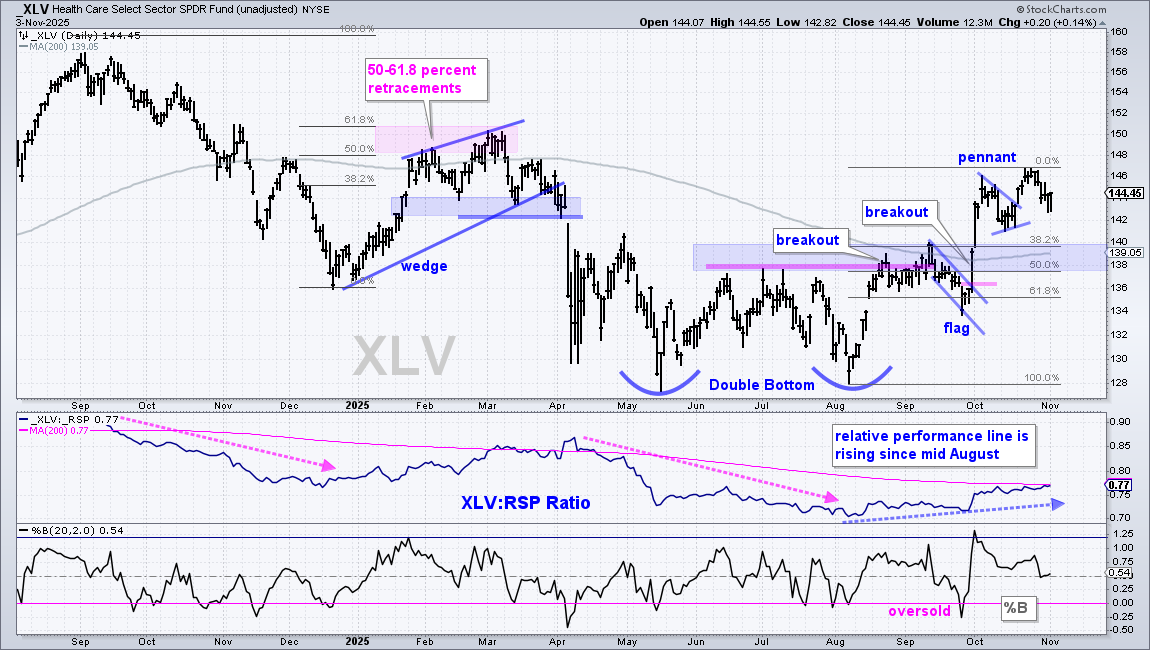
I remain bullish on the Healthcare SPDR (XLV) as it holds the Double Bottom breakout and starts to outperform. The blue shading marks a potential Bullish Setup Zone in the 138-140 area. Here we have broken resistance turning support and the 38-50% retracements. XLV might not return to this zone because it has a pennant breakout working. The lower window shows the price-relative (XLV/RSP ratio) rising since August as XLV starts outperforming.
DISCLAIMER: This content provided strictly for informational and educational purposes. It should not be interpreted as an offer to buy or sell any security, nor as a solicitation to engage in any investment activity. Nothing here constitutes a recommendation regarding any specific security, portfolio, transaction, or investment strategy.
At times, the author or affiliates may hold positions or interests in securities discussed. Any stocks or examples mentioned are not endorsements or suggestions to purchase. This material does not consider your individual financial goals or circumstances, and you should seek guidance from a qualified financial or investment adviser before making any trading or investment decisions.
Past performance does not guarantee future results.
Send feedback to support(at)trendinvestorpro.com or use the contact form. [1]