Staying the Course – SPY/QQQ Hit New Highs – Tech/AI ETFs Lead – Flag/Pennant Breakouts
Posted By
Arthur Hill, CMT
On
In
Archive |
No Comments
Headlines
Staying the Course
Bull Market Somewhere
SPY and QQQ Lead as IWM Tries to Keep Up
Leading Sectors: XLK, XLC, XLU, XLI, XLV
Awash with Flag/Pennant Breakouts in Tech ETFs
Defense and Infrastructure Extend Higher
Six Other ETFs with Leading Uptrends
The weight of the evidence remains bullish with the same groups leading the way higher. SPY and QQQ hit new highs to affirm the dominance of large-caps and large-cap techs. Tech, industrials and utilities are the strongest sectors with new highs this month. Within technology, the AI-related ETFs are leading the charge with short-term breakouts last week. More often than not, leaders remain leaders and it is important to stay with the leaders until the evidence changes. Sometimes there is nothing to do except stay the course and monitor price action. Today’s report will update the leading uptrends and recent short-term signals.
A Bull Market Somewhere
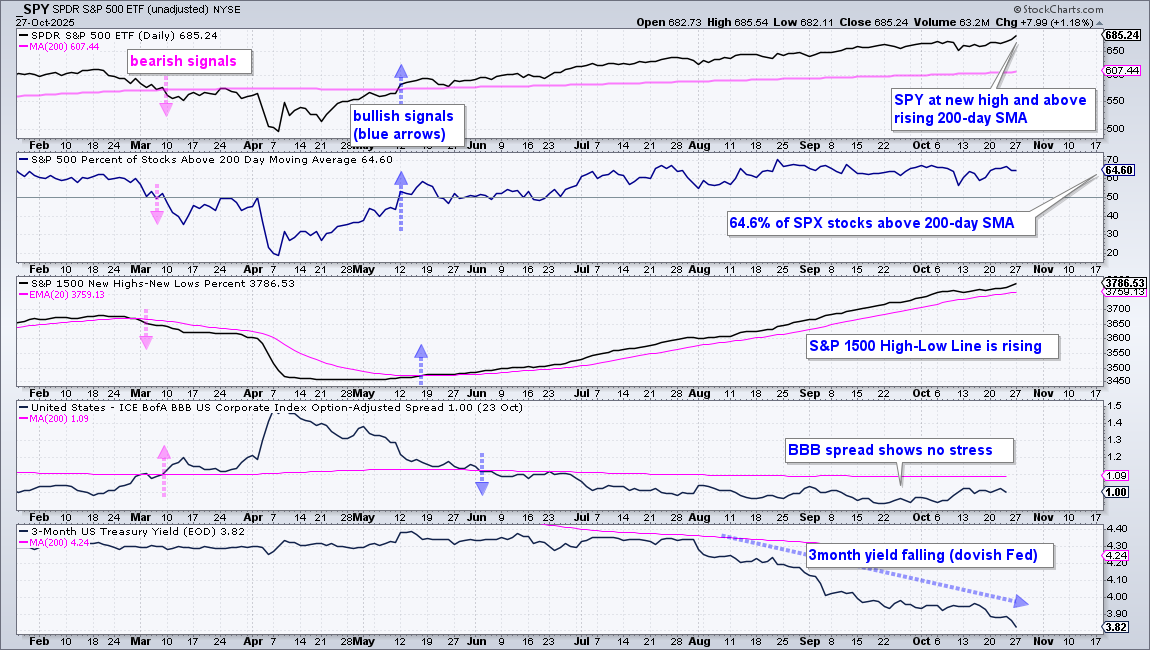
The weight of the evidence is clearly bullish for stocks. SPY and QQQ hit new highs in late October and remain in leading uptrends. Some 65% of S&P 500 stocks are above their 200-day SMA, which means the vast majority of S&P 500 stocks are in long-term uptrends. The middle window shows the S&P 1500 High-Low Line rising as it holds above its 20-day EMA. This means new highs are outpacing new lows.
In the bottom half of the chart, the BBB yield spread remains at low levels (narrow) and there are no signs of stress in the credit markets. The 3-month Treasury Yield ($UST3M) fell to its lowest level (3.82%) since 2022, which points to a dovish Fed. Even though 35% of S&P 500 stocks are below their 200-day SMAs and there are sizable pockets of weakness within the market, the weight of the evidence is bullish for stocks. There is clearly a bull market somewhere.
SPY and QQQ Lead as IWM Tries to Keep Up
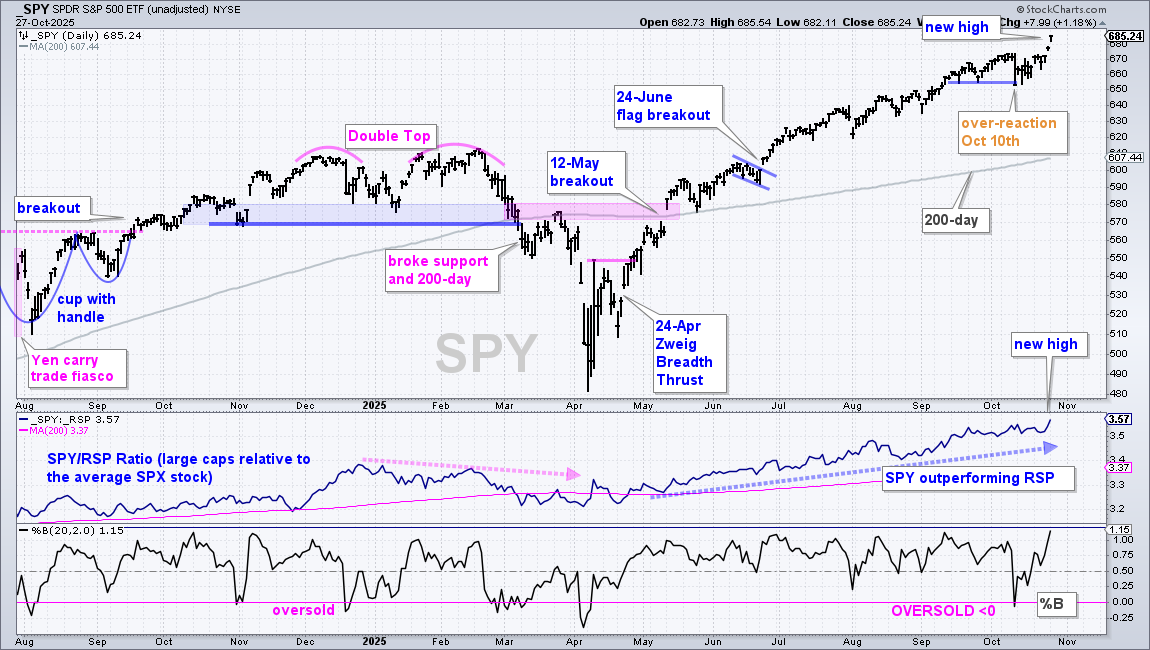
The S&P 500 SPDR (SPY) remains in a leading uptrend with a new high in price and the price-relative (SPY/RSP ratio). With a 1.2% gain on Monday, SPY is now up 5% in the last 11 days (since the October 10th low).
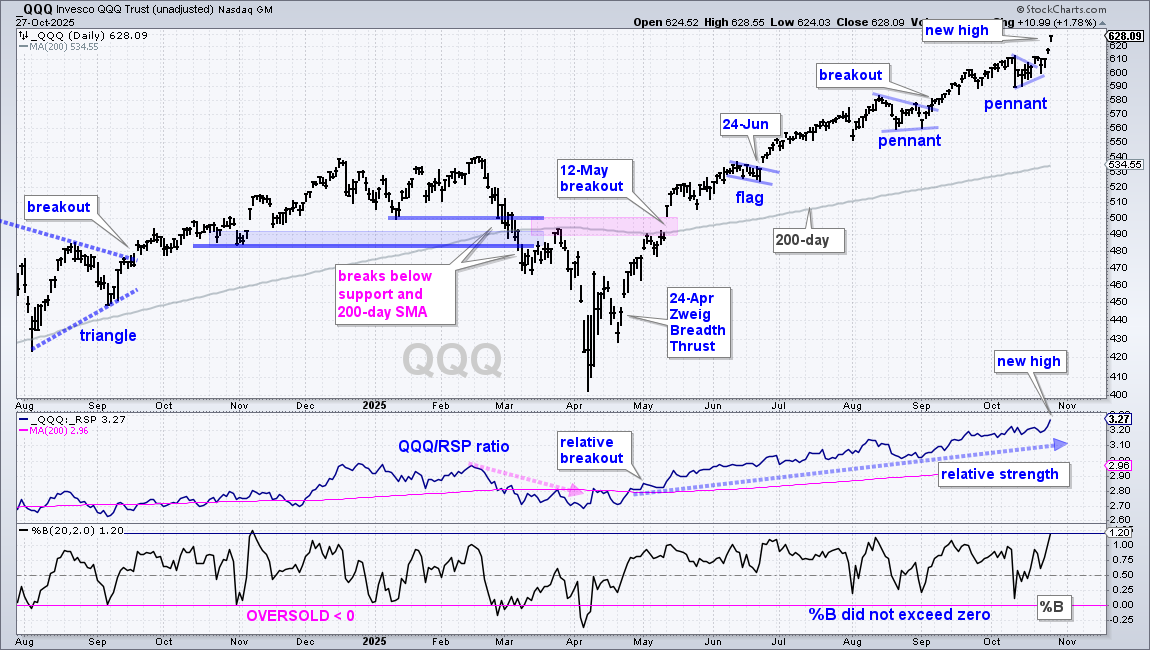
QQQ surged the last two days and hit new highs on Friday and Monday. The QQQ/RSP ratio also hit new highs, which means QQQ is leading the broader market. QQQ has been in a strong uptrend since the mid May breakout. During strong uptrends, chartists must rely on short-term bullish setups or oversold conditions to find trading setups within the uptrend. QQQ formed a flag in June, a pennant in August and a small pennant in mid October. The ETF broke the pennant line on October 20th, stalled for a few days and then raced to a new high. There is no setup on this chart now, just a strong uptrend.
The next chart shows QQQ falling 3.5% on October 10th, but holding above support at 580 and not becoming oversold (%B>0). QQQ held up better than SPY. QQQ remains in a leading uptrend with support marked at 580. In fact, the ETF formed four inside days last week and a small pennant from Friday to Friday (October 10 to 17). The ETF broke the pennant line with a 1.26% surge on Monday and forged a new closing high. Pennants are short-term continuation patterns that take their bias from the prior move, which was up. Thus, the breakout signals a continuation higher. The middle window shows the price-relative in a strong uptrend, which means QQQ is leading.
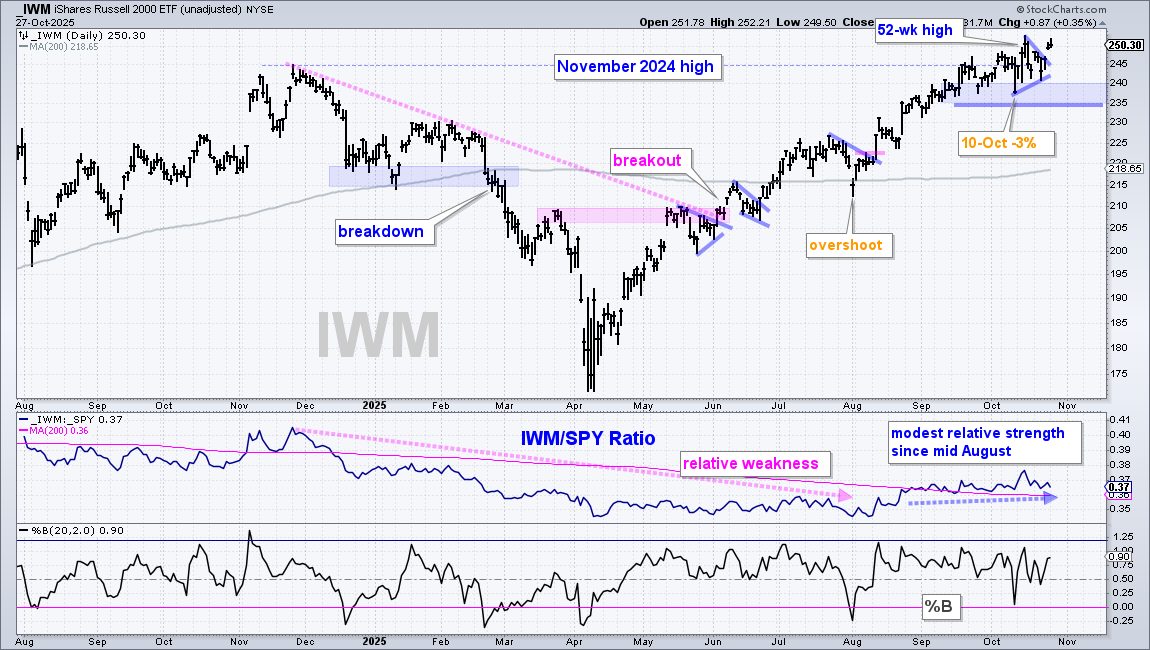
The Russell 2000 ETF (IWM) did not hit a new high on Monday, but remains in an uptrend and shows modest relative strength since August. Overall, IWM is a distant third to SPY and QQQ. The lows from mid September to October mark support in the 235-240 area. A break below 235 would reverse this upswing. The lower window shows the price-relative moving higher in August and then sideways since September. IWM is barely outperforming RSP. Again, SPY and QQQ are the place to be.
Leading Sectors: XLK, XLC, XLU, XLI, XLV
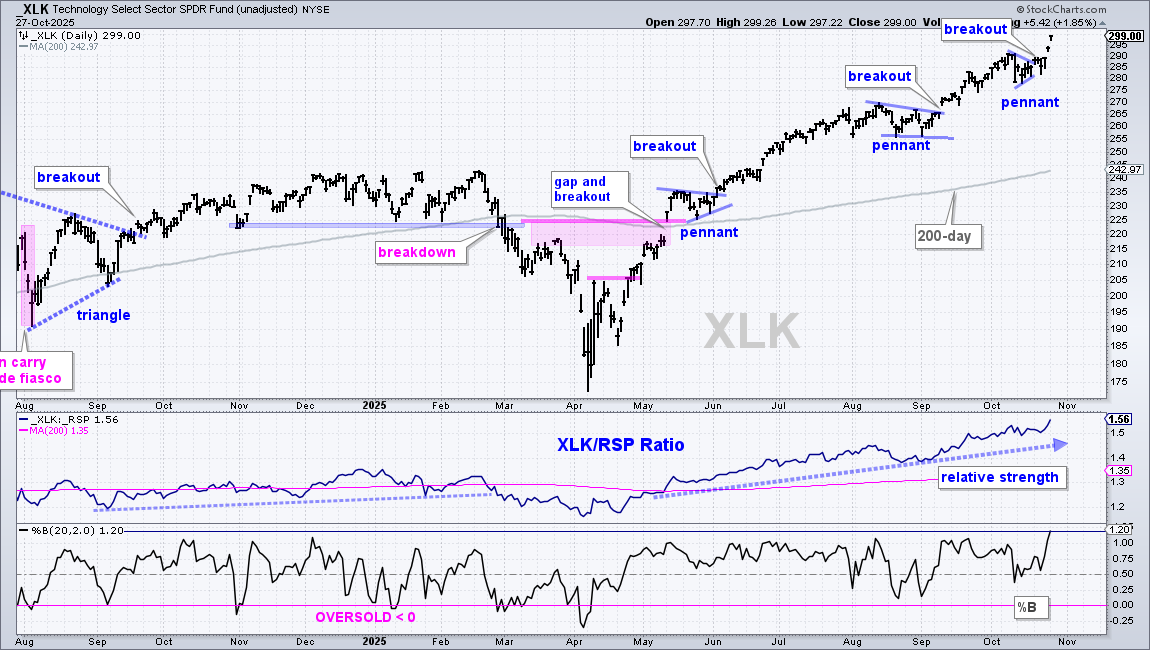
The Technology SPDR (XLK) is the strongest of the eleven sectors. The chart below shows XLK breaking a pennant line on October 20th and hitting new highs on Friday and Monday. XLK continues to outperform the broader market with the price-relative hitting new highs in late October.
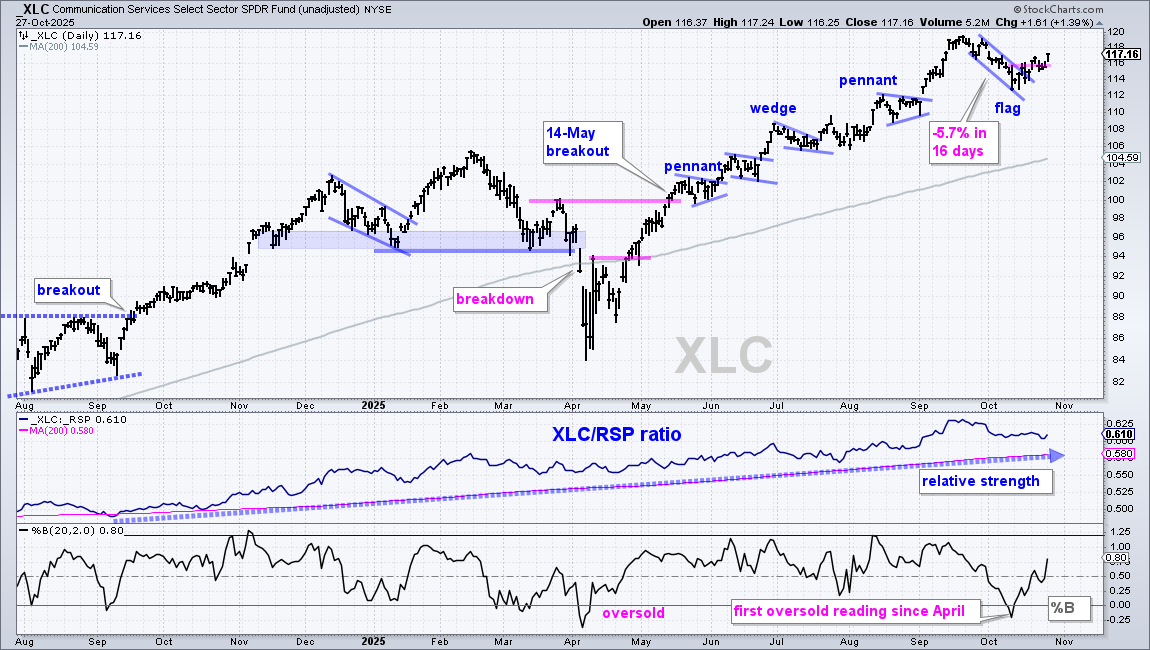
The next chart shows the Communication Services SPDR (XLC) with a falling flag and oversold condition in early October (%B<0). Falling flags are short-term bullish continuation patterns that mark a correction after an advance. XLC broke out with a surge last week and this signals a continuation of the uptrend.
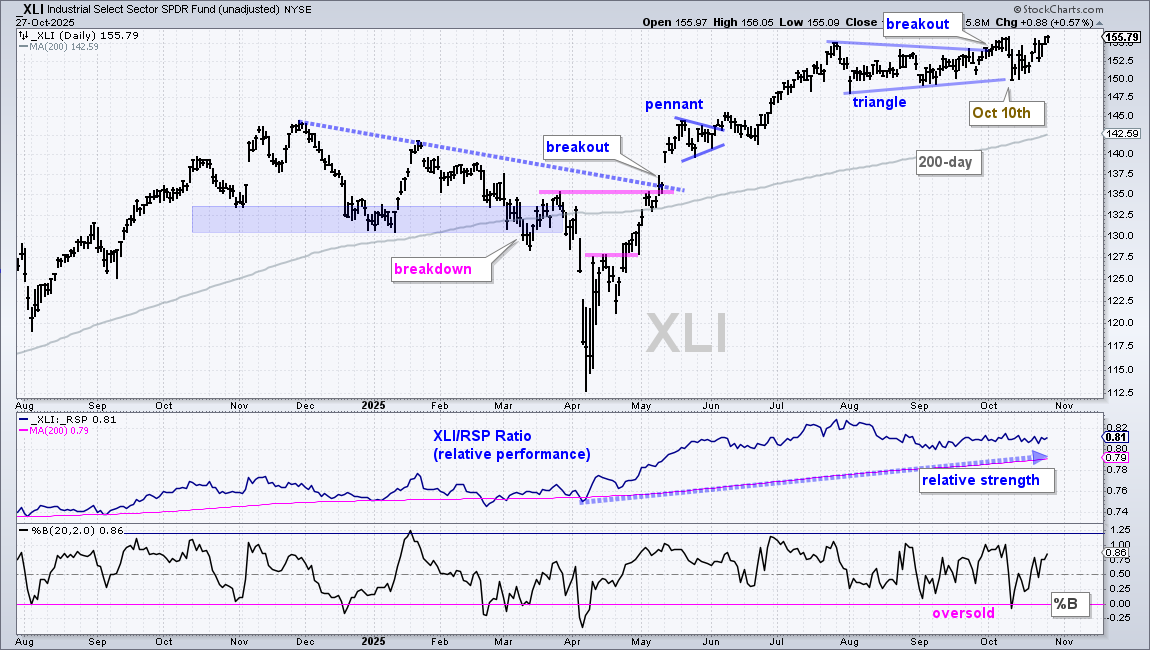
The next chart shows the Industrials SPDR (XLI) with a triangle forming from late July to late September. This is a consolidation within an uptrend, which makes it a bullish continuation pattern. XLI fell back after the breakout with a sharp decline on October 10th, but rebounded and hit a new high on Monday.
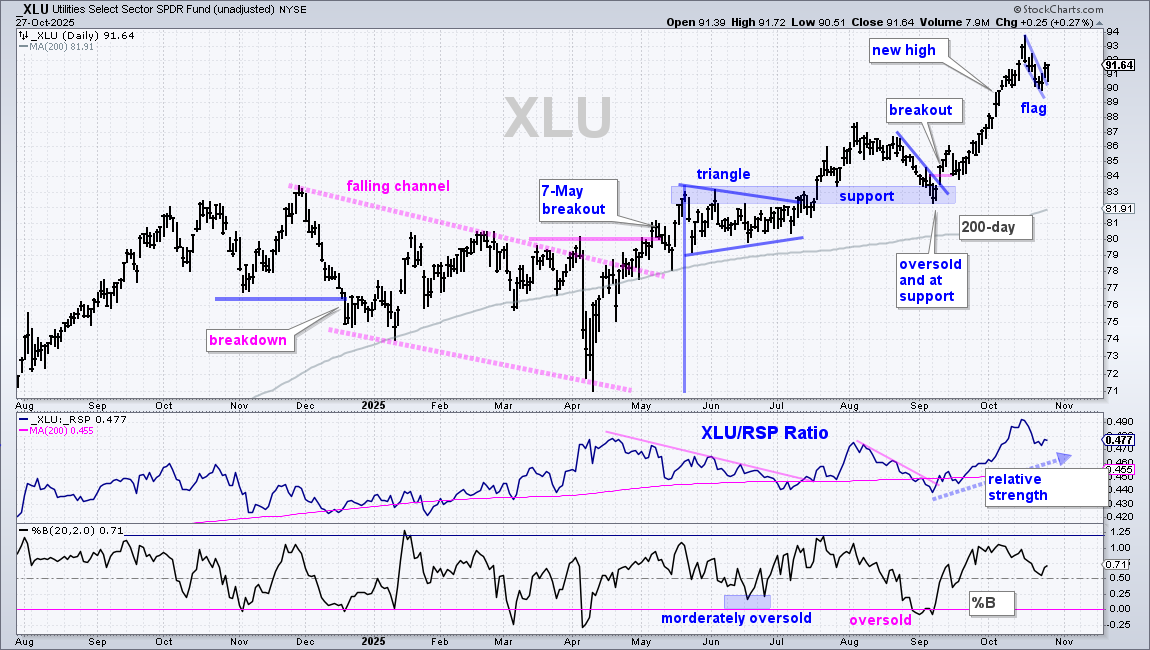
The next chart shows the Utilities SPDR (XLU) breaking out in mid September and racing to new highs. XLU fell back with a short flag last week and then broke the flag line on Friday. This is a very short-term pattern within a leading uptrend.
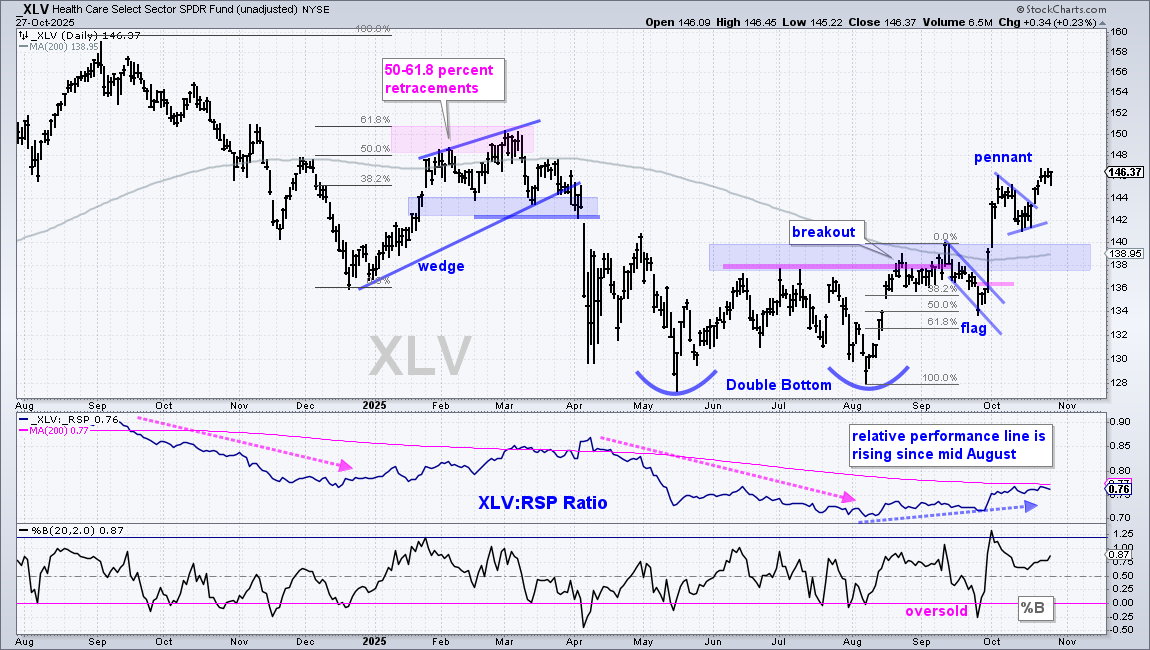
The Healthcare SPDR (XLV) is a relative newcomer to the leadership group. XLV reversed its downtrend with a double bottom breakout in late August and a follow through surge above 144. A pennant consolidation formed into mid October and the ETF broke out last week. Pennants are short-term continuation patterns and this breakout signals a continuation of the prior surge (134-144).
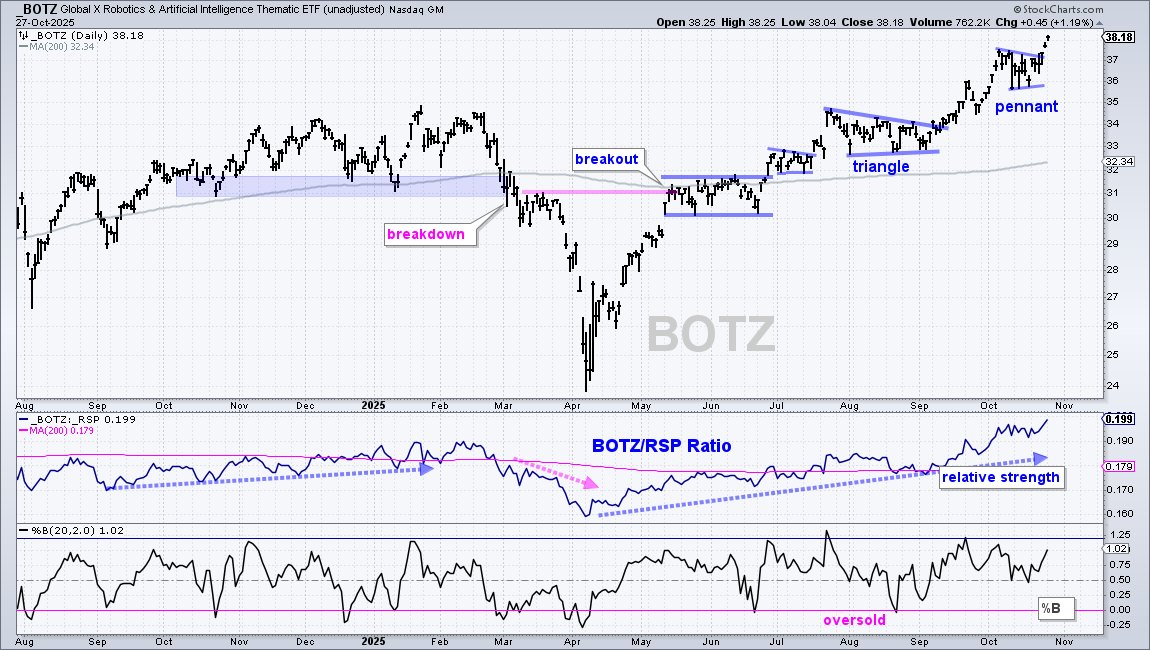
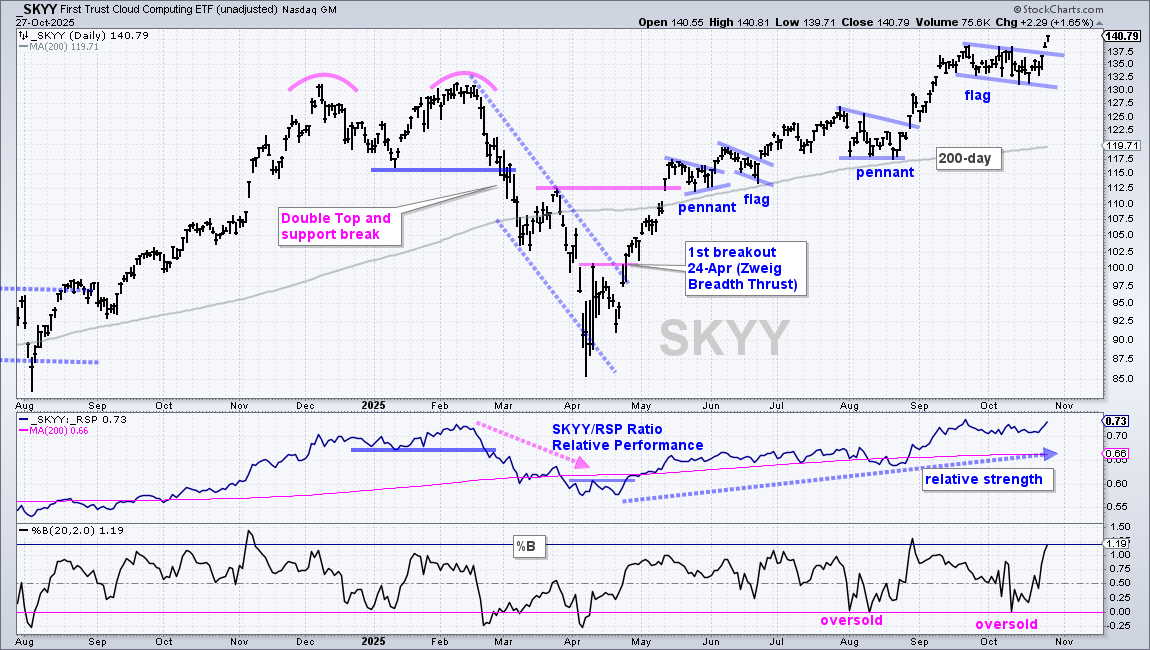
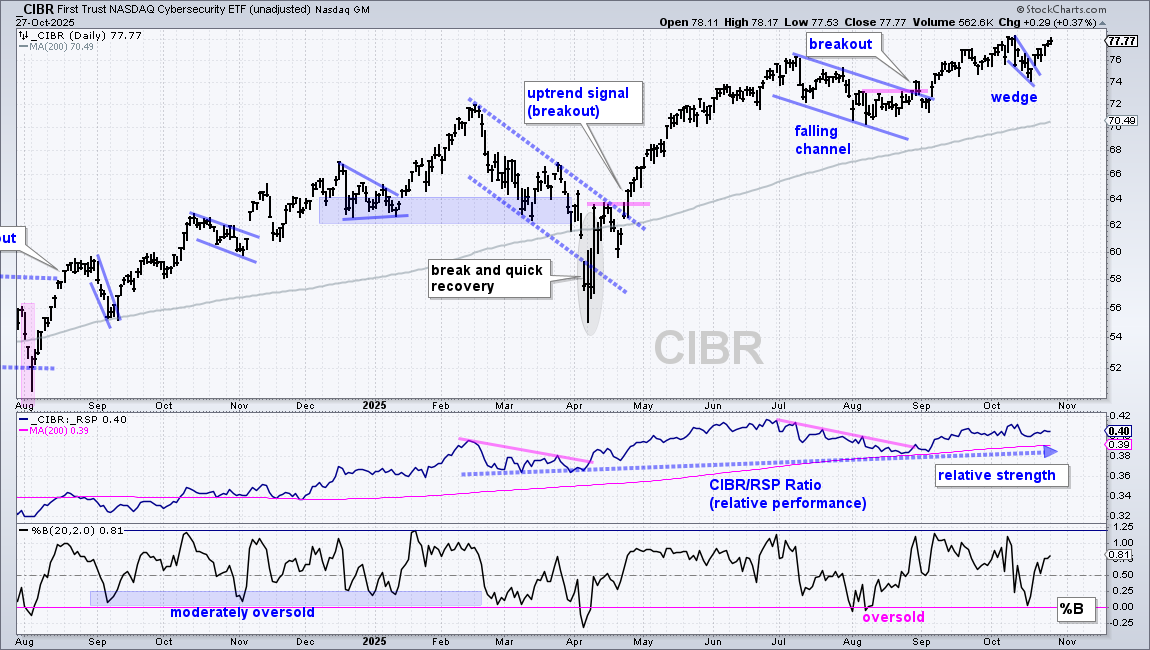
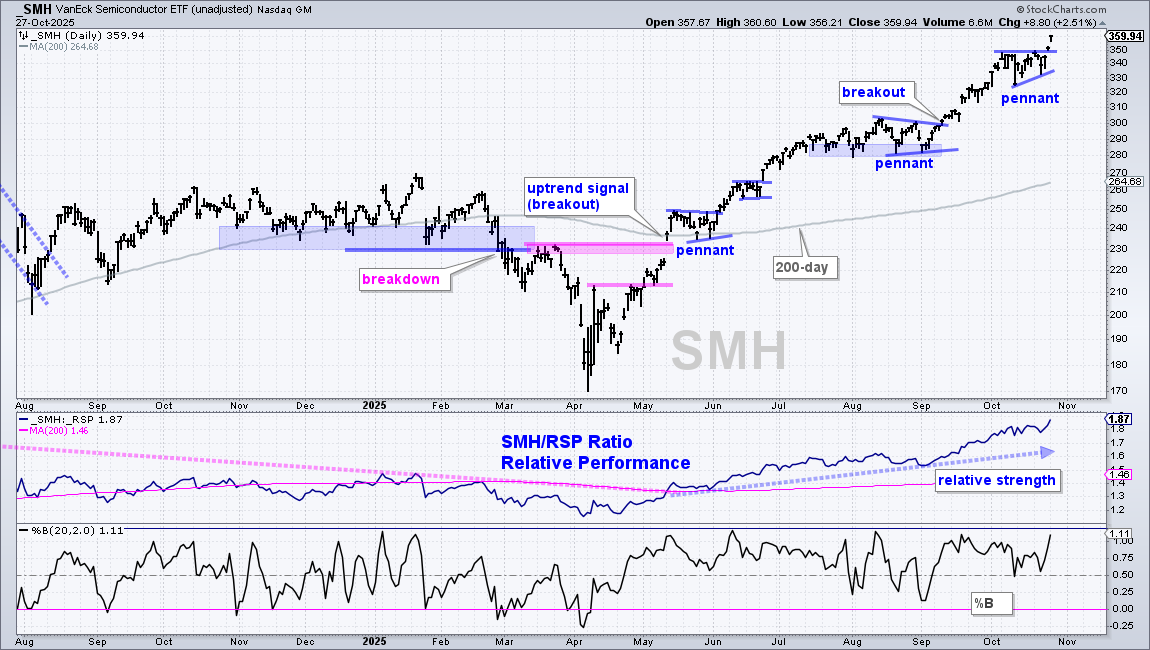
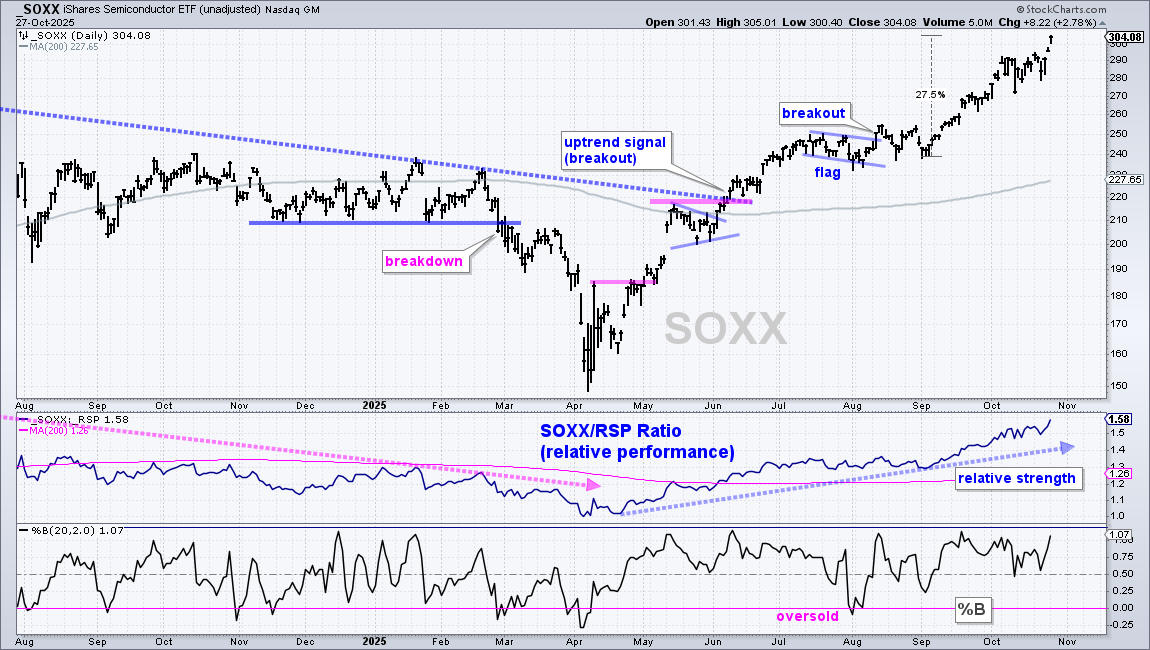
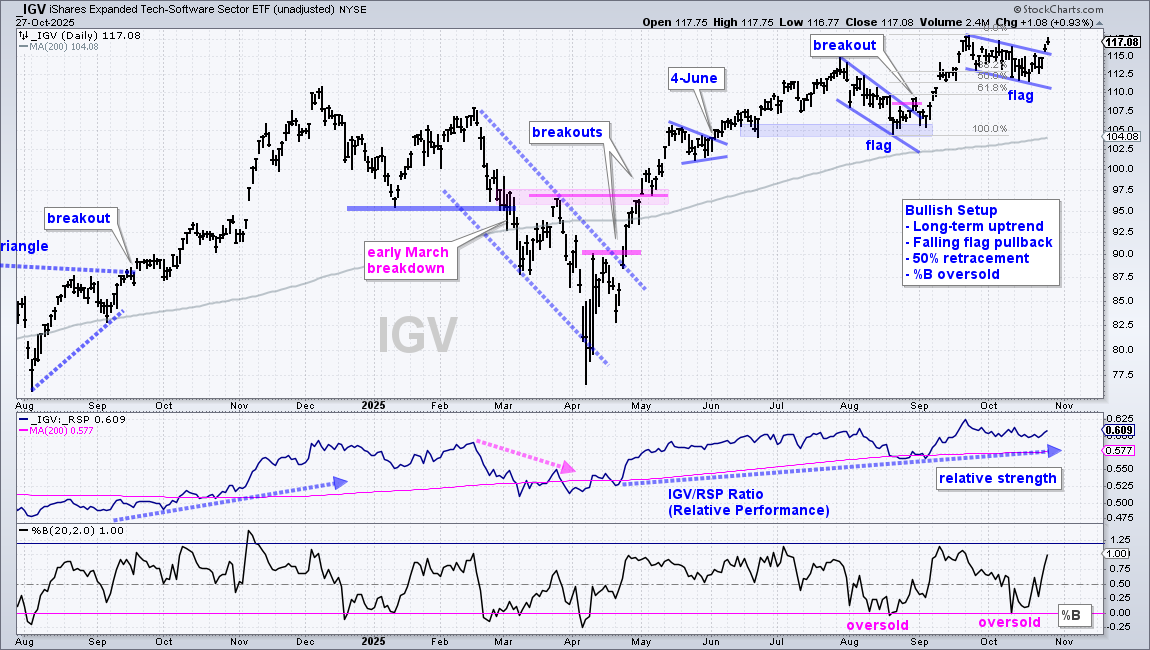
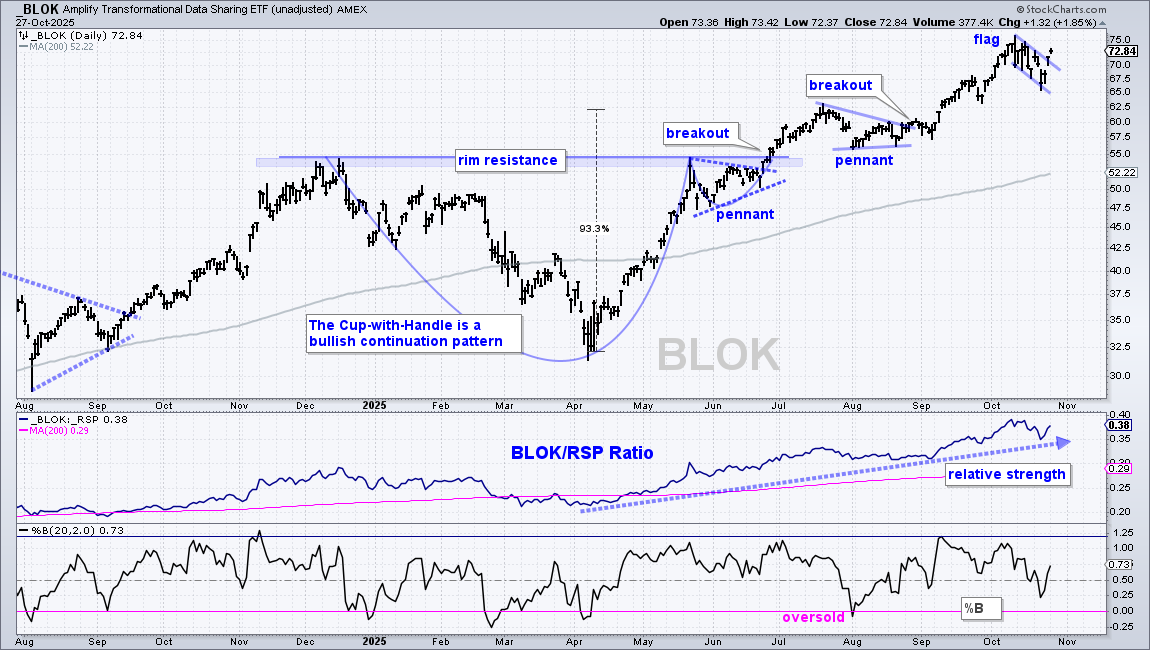
Most tech-related ETFs are in the midst of strong uptrends and leading the market. These long-term uptrends began with the mid May breakouts. Once an uptrend is underway, chartists must shorten their timeframe to find bullish setups and oversold conditions. Short-term bullish setups include flags, pennants and wedges that market pullbacks or consolidations. Oversold conditions are present when %B is near 0 or RSI (10) is near 30.
Even if you are not short-term oriented, traders can use these setups to accumulate within an uptrend and then exit when the long-term uptrend reverses. The key, as always, is to plan the trade ahead of time and then trade according to that plan. Many of these ETFs are up substantially since mid May, which means they could correct and move below the pennant lows (mid October lows). Such a move would not affect the long-term uptrends, but this is a possibility to consider.
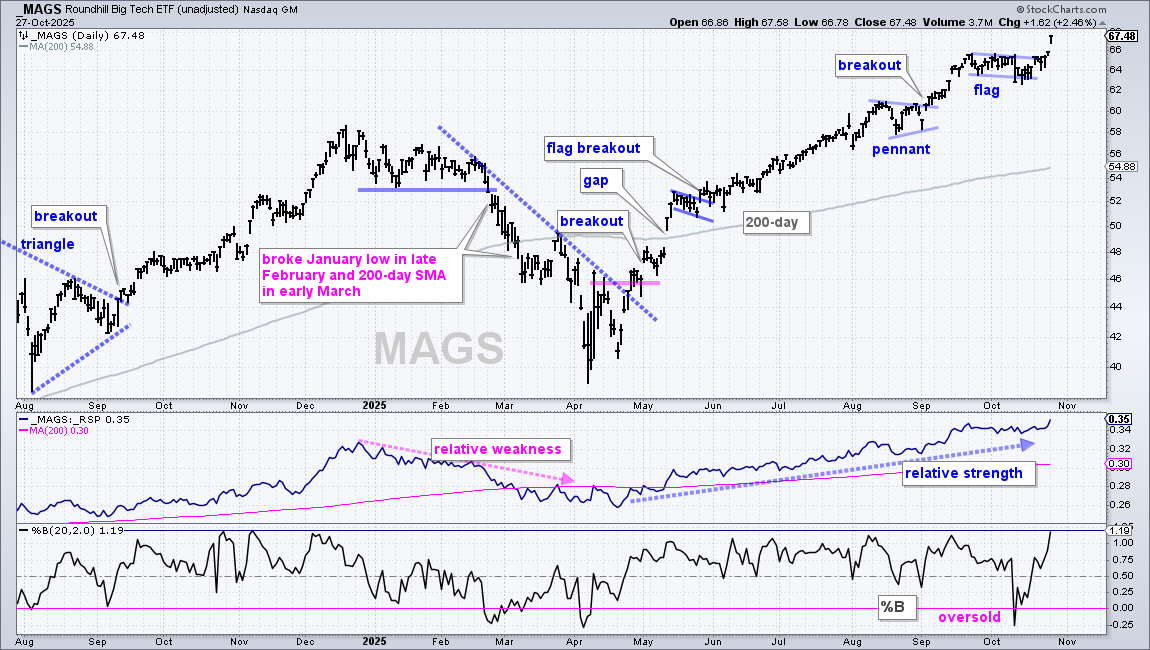
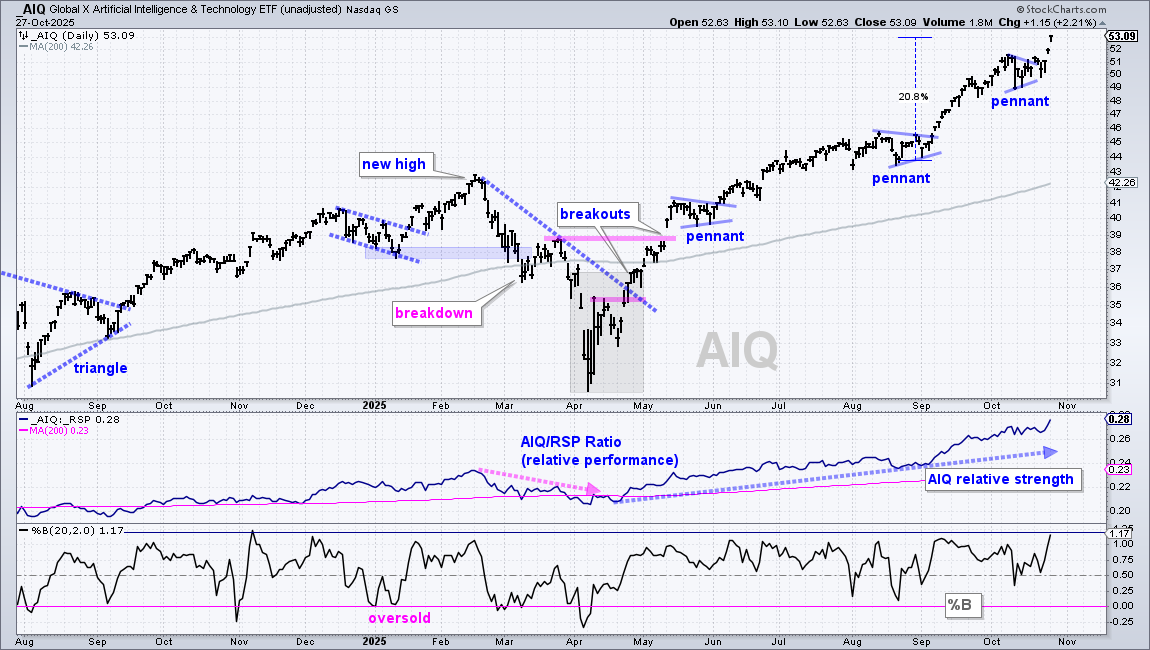
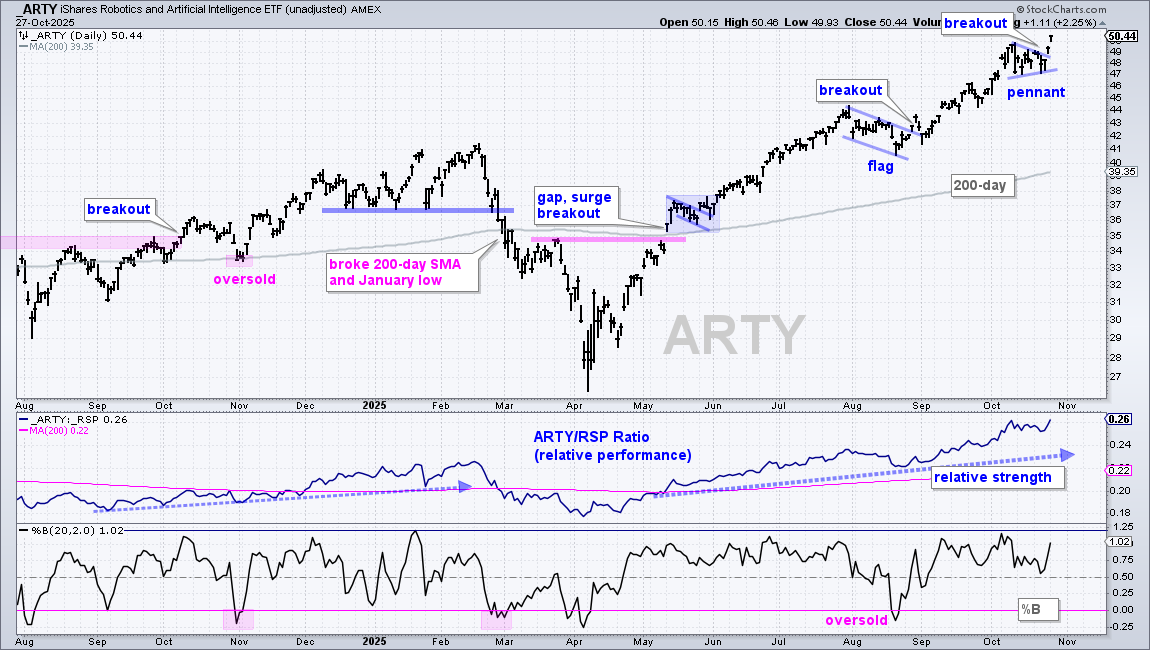
I featured short-term setups in the MAG7 and AI-related ETFs last week[1] (MAGS, IGV, BOTX, AIQ, BOTZ, SKYY). These six broke out with surges the last two days and hit new highs. The next charts show these ETFs and a few others with leading uptrends, relative strength and short-term breakouts. These ETFs are in the trend-monitoring phase. The setups triggered and it is now time to monitor price action and trade the plan.
Defense and Infrastructure Extend Higher
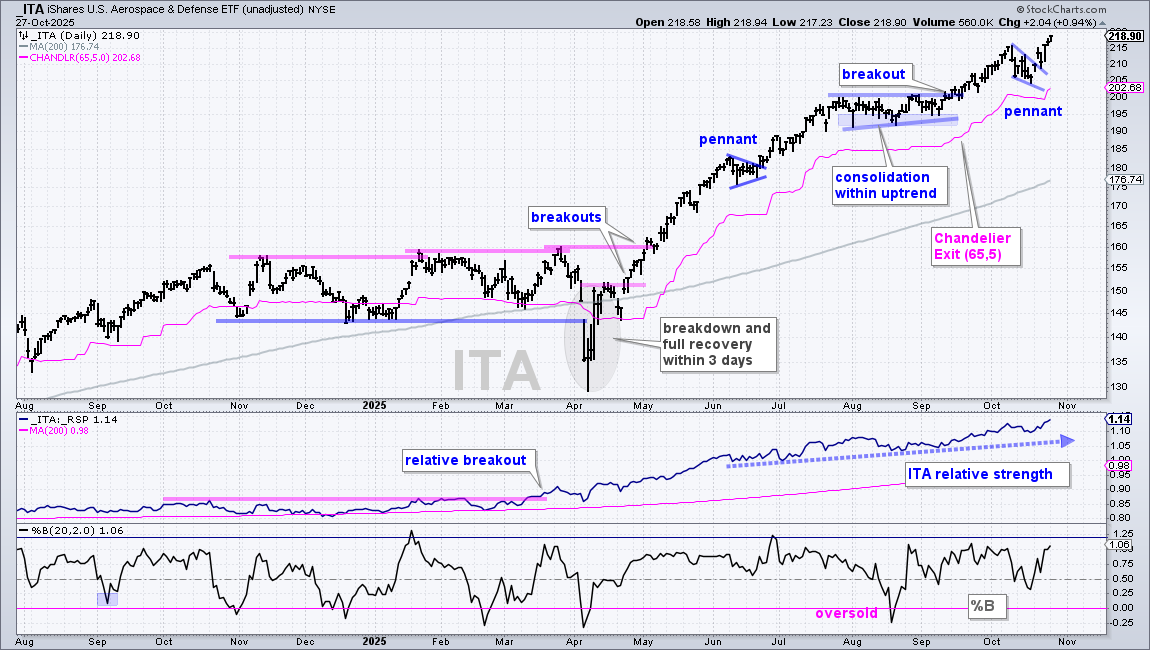
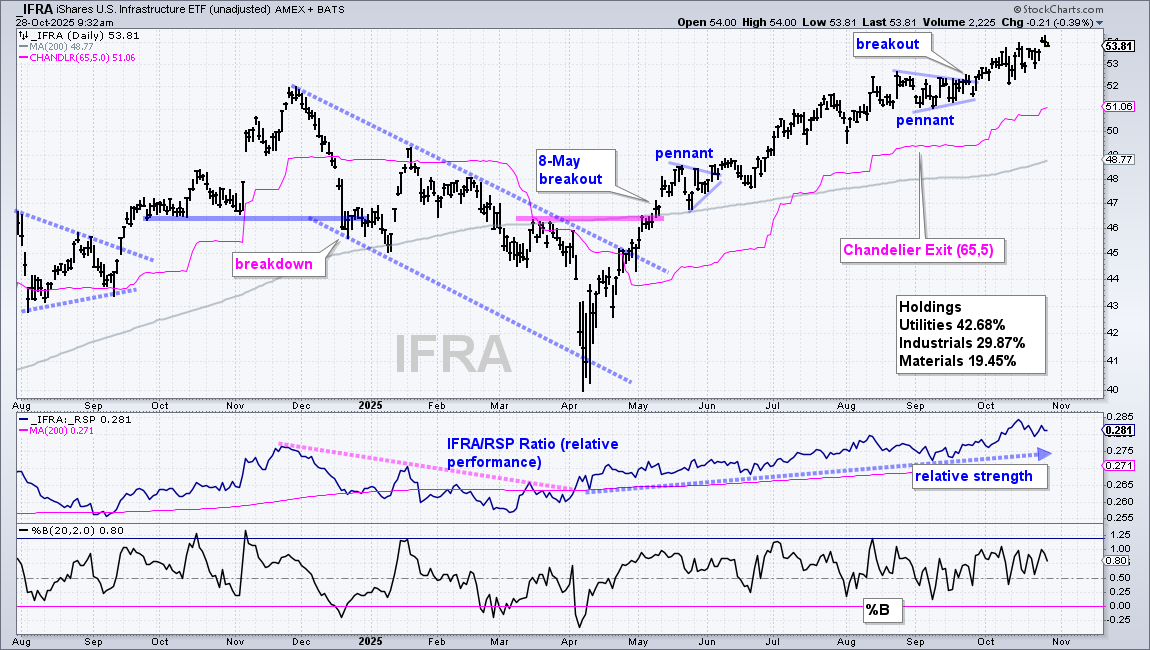
Outside of tech, the Aerospace & Defense ETF (ITA) and Infrastructure ETF (IFRA) continue to lead with strong uptrends. The first chart shows ITA with a pennant breakout five days ago and move to new highs. I featured this pennant in last week’s report. The pink line is the Chandelier Exit (65,5), which trend-followers can consider for an exit strategy. This exit is 5 ATR(65) values below the 65-day high, which means it rises as long as ITA rises. ITA hit a new 65-day high and the Chandelier Exit turned up the last two days.
The next chart shows IFRA with a pennant breakout in late September and new highs throughout October. ETFs hitting new highs are in leading uptrends. The pink line shows the Chandelier Exit (65,5) at 51.02 for reference. In the middle window, the IFRA/RSP ratio hit a new high in mid October as IFRA continues to outperform the broader market (RSP).
Six Other ETFs with Leading Uptrends
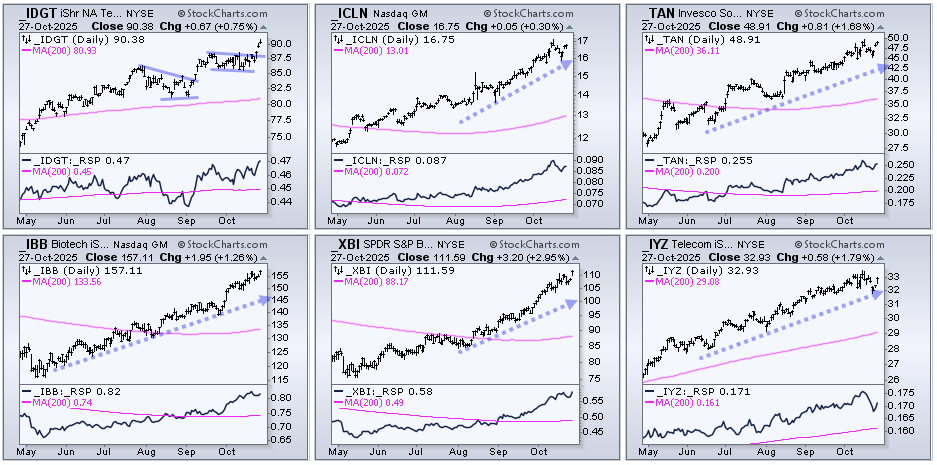
In addition to the ETFs above, I also see leading uptrends in the Digital Infrastructure (IDGT), Global Clean Energy ETF (ICLN), Solar Energy ETF (TAN), Biotech ETF (IBB), Biotech SPDR (XBI) and Telecom ETF (IYZ). The CandleGlance charts below show these ETFs hitting new highs in October. I do not see any setups right now, just leading uptrends.
DISCLAIMER: This content provided strictly for informational and educational purposes. It should not be interpreted as an offer to buy or sell any security, nor as a solicitation to engage in any investment activity. Nothing here constitutes a recommendation regarding any specific security, portfolio, transaction, or investment strategy.
At times, the author or affiliates may hold positions or interests in securities discussed. Any stocks or examples mentioned are not endorsements or suggestions to purchase. This material does not consider your individual financial goals or circumstances, and you should seek guidance from a qualified financial or investment adviser before making any trading or investment decisions.
Past performance does not guarantee future results.
Send feedback to support(at)trendinvestorpro.com or use the contact form. [2]