Headlines
- Coinbase Firms After Retracing 50 Percent
- Doordash Turns Up after Short Pullback
- Gilead Zigzags Higher
- Howmet Corrects and then Turns Up
- Kratos Forms Pennant within Leading Uptrend
- MKS Instruments Forms Inverse H&S
- Palantir Firms after Sharp Pullback
- Veeva Consolidates after Breakout Surge
The next report/video will be on Thursday, September 11th.
This report features stocks with uptrends and bullish setups. We start with Coindesk as it makes one step backward after two steps forward. Attention then turns to short-term consolidation patterns in DoorDash, Gilead, Howmet, Kratos and Palantir. MKS Inc is tracing out a head-and-shoulders and Veeva Systems reversed within a bigger bullish consolidation.
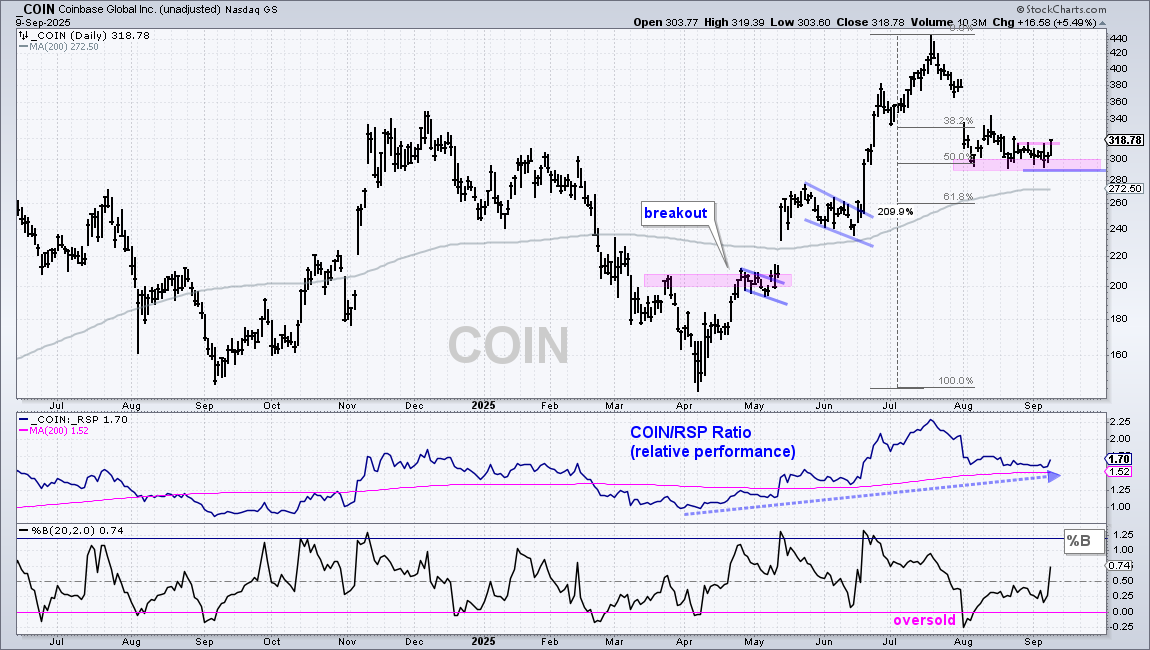
Coinbase Firms After Retracing 50 Percent
The chart below shows Coinbase (COIN) firming near the 50% retracement and above the 200-day SMA. COIN surged 210% from early April to mid July, breaking the 200-day and hitting new highs in the process. This move represents two steps forward. The stock then fell from 440 to 300, which represents one step backward (50% retracement). COIN also became oversold as %B dipped below 0 on August 1st. The stock then established support in the 300 area. This is an area of demand and buying pressure. I am seeing signs of an upturn as the stock broke above its highs of the last two weeks. This is the first sign that the correction is ending and the bigger uptrend is resuming. A close below 290 would call for a re-evaluation.
DASH Turns Up after Short Pullback
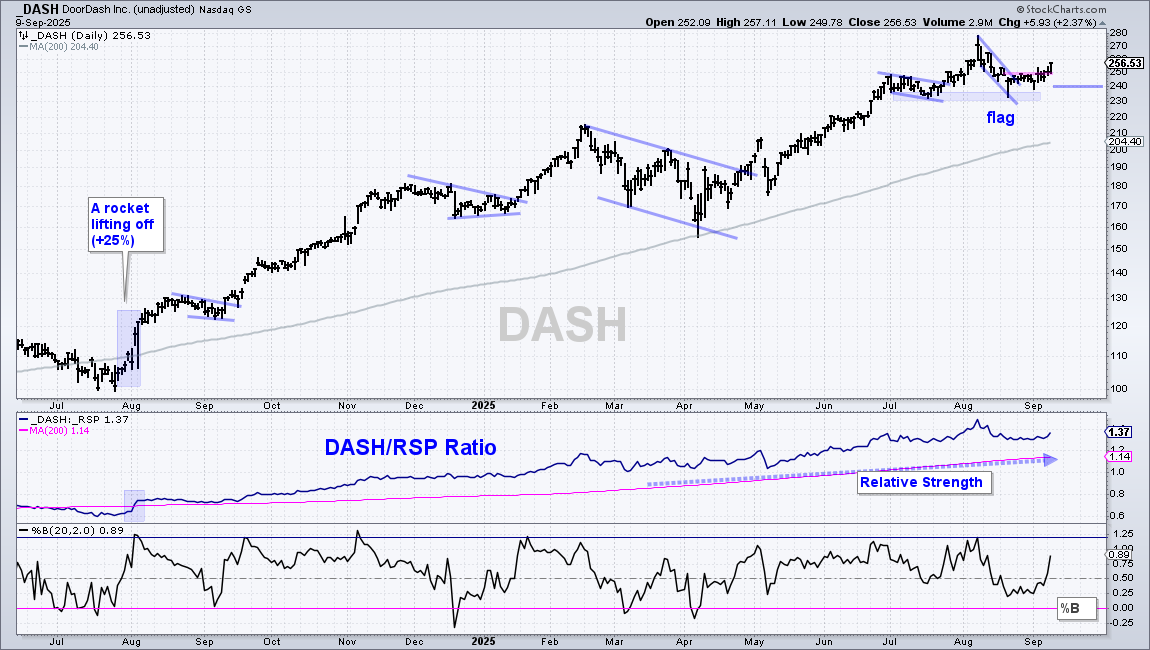
The next chart shows DoorDash (DASH) in a leading uptrend since August 2024, which is when it surged 20% (100 to 120) and the price-relative broke above its 200-day. Momentum strategies get their edge from these outliers (stocks with exceptional uptrends). After surging from 230 in mid July to 278 in early August, the stock finally corrected with a pullback to the 240 area. The blue shading marks support in the 230-240 area, and this support zone is holding. DASH turned up the last five days and broke short-term resistance at 250. This bullish price action argues for a continuation of the bigger uptrend.
Plan your Trade, Trade your Plan and Diversify
There are two ways to approach these short-term setups.
First, trade them as swing trades. A falling flag or wedge breakout is bullish and this signal remains valid until a break below the re-evaluation level, which is usually the low just before the breakout. For short-term trading, I usually set a profit target and close one third to one half of the position when this target is reached. A trailing stop is then placed to ensure that the entire trade does not result in a loss.
Second, use short-term setups to participate in the bigger uptrend. Bullish setups stem from short-term oversold conditions, falling wedges/flags or pullbacks. Instead of a re-evaluation level, the exit signal is based on a long-term trend change. Signals include the Trend Composite turning bearish, a cross below the 200-day SMA or a major support break. This means the potential loss will be larger, but there is also a possibility to take part in an extended uptrend.
Thus, plan before making the trade, and then trade according to that plan. Also consider position sizing and diversification to spread the risk.
Gilead Zigzags Higher
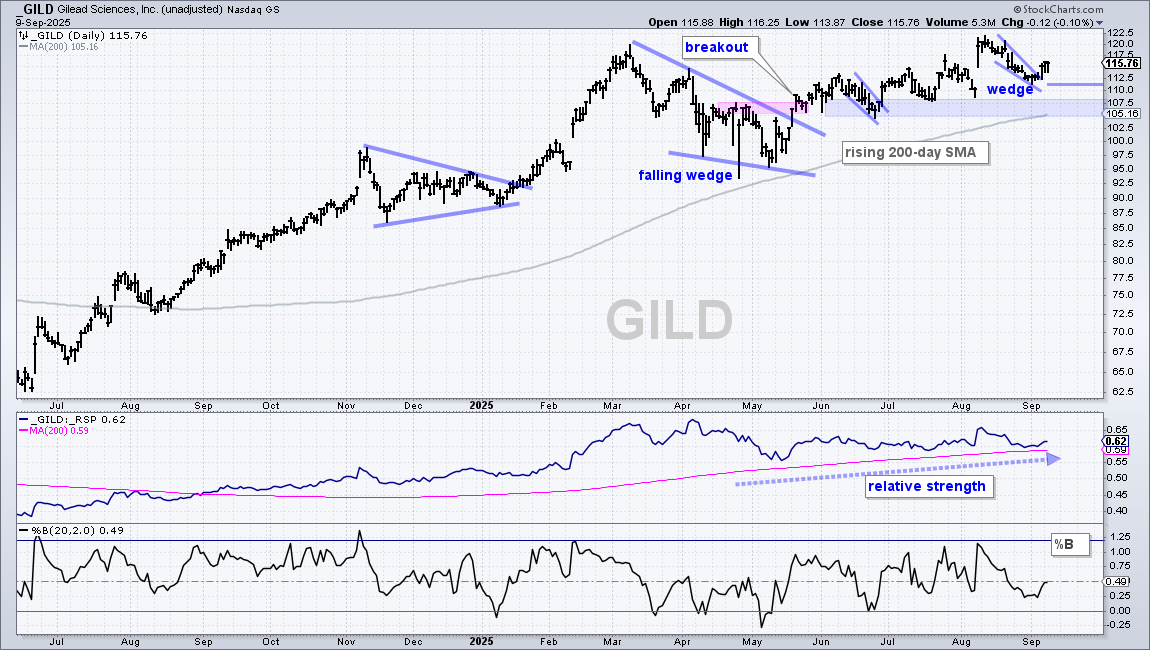
The next chart shows Gilead Sciences (GILD), which is part of the Healthcare sector and Biotech group. GILD is in an uptrend with a new high in August and price well above the 200-day SMA. Medium-term, the stock formed a falling wedge from March to May and broke out in mid May. Since this breakout, the stock worked its way higher with a zigzag the last few months. Most recently, a small wedge formed as the stock pulled back in the second half of August. GILD broke out with an advance the last three days and I view this as bullish. A close below 111 would negate the wedge breakout. Longer-term, the blue shading marks a support zone in the 105-108 area, and the 200-day SMA. A close below 105 would reverse the uptrend.
Howmet Corrects and then Turns Up
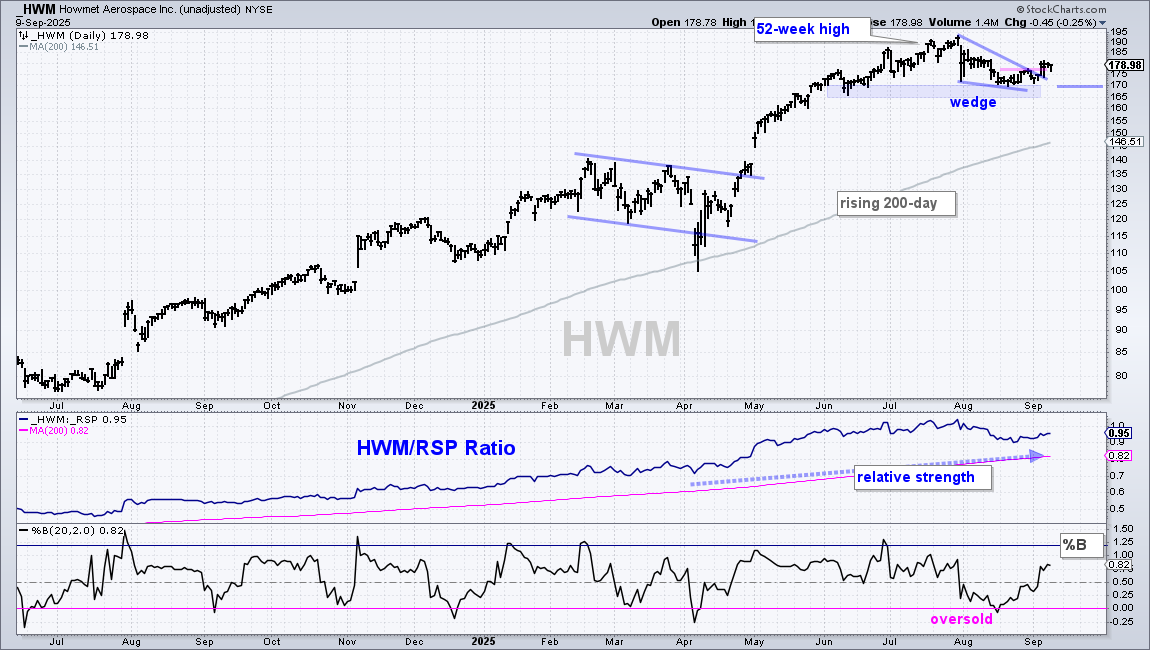
The next chart shows Howmet Aerospace (HWM) with a leading uptrend since the breakaway surge in late July 2024. HWM and its price-relative (HWM/RSP Ratio) have been above their rising 200-day SMAs for well over a year. The stock surged from 110 in April to 195 in July and then corrected with a falling wedge into August. HWM found support from the June lows (blue shading) and %B became oversold in mid August. Thus, there was an oversold condition and price was near support. This was the bullish setup. HWM broke out with a surge above short-term resistance last week. Short-term, this breakout is bullish and a close below 170 would argue for a re-evaluation. Long-term, the trend is up with the rising 200-day currently at 146.50.
Kratos Forms Pennant within Leading Uptrend
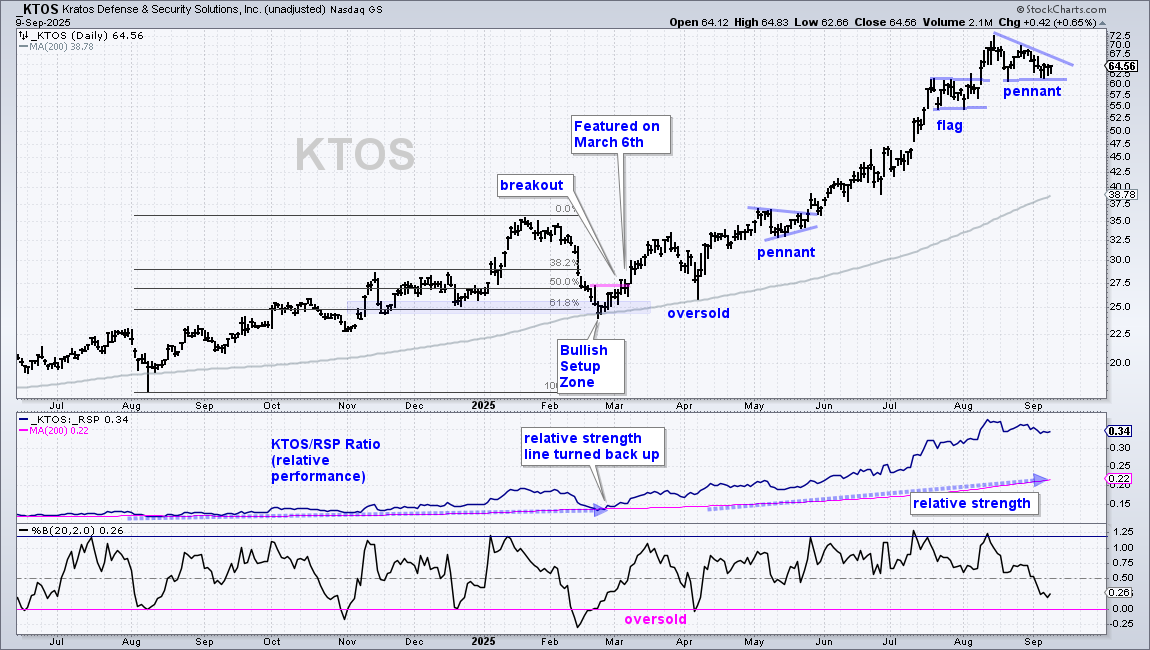
Kratos (KTOS) is also part of the Aerospace & Defense ETF (ITA), and in a leading uptrend. Note that KTOS was featured in early March [1] as it broke out at 27.50. Most setups in March 2024 failed because of the April plunge, but KTOS held up and led the market into mid August. Since the March breakout, there were three short-term opportunities (oversold, pennant and flag). Most recently, we have the fourth opportunity with a pennant. A breakout at 68 would be bullish and open the door to new highs.
MKS Forms Inverse Head & Shoulders
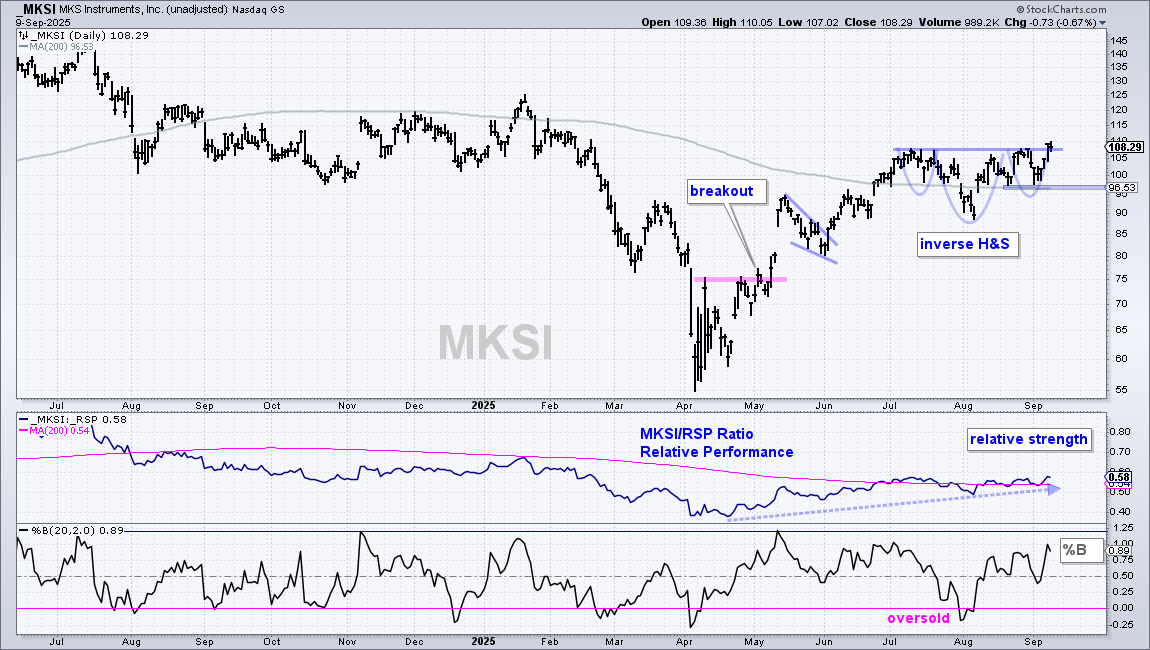
The next chart shows MKS Inc (MKSI), which is part of the Industrials sector. The company provides services and products to manufacturers. MKSI broke above its 200-day SMA in late June and has been leading the market since April. Short-term, the stock consolidated with price holding mostly above the 200-day SMA since July. An inverse head-and-shoulders is taking shape with a neckline breakout this week. Overall, the long-term trend is up and the recent breakout signals a continuation of this uptrend. The lows of the right shoulder and 200-day mark support at 95. A close below this level would argue for a re-evaluation.
Palantir Firms after Sharp Pullback
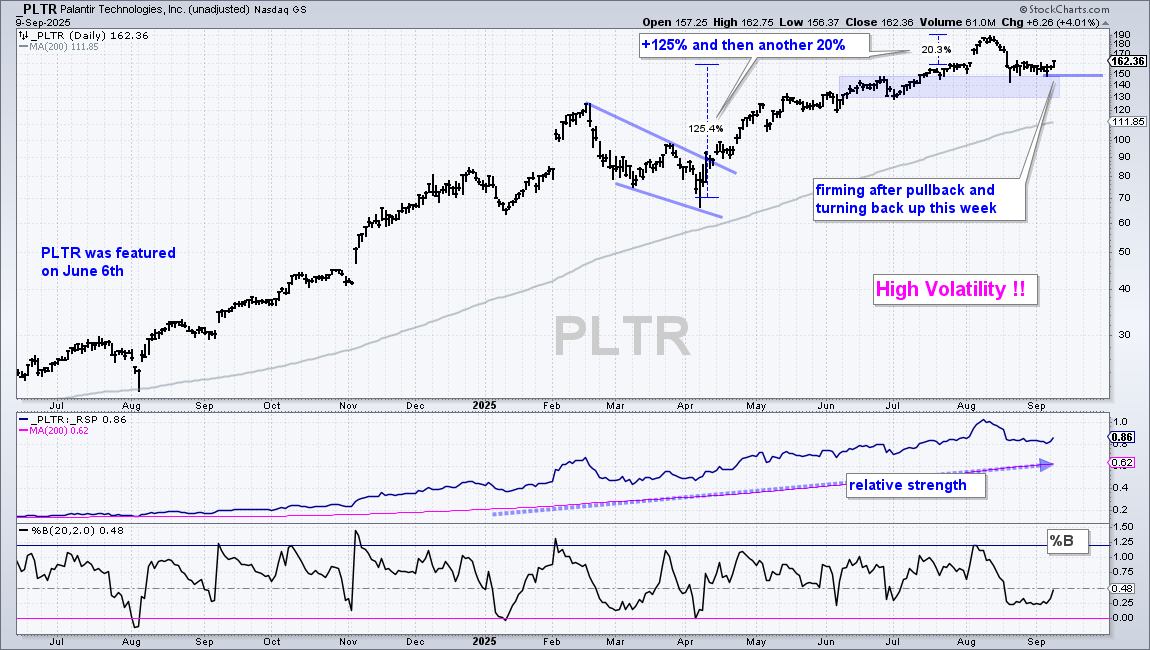
The next chart shows Palantir (PLTR) with a leading uptrend since June 2024. PLTR was featured on June 6th (2024) [2] as a bullish triangle formed. Note that this stock has extremely high volatility and valuations are in the stratosphere. Its price/sales ratio is above 100! Expect a wild ride. The long-term trend is up with a new high in August. Notice that PLTR surged 125% from April to late July and then tacked on another 20% with a surge in early August. A sharp surge after an extended advance is a blow-off top that signals excess. PLTR subsequently corrected with a decline back to the late July levels and consolidated around 160 for several weeks. Signs of demand and buying pressure are evident in the 150-160 area (support). Most recently, PLTR turned up the last two days and could be ripe for another move higher. A close below 150 would call for a re-evaluation.
Veeva Consolidates after Breakout Surge
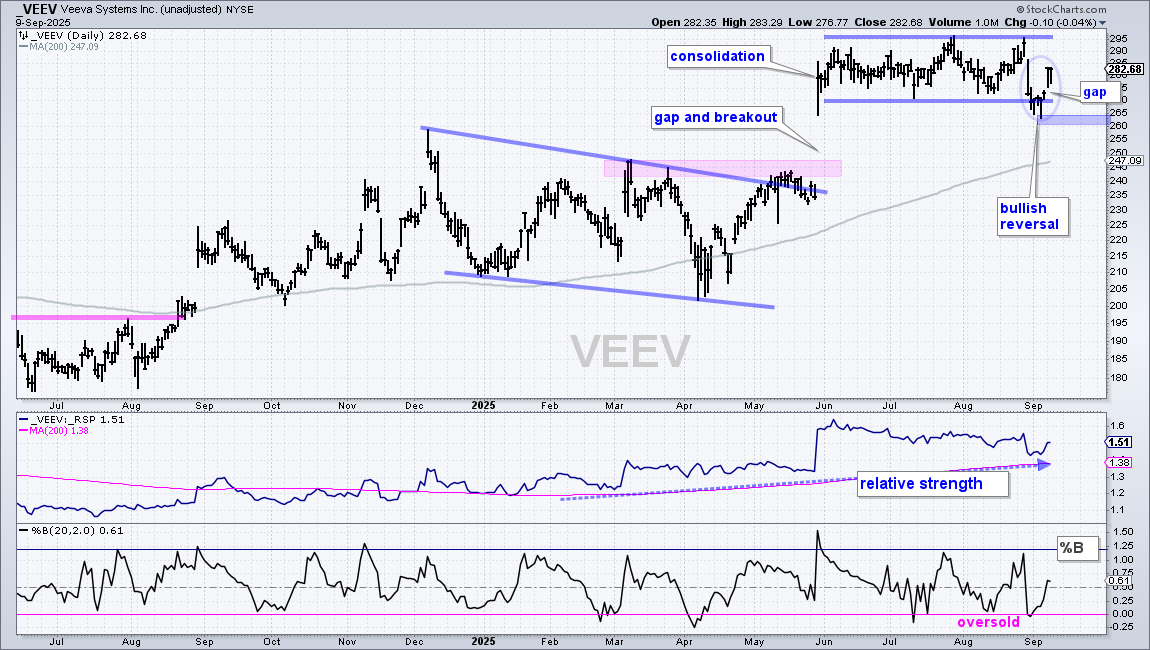
The next chart shows Veeva Systems (VEEV) with a bullish consolidation forming since June. Veeva provides software and services to the life sciences industry. The stock is in a long-term uptrend with a new high in late July and price above the rising 200-day SMA. After a breakout surge in late May, the stock consolidated from June to September with a trading range. I view this as a consolidation within an uptrend, which makes it a bullish continuation pattern. There was a sharp decline in late August, but the stock managed to firm into early September and reverse with a gap-surge the last three days (blue oval). I view this as a bullish reversal within a bigger bullish pattern. A move above 295 would break consolidation resistance and signal a continuation higher. Short-term, a close below 270 would fill the gap and negate the short-term reversal. Longer-term, a break below 260 would be negative.
DISCLAIMER: This content provided strictly for informational and educational purposes. It should not be interpreted as an offer to buy or sell any security, nor as a solicitation to engage in any investment activity. Nothing here constitutes a recommendation regarding any specific security, portfolio, transaction, or investment strategy.
At times, the author or affiliates may hold positions or interests in securities discussed. Any stocks or examples mentioned are not endorsements or suggestions to purchase. This material does not consider your individual financial goals or circumstances, and you should seek guidance from a qualified financial or investment adviser before making any trading or investment decisions.
Past performance does not guarantee future results.
Send feedback to support(at)trendinvestorpro.com or use the contact form. [3]