Posted By
Arthur Hill, CMT
On
In
Archive |
No Comments
Headlines
Monitoring the Uptrends in SPY, QQQ and XLK
To correct or not to correct? 10 Tech ETFs
Nasdaq 100 Stocks Struggling
Long-term Support for Mid and Small Caps ETFs
Regional Bank ETF Tracks Small-caps
Utilities SPDR Remains with Bullish Pullback
The next report/video will be on Tuesday, September 9th. The Friday Chart Fix will be posted on September 5th.
Monitoring the Uptrends in SPY, QQQ and XLK
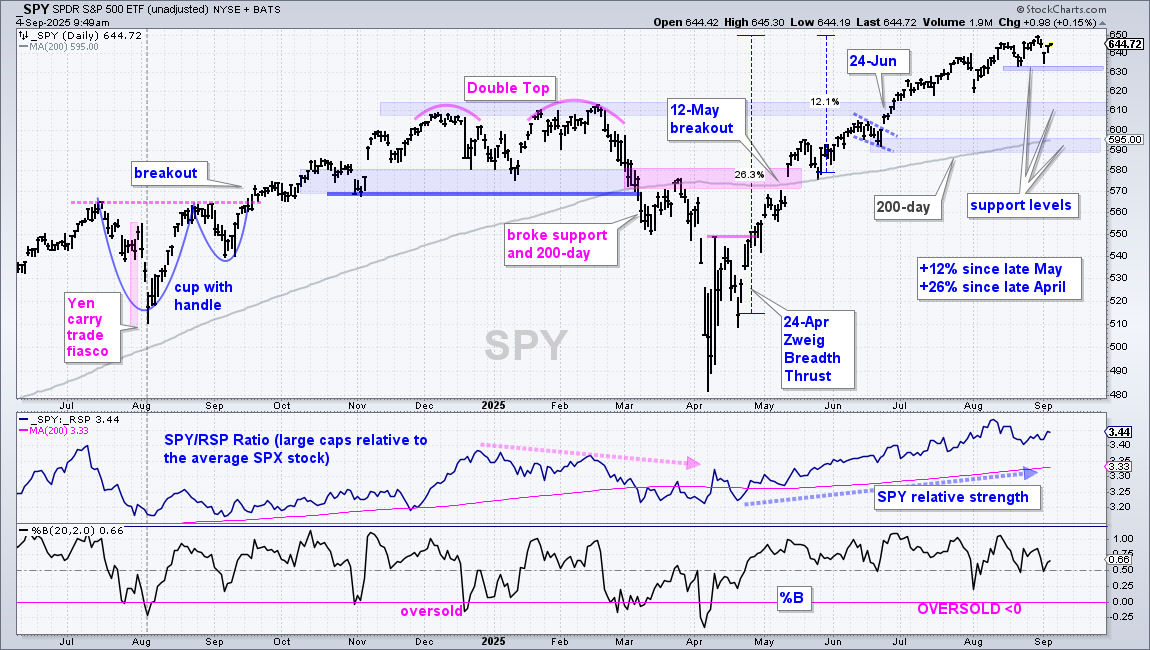
SPY, QQQ and XLK are in uptrends with the mid-late August lows marking first support. The market is in good shape as long as these three hold support. In other words, stocks could continue working their way higher because a trend in motion stays in motion. Support breaks would forge lower lows and reverse the short-term uptrends. This would argue for a corrective period. The first chart shows SPY with support marked at 630, a break of which would target a move to the next support zone in the 610 area.
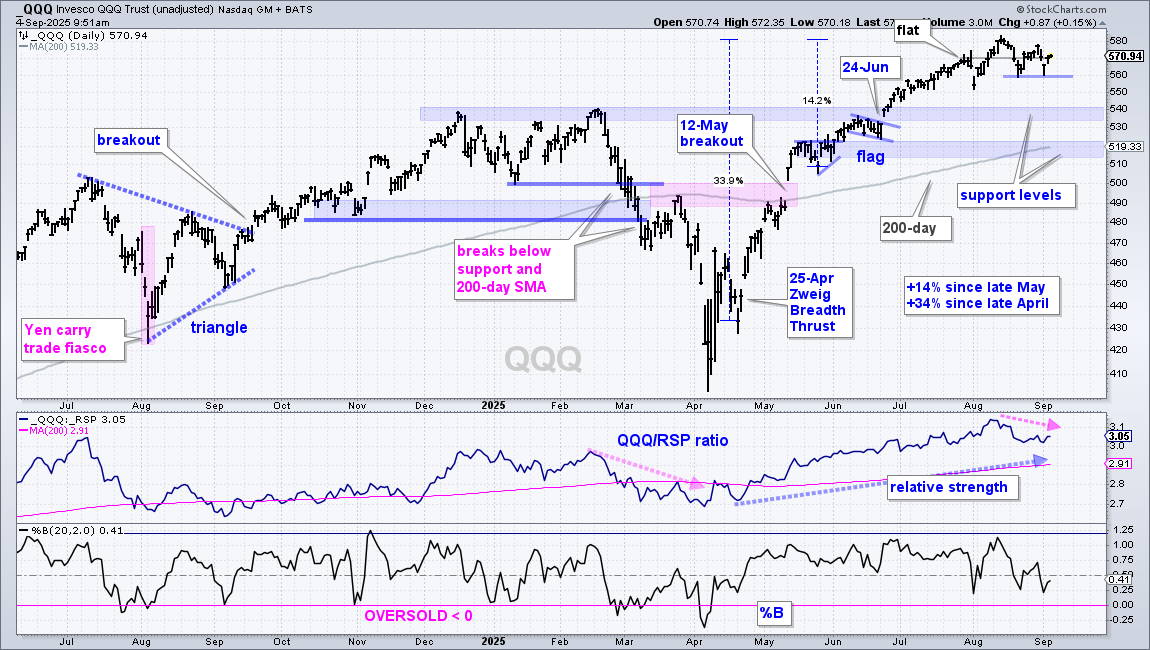
The next chart shows QQQ within a short-term uptrend and support marked at 560. QQQ traded flat since late July, but sideways is not the same as down. A break at 560 would reverse the short-term uptrend and put QQQ in corrective mode. The next support level is at 540.
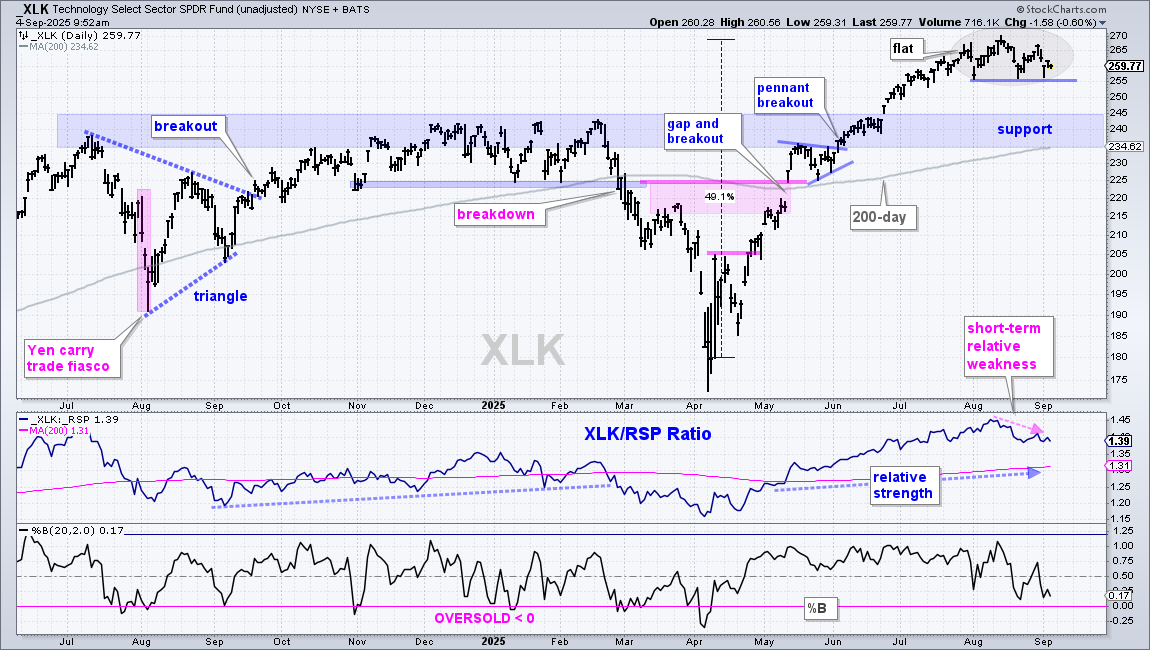
The next chart shows the Technology SPDR (XLK) with support marked at 255. Note that the Technology sector accounts for a third of the S&P 500. Thus, a correction in QQQ and XLK would weigh on SPY.
Nasdaq 100 Stocks are Struggling
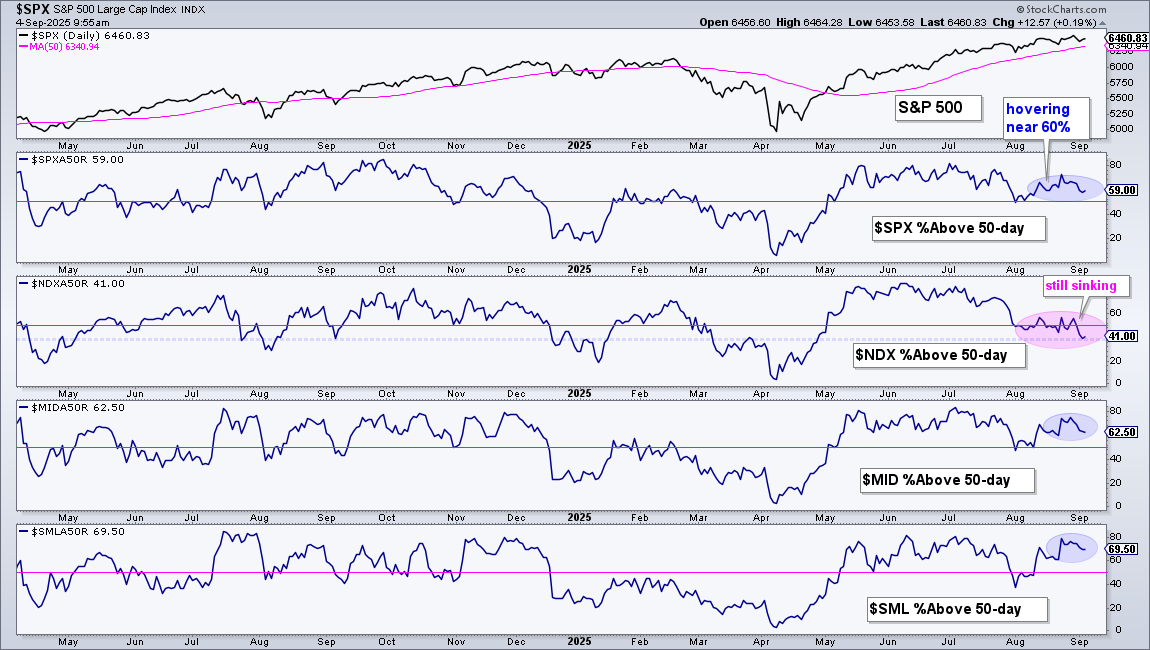
The next chart shows the percentage of stocks above their 50-day SMAs. The middle window shows Nasdaq 100 %Above 50-day SMA falling to 39% on Wednesday and hitting its lowest level since late April. It is currently at 41%. Notice that this indicator fell sharply in July, stayed near 50% in August and fell further the last few days. Weakness is spreading within the Nasdaq 100 because fewer stocks are holding above their 50-day SMAs. This increases the chances for a correction in QQQ and XLK.
To correct or not to correct? 10 Tech ETFs
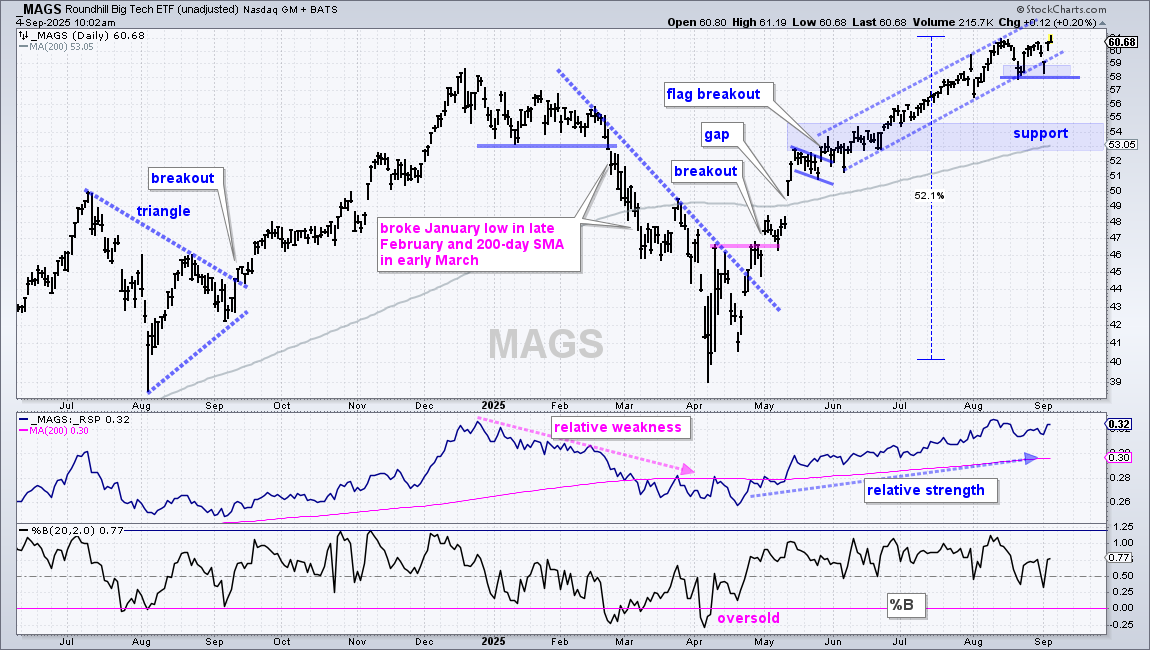
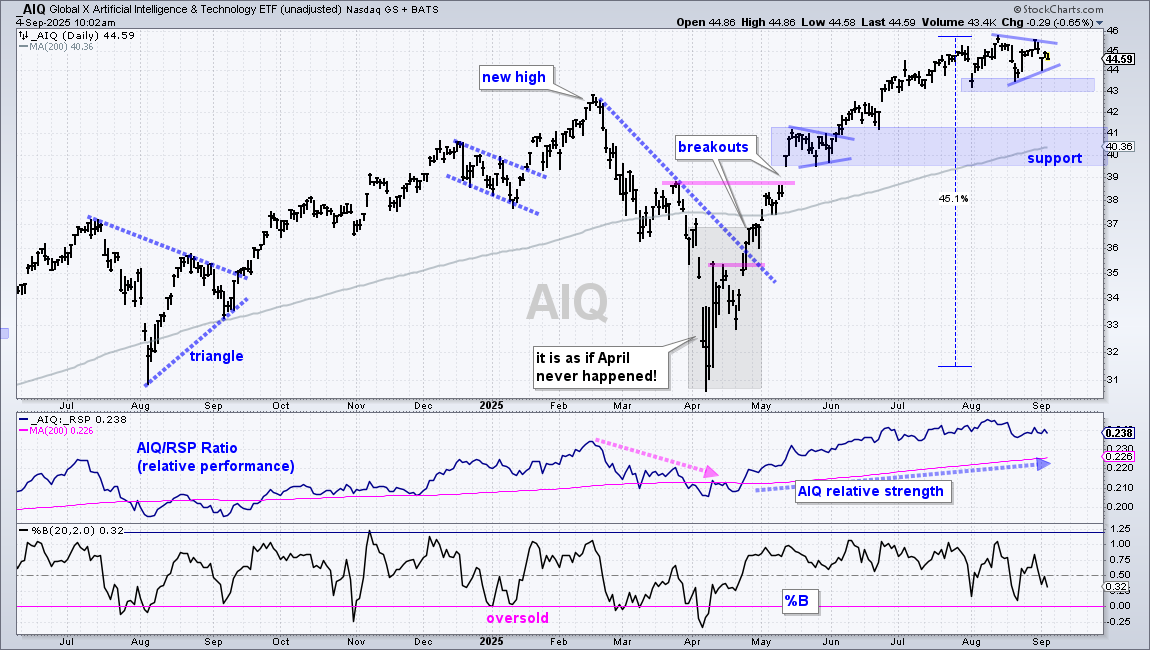
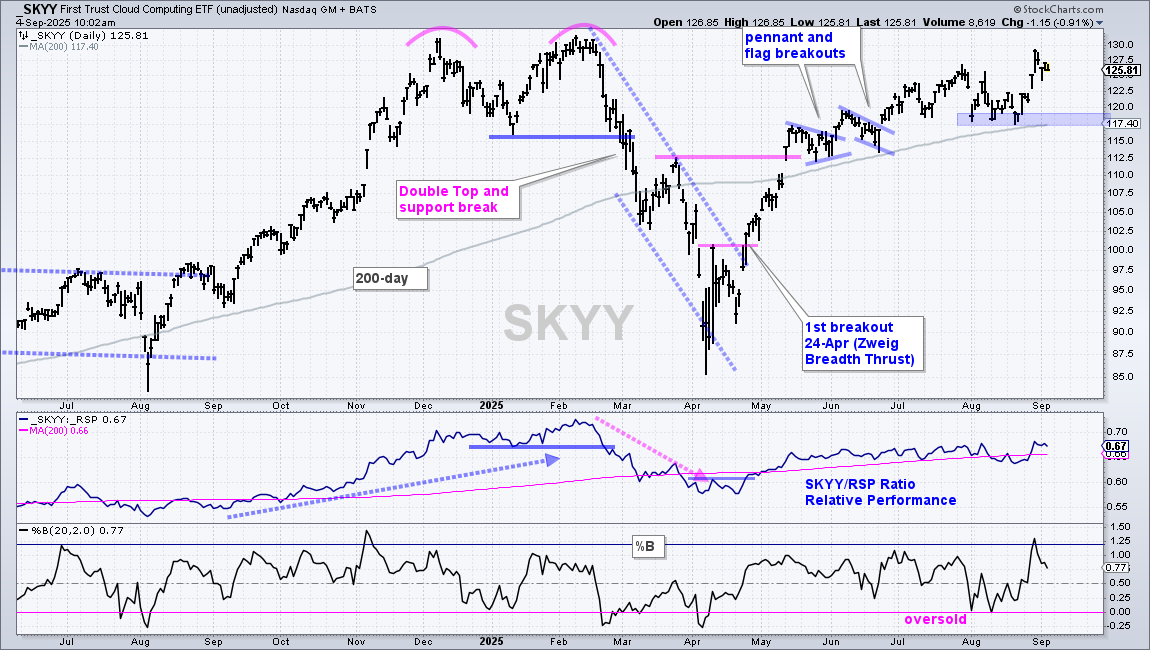
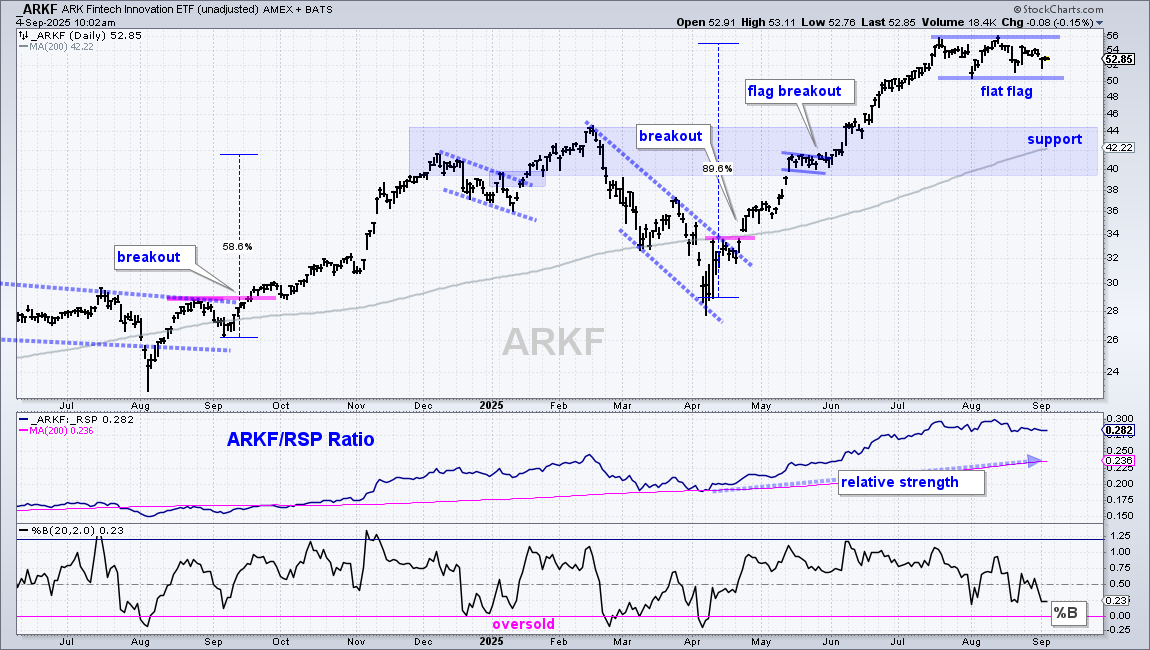
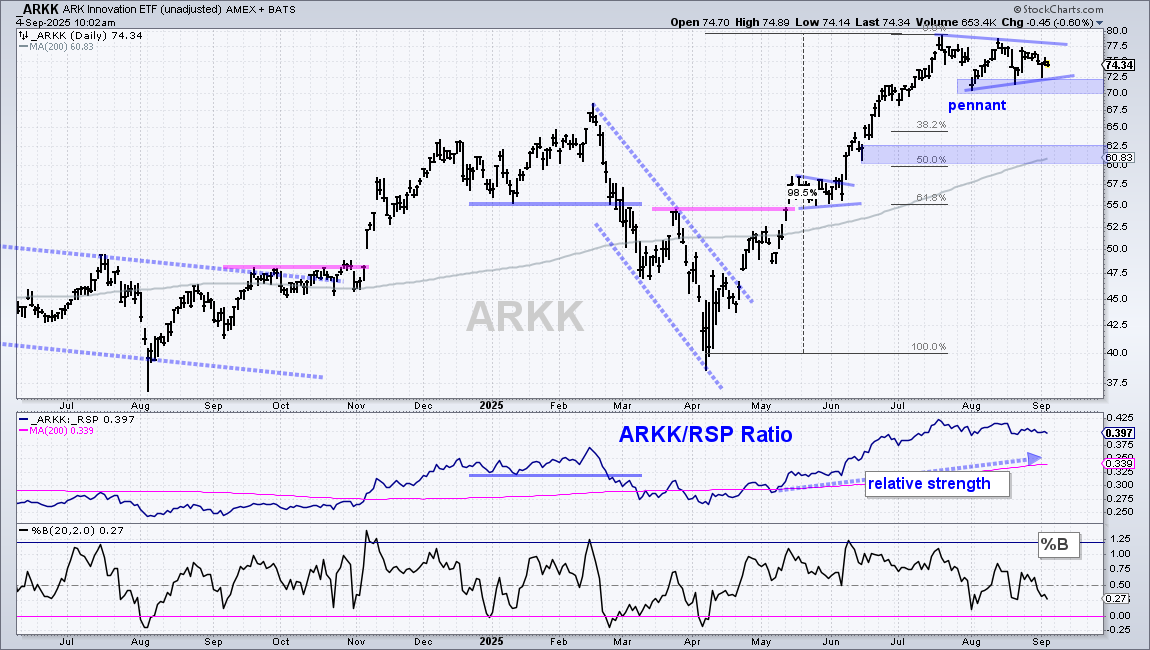
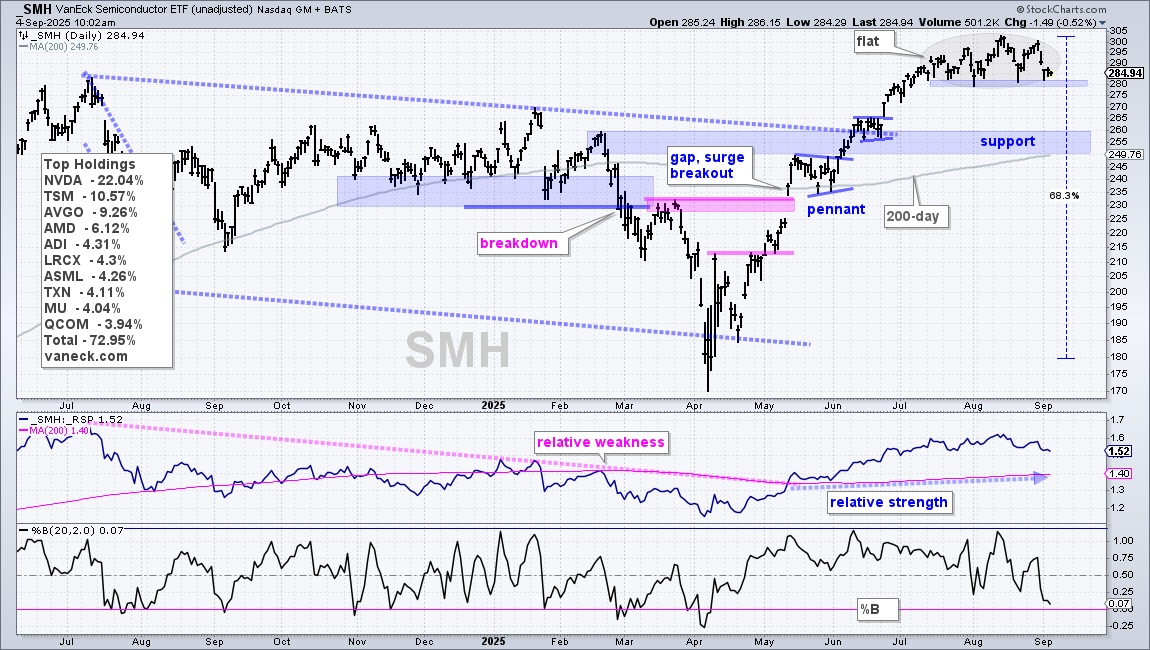
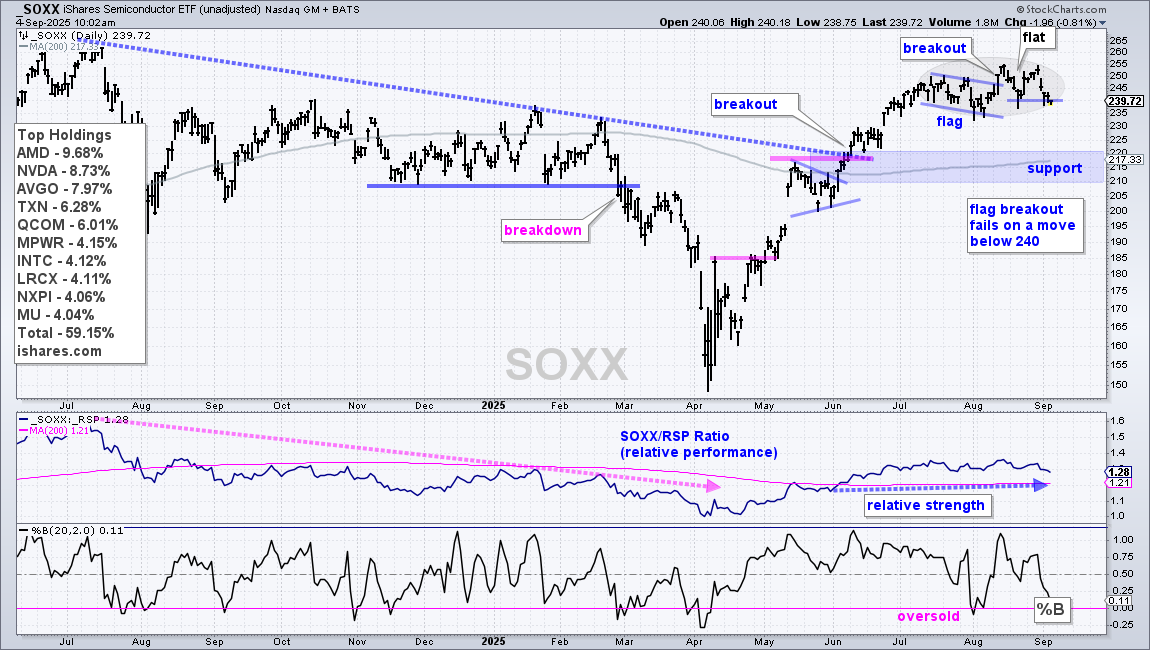
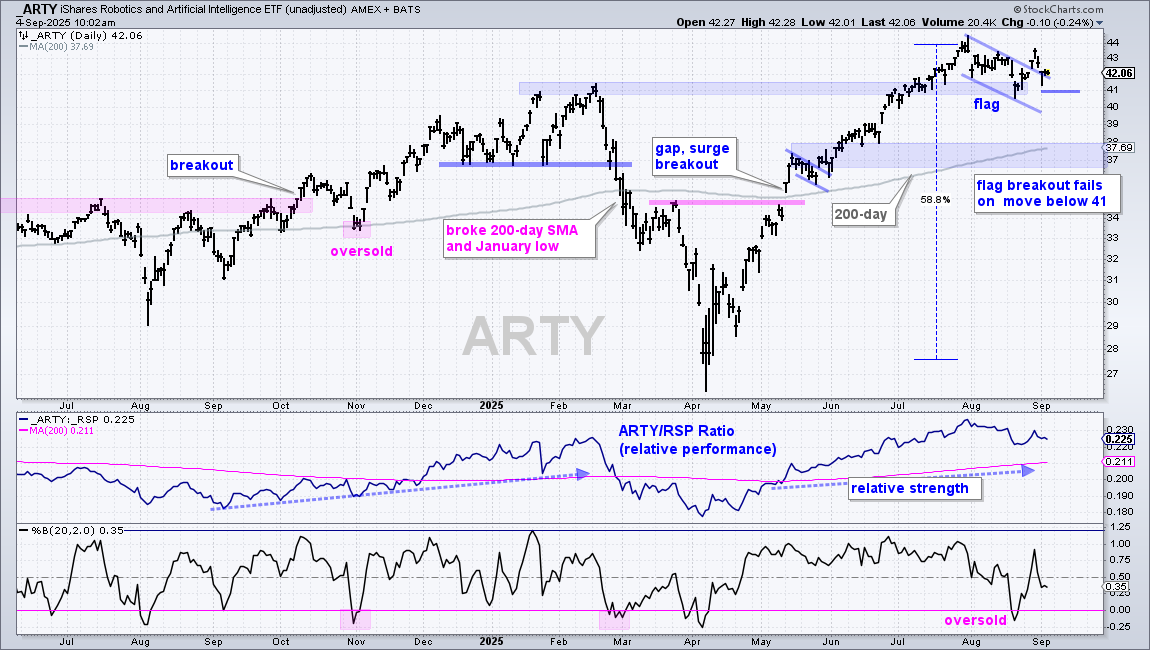
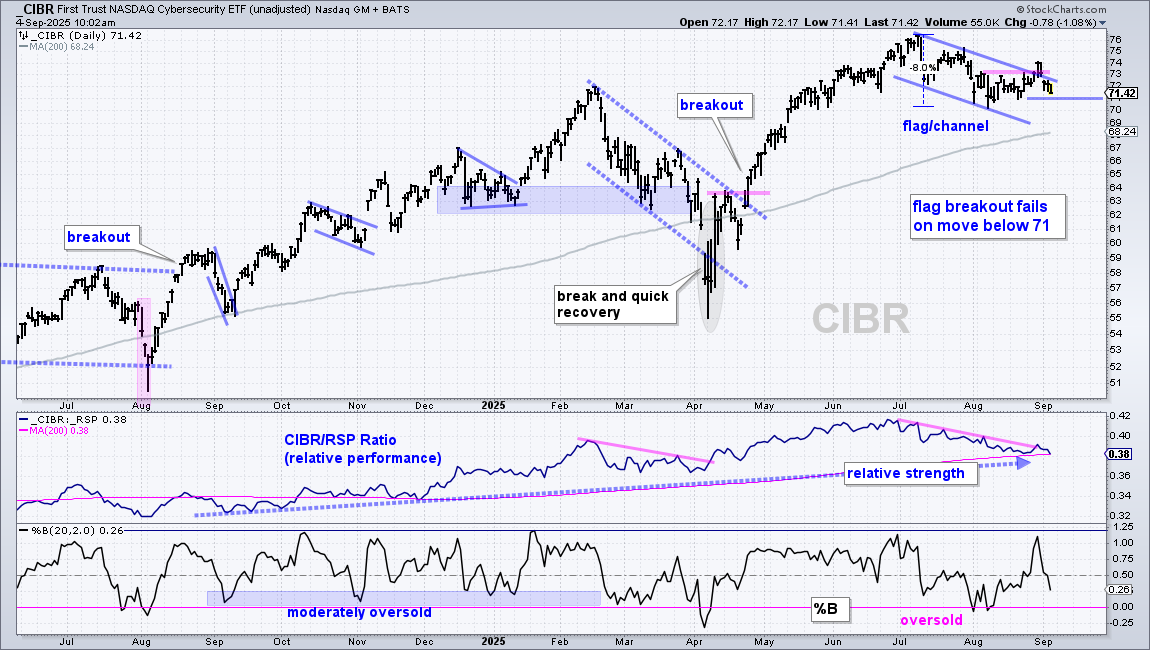
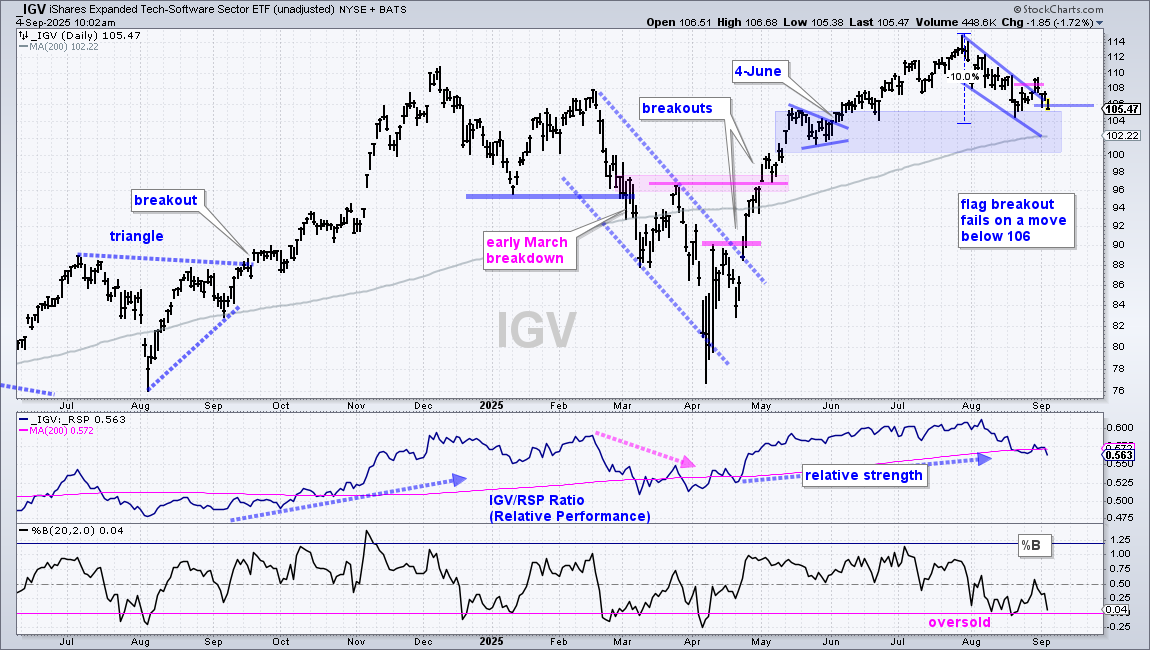
The August lows hold the key for the Technology SPDR and QQQ, and the same is true for the tech-related ETFs. Some of these are in uptrends (MAGS), some are consolidating with trading ranges (ARKF), some formed possible pennants (AIQ, ARKK) and some corrected into August (CIBR, SOXX, IGV). Each chart below shows the short-term support levels to watch. The more that break, the broader the correction.
Long-term Support for Mid and Small Caps ETFs
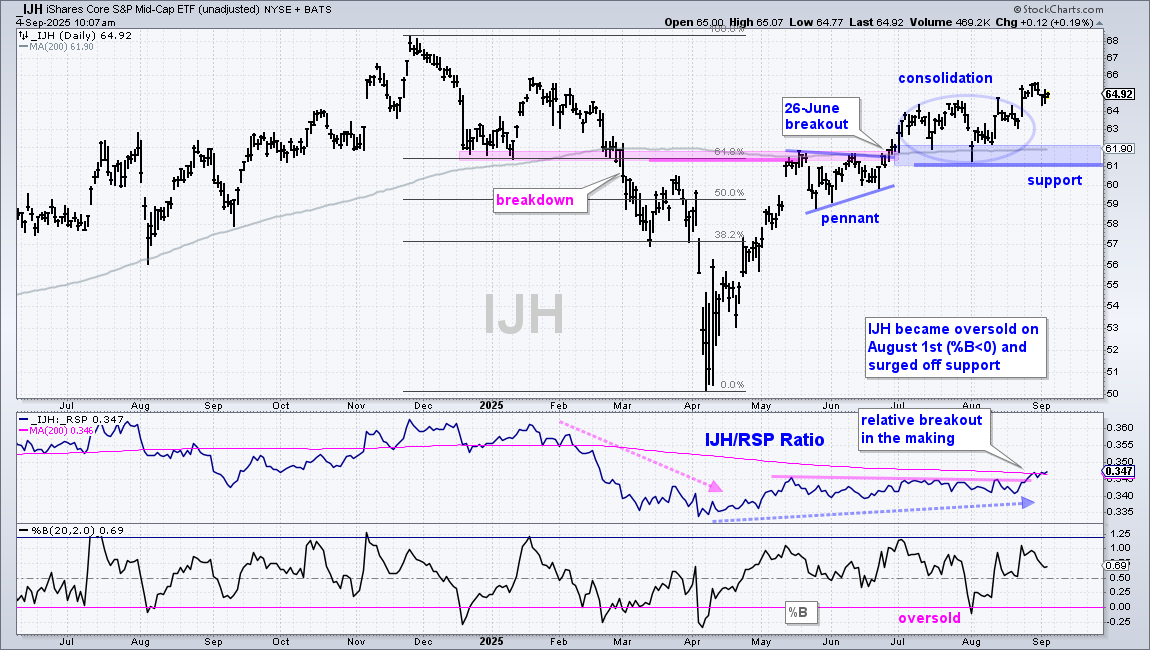
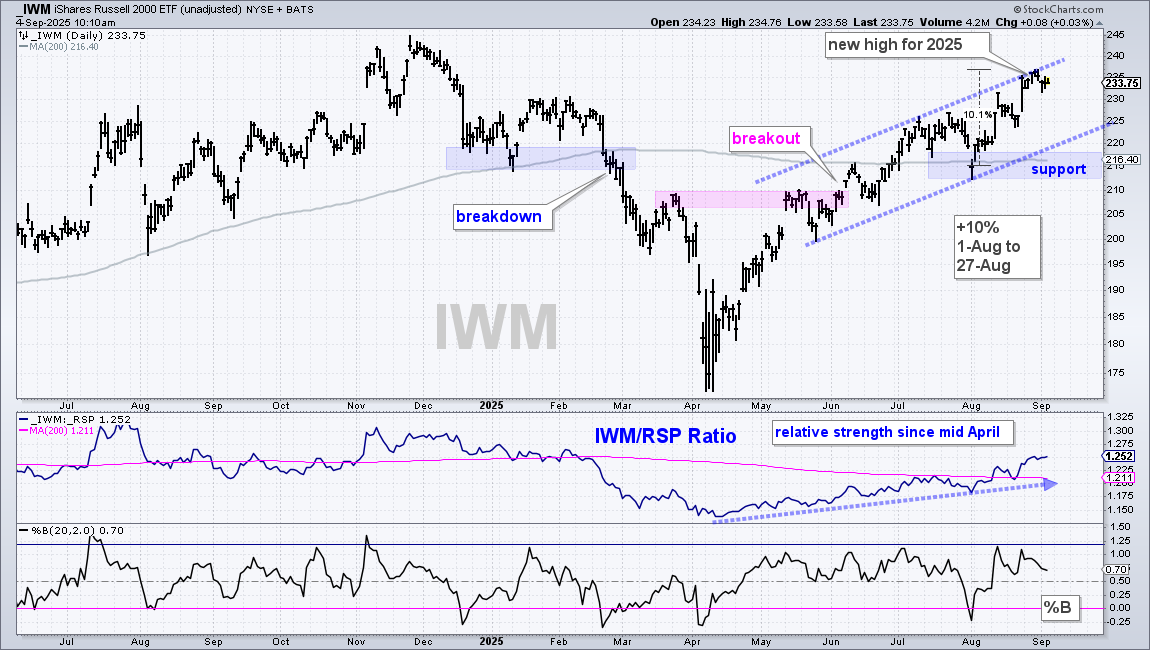
The S&P MidCap 400 ETF (IJH), S&P SmallCap 600 SPDR (IJR) and Russell 2000 ETF (IWM) are in uptrends with the July-August lows marking long-term support. The chart below shows IJH with a trend-reversing breakout in late June and support in the 61-62 area. The middle window shows the price-relative edging above its 200-day SMA as IJH starts to outperform.
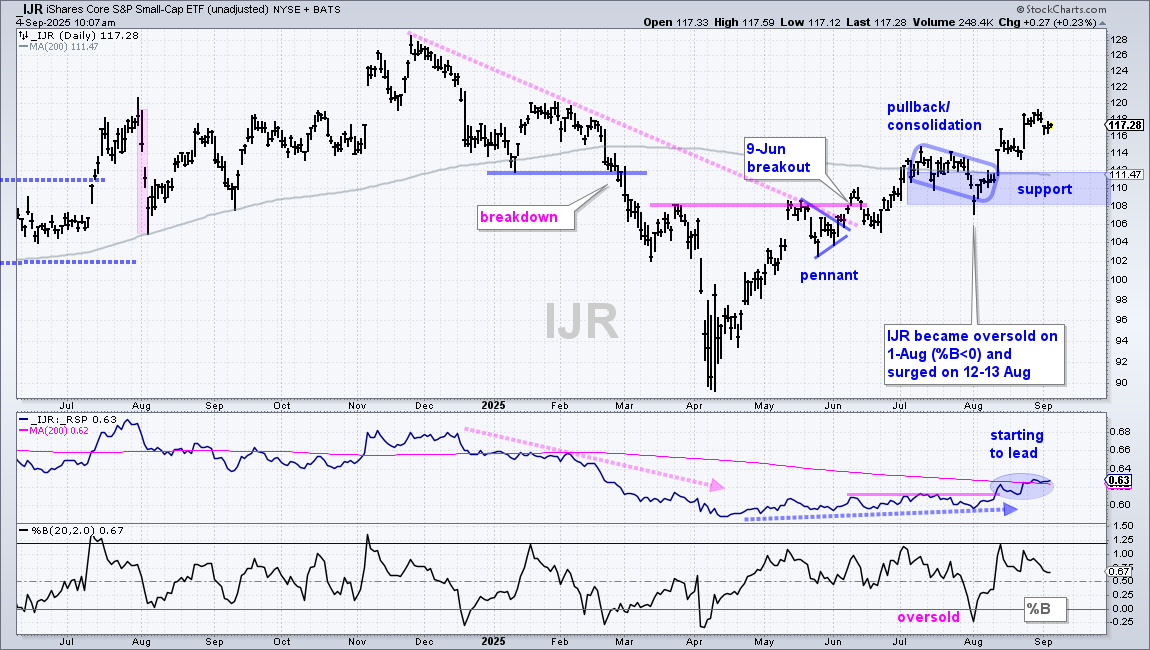
The next chart shows IJR with support in the 108-111 area.
The next chart shows IWM with support in the 212-217 area.
Regional Bank ETF Tracks Small-caps
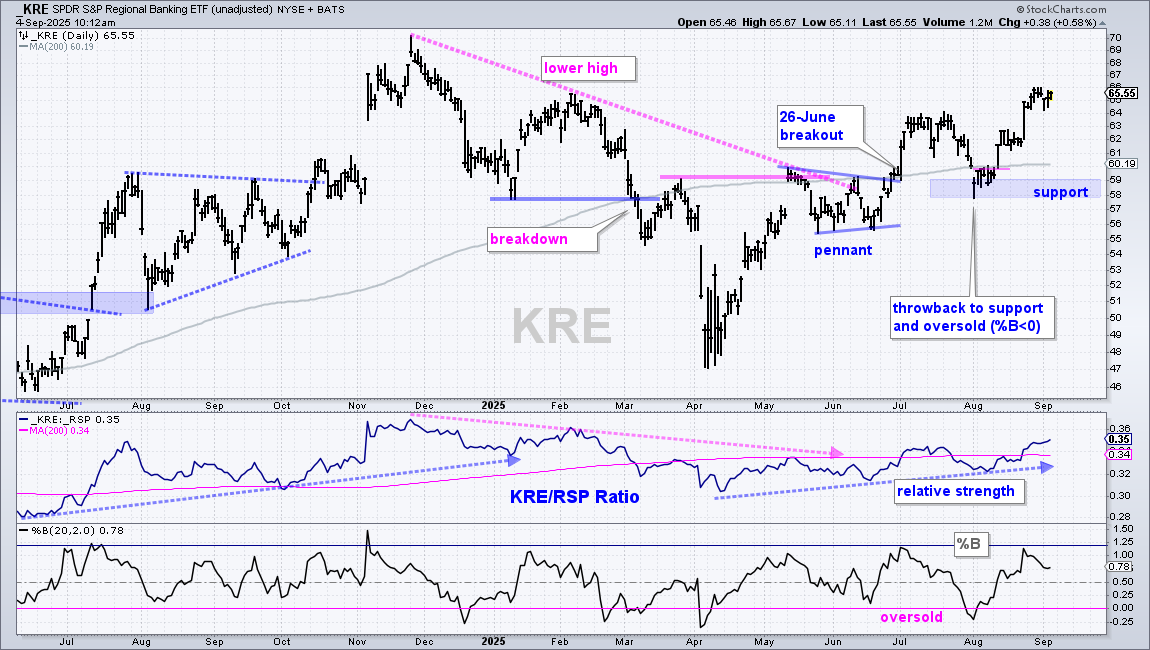
The next chart shows the Regional Bank ETF (KRE) in an uptrend with the August lows marking long-term support (58). KRE is also starting to outperform as the price-relative KRE/RSP ratio) works its way higher the last few months (middle window).
Utilities SPDR Remains with Bullish Pullback
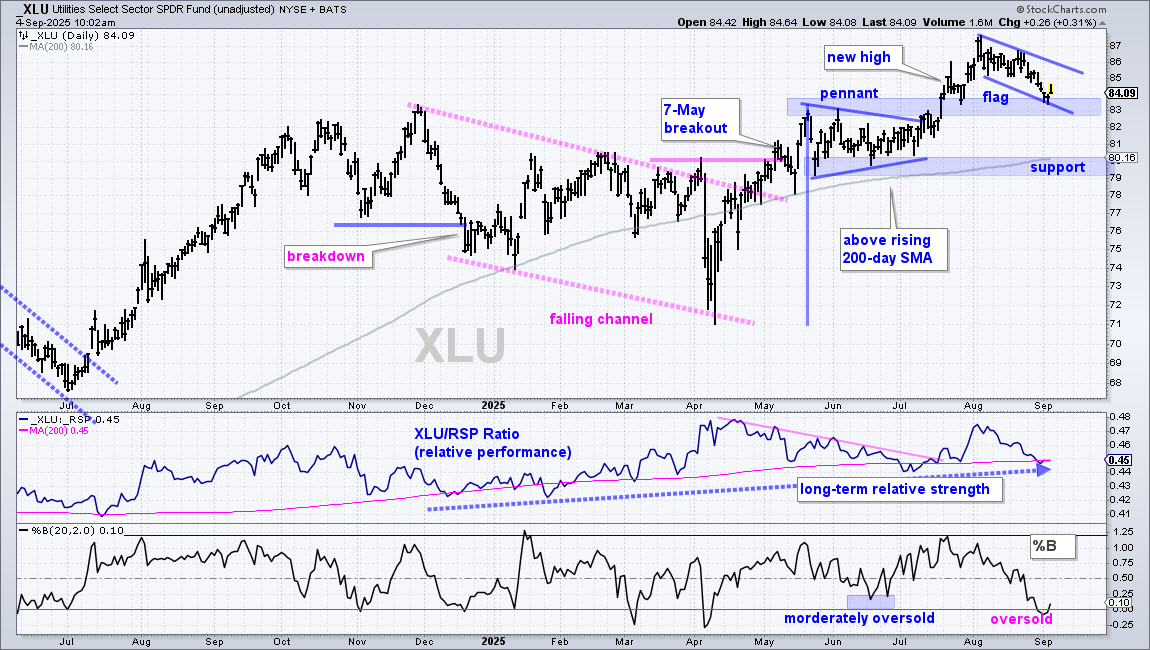
The next chart shows the Utilities SPDR (XLU) with new highs in July-August and price above the rising 200-day SMA. Despite a long-term uptrend, XLU fell back to the breakout zone (blue shading) and %B became oversold (lower window). A move below zero means the close was below the lower Bollinger Band (20,2). XLU is setting up with oversold conditions and a support test. Time to watch closely for signs of short-term strength. A flag is taking shape and a breakout at 86 would be bullish.
DISCLAIMER: This content provided strictly for informational and educational purposes. It should not be interpreted as an offer to buy or sell any security, nor as a solicitation to engage in any investment activity. Nothing here constitutes a recommendation regarding any specific security, portfolio, transaction, or investment strategy.
At times, the author or affiliates may hold positions or interests in securities discussed. Any stocks or examples mentioned are not endorsements or suggestions to purchase. This material does not consider your individual financial goals or circumstances, and you should seek guidance from a qualified financial or investment adviser before making any trading or investment decisions.
Past performance does not guarantee future results.
Send feedback to support(at)trendinvestorpro.com or use the contact form. [1]