SPY in Leading Uptrend – 60+ Percent of Stocks above 200-day – Spreads Narrow
Posted By
Arthur Hill, CMT
On
In
Archive |
No Comments
Headlines
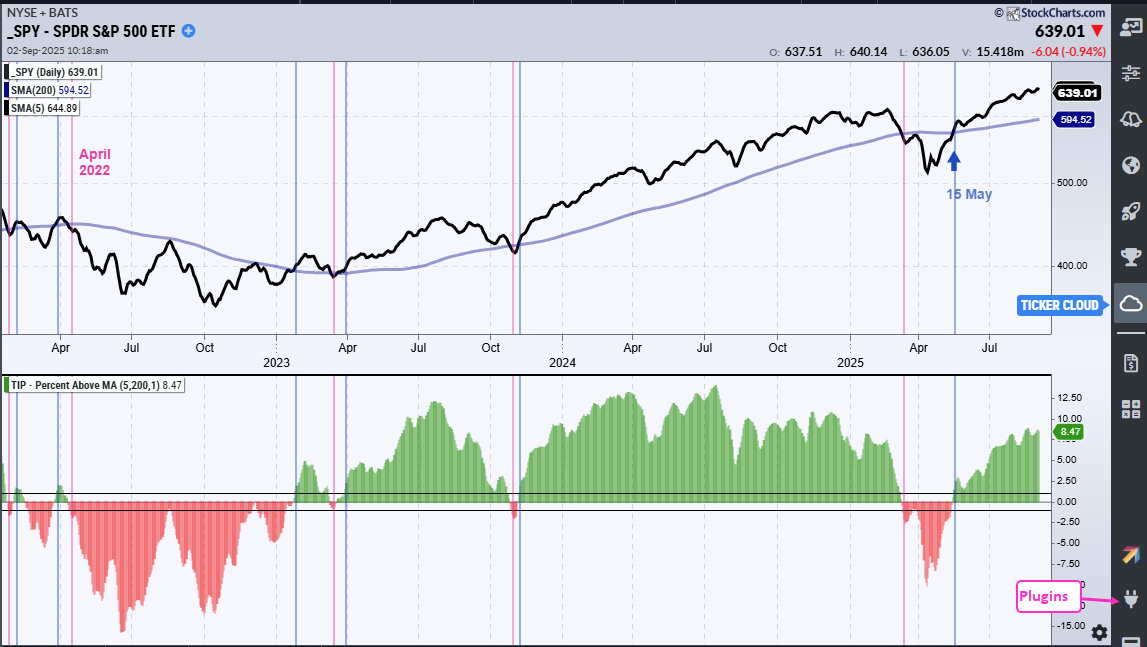
SPY Recorded New All Time High in late August
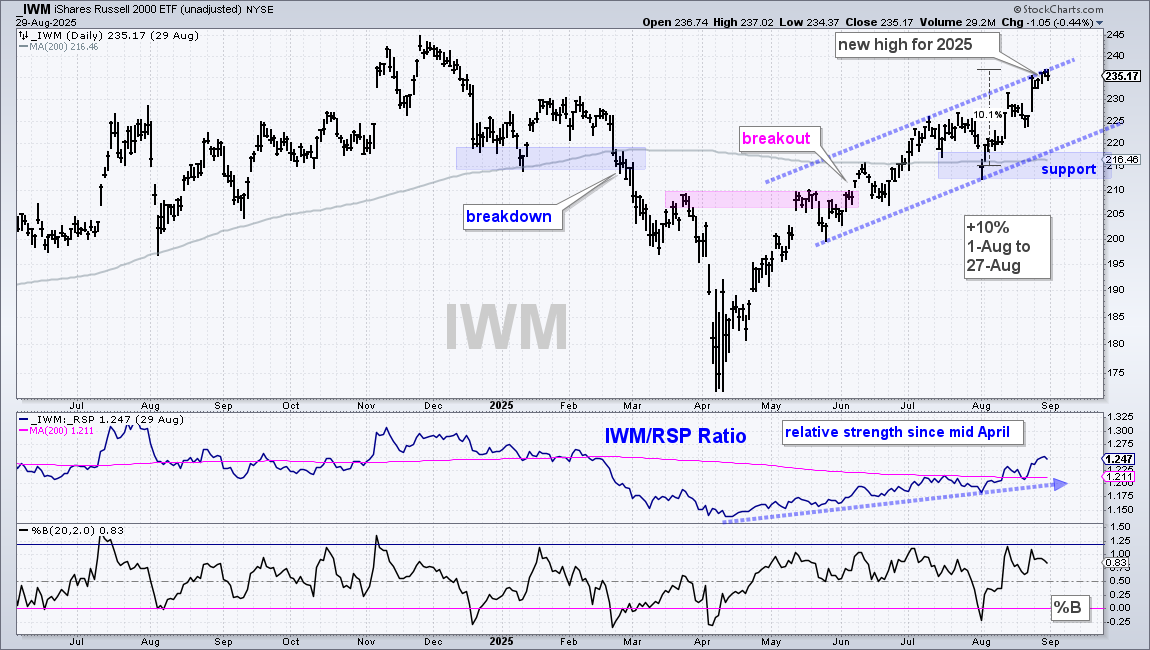
IWM Hit Highest Level of the Year in Late August
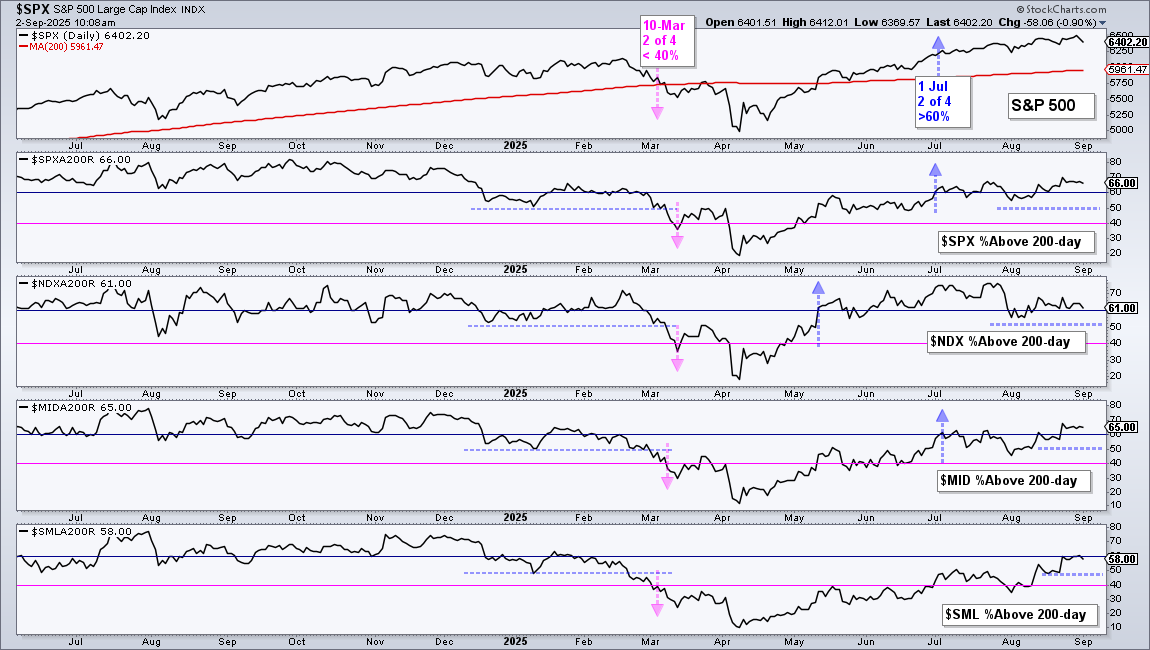
Over 60% of Stocks above their 200-day SMAs
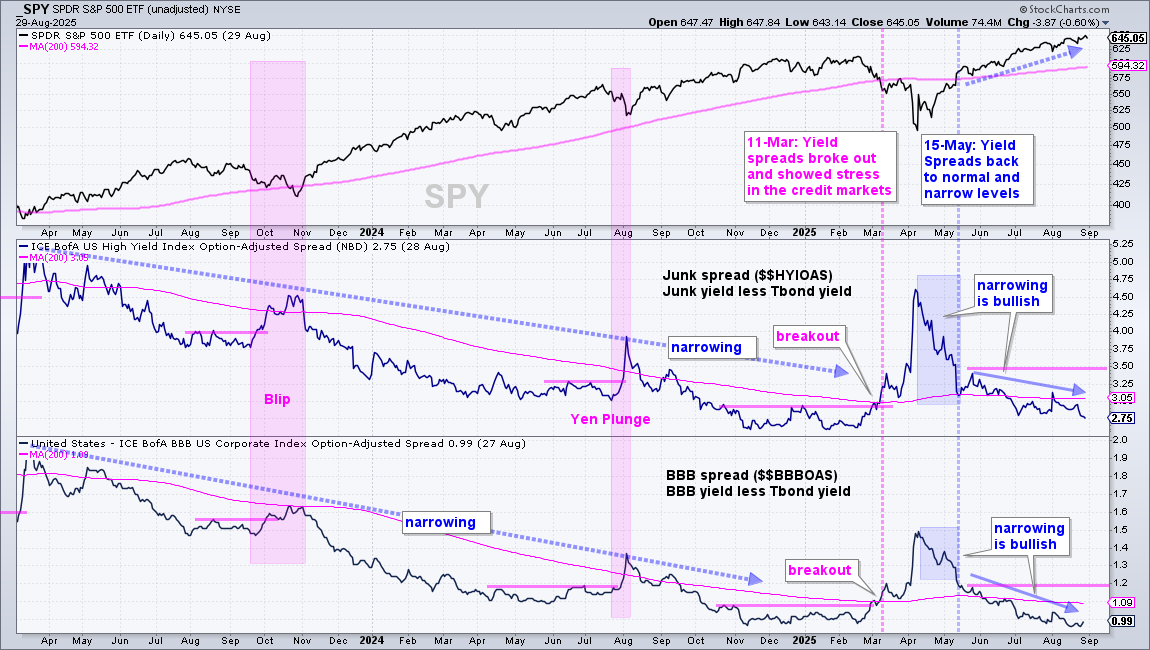
Yield Spreads Are Narrow and Show Confidence
10 year Yield Falling since late May (lower rates)
3 month Bill Yield Fell Sharply in August (Fed Cut)
The next report/video will be on Wednesday, September 3rd.
Even though stocks are ripe for a corrective period, the weight of the evidence supports a bull market. SPY is in a leading uptrend, 60+ percent of stocks are above their 200-day SMAs and yield spreads are narrow. In addition, short-term rates are falling, which suggests a dovish Fed. Any pullback at this stage would be considered a correction within the bull market, which could lead to an opportunity. See this report for the prospects of a shaky September.[1]
SPY Recorded New All Time High in late August
The chart below shows SPY as a 5-day SMA (black line) and 200-day SMA (light blue line). SPY hit a new high in late August, as did the 5-day SMA. Moreover, the 5-day SMA is over 8% above the 200-day SMA. Thus, the long-term trend is clearly up for the most important benchmark for US stocks. For reference, the indicator window shows the percentage difference between the 5 and 200 day SMAs.
IWM Hits Highest Level of the Year in Late August
The next chart shows the Russell 2000 ETF (IWM) hitting its highest level of 2025 in late August. IWM is still below the November high, but in an uptrend since the early June breakout. Long-term support is set using the August 1st low (212). The middle window shows the price-relative (IWM/RSP ratio) rising since late April, which means IWM is leading the market for over four months. However, IWM remains a long-term laggard because the price-relative is well below its November peak.
Over 60% of Stocks above the 200-day SMAs
Over 60% of S&P 500, Nasdaq 100 and S&P MidCap 400 stocks are above their 200-day SMAs. This means the vast majority of stocks are in long-term uptrends. These numbers support a bull market. I would begin to question strength should these move below 50% (blue dashed lines). Note that SML %Above 200-day SMA ($SMLA200R) is the weakest of the group as it fell back below 60% on Monday.
Yield Spreads Are Narrow and Show Confidence
The next chart shows the Junk and BBB yield spreads. These spreads narrowed sharply from early April to mid May as confidence returned to the credit markets (blue shading). This confidence continues as both spreads narrowed further into late August. Sharp upturns and breakouts would argue for a reassessment.
3 month Bill Yield Fell Sharply in August (Fed Cut)
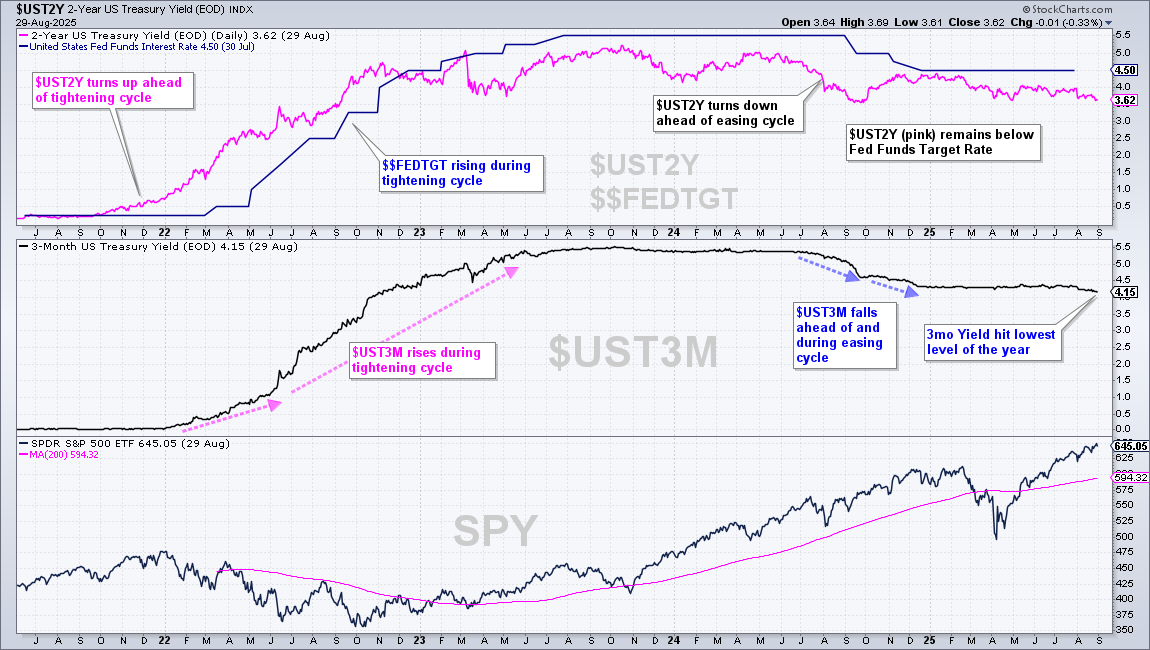
The next chart shows the 3-month Treasury Yield ($UST3M) moving lower in August and hitting its lowest level of the year. This short-term yield often precedes the Fed and the move lower points to a Fed cut in September.
10 year Yield Falling since late May (lower rates)
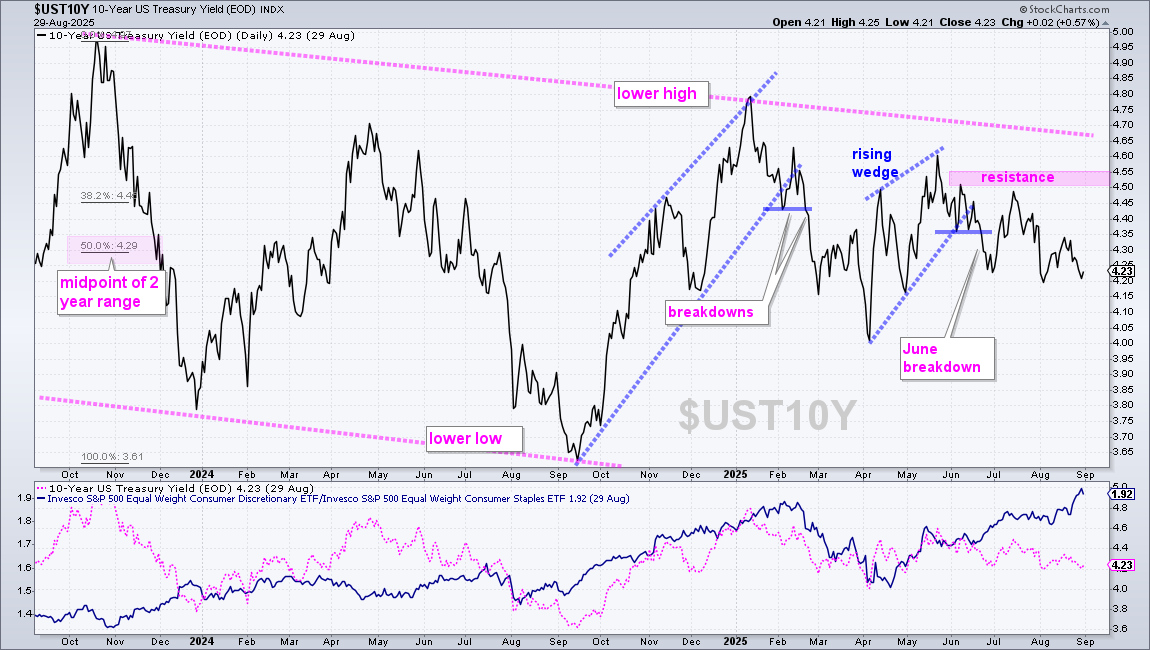
The next chart shows the 10-yr Treasury Yield ($UST10Y) breaking down in mid June and moving lower into August. Even though the decline is not that strong, this key yield is moving lower. Note that yields move lower when economic growth softens and/or inflationary pressures subside. The former is the negative reason, while the latter is the positive reason.
DISCLAIMER: This content provided strictly for informational and educational purposes. It should not be interpreted as an offer to buy or sell any security, nor as a solicitation to engage in any investment activity. Nothing here constitutes a recommendation regarding any specific security, portfolio, transaction, or investment strategy.
At times, the author or affiliates may hold positions or interests in securities discussed. Any stocks or examples mentioned are not endorsements or suggestions to purchase. This material does not consider your individual financial goals or circumstances, and you should seek guidance from a qualified financial or investment adviser before making any trading or investment decisions.
Past performance does not guarantee future results.
Send feedback to support(at)trendinvestorpro.com or use the contact form. [2]