Big Four Hold the Key
Stocks moved sharply higher on Friday with small-caps and mid-caps leading the charge. Friday’s big advance is not the first big move for these two groups. They also moved sharply higher on August 12th and 13th. August is shaping up to be a big month for small-caps and mid-caps.
This report focuses on the big four: SPY, QQQ, the S&P MidCap 400 ETF (IJH) and the S&P SmallCap 600 SPDR (IJR). These four capture the entire market: large-caps, large-cap tech stocks, mid-caps and small-caps.
The stock market is in good shape when these four are in long-term uptrends – and all four are in long-term uptrends. This means stocks are in a risk-on environment and traders should look for bullish setups. These include short-term oversold conditions, pullbacks within uptrends and bullish continuation patterns. These will be featured on Tuesday.
SPY and QQQ turned long-term bullish with their May breakouts. IJH and IJR broke out later and have yet to record new highs. New highs, however, are expected as long as these two remain in long-term uptrends. The overall stock market is also in good shape as long as these two trend higher. It is, therefore, important to monitor the uptrends in IJH and IJR.
SPY and QQQ are Still Leading Long-term
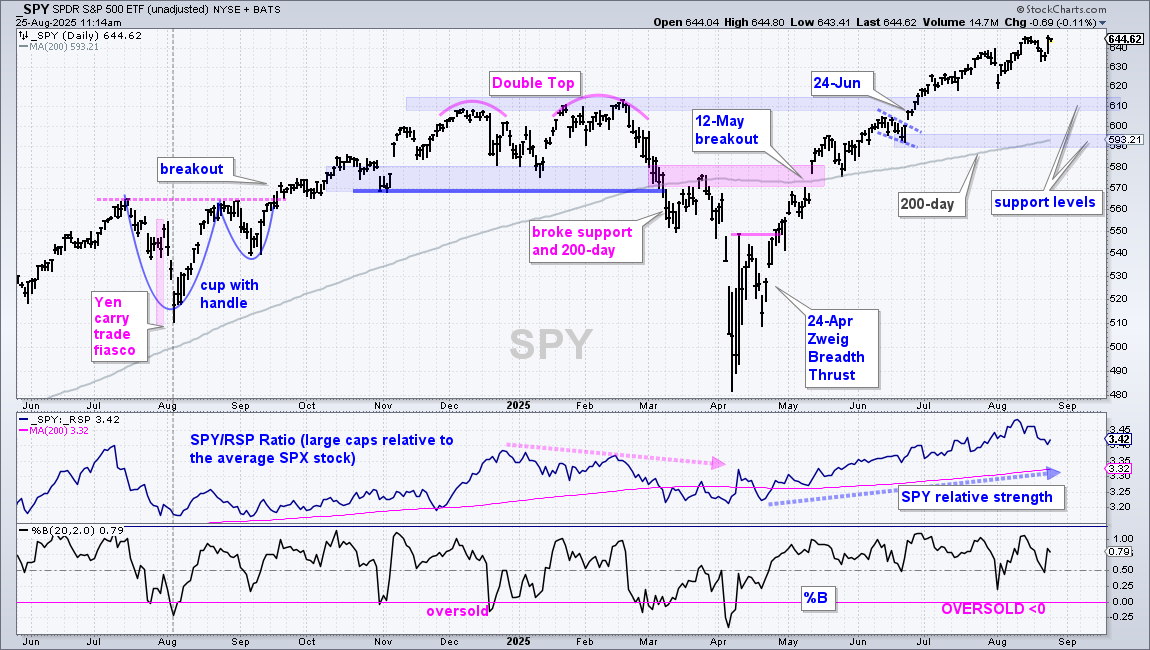
SPY and QQQ are leading with bullish trend signals in mid May and new highs in August. The chart below shows SPY surging to its first new highs in late June and workings its way higher the last two months. I do not see a setup on this chart, such as an oversold condition or short-term bullish pattern. The breakout zone in the 610 area turns first support, should we see a pullback. Further down, the rising 200-day SMA marks support at 593 – and this average will rise as long as SPY stays strong.
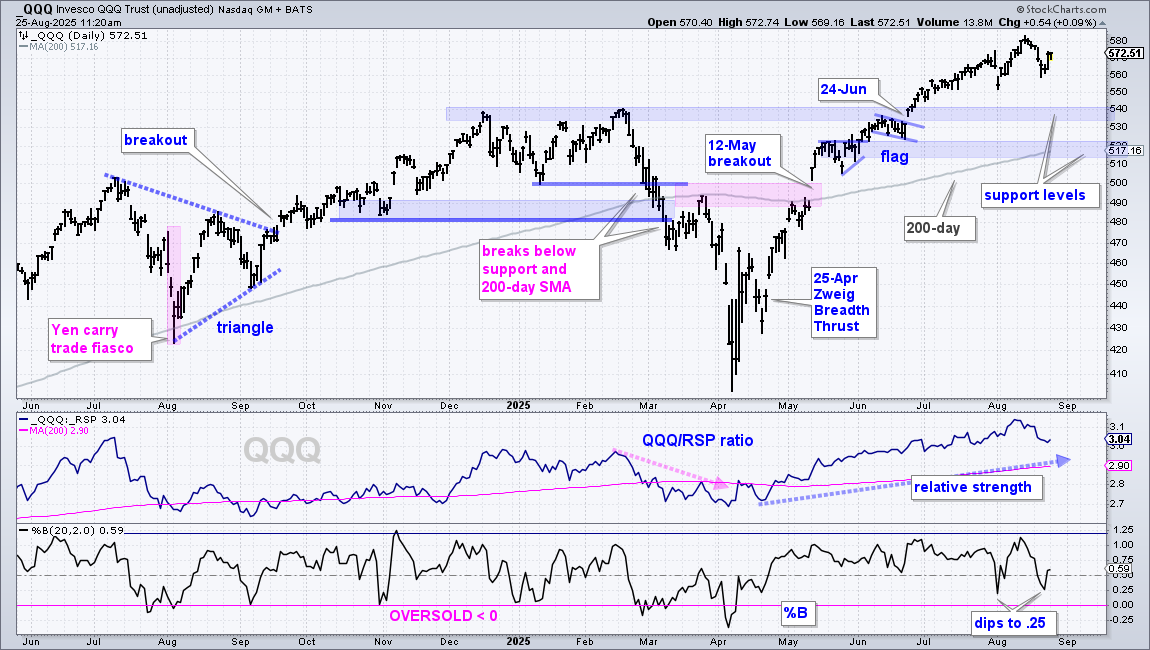
The next chart shows QQQ with similar characteristics. QQQ pulled back with a dip from 585 to 560 last week, but did not become oversold because %B did not dip to zero. %B was, however, modestly oversold with dips to .25 on August 1st and August 21st. I do not see a flag, pennant or short-term bullish patterns, but sometimes the market does not give us the perfect setup (flag/pennant and %B < 0). As with the August 1st dip, QQQ dipped lower last week and reversed this downswing with a surge on Friday.
Mid-cap ETF Breaks out of Consolidation
The next chart shows the S&P MidCap 400 ETF (IJH) with a breakout on June 26th, over a month after the breakout in SPY. A breakout, nevertheless, is a breakout, and bullish until proven otherwise. IJH consolidated above the breakout zone with a rather choppy range (blue oval). A consolidation above the breakout zone means the breakout was holding. The ETF broke out with a surge on Friday and this signals a continuation higher. Support is based on the July-August lows and 200-day SMA (blue shading). While we could see more choppy trading in the 62-66 area, the bulls have the edge as long as 61 holds.
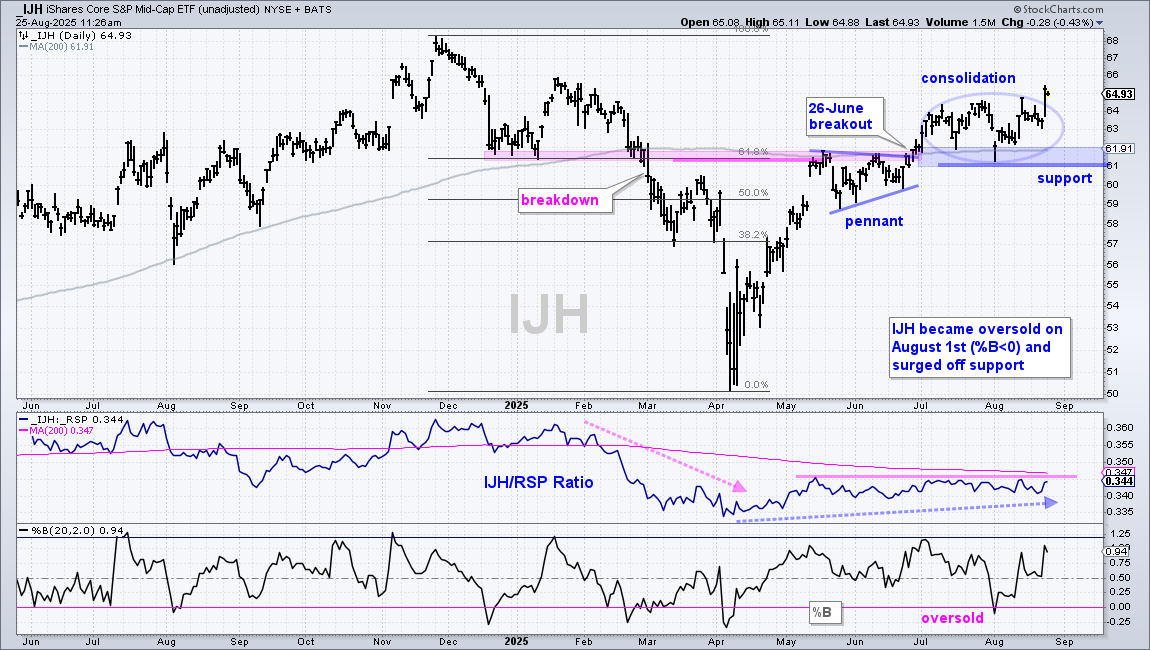
The lower window shows the IJH/RSP ratio falling in February-March and then turning up from early April to mid May (relative weakness and then relative strength). This ratio has been flat since mid May, which means mid-caps are performing inline with the average S&P 500 stock. A break above the 200-day SMA would show mid-caps outperforming.
Small-caps Start Showing Relative Strength
The next chart shows the S&P SmallCap 600 SPDR (IJR) with a breakout on June 9th and a choppy advance since this breakout. After a pullback/consolidation in July and oversold condition on August 1st, the ETF surged above the July high in mid August. There was a short six day pullback into last week and another big surge on Friday. IJR was in an uptrend and is extending on this uptrend. The July-August lows mark support in the 107-110 area.
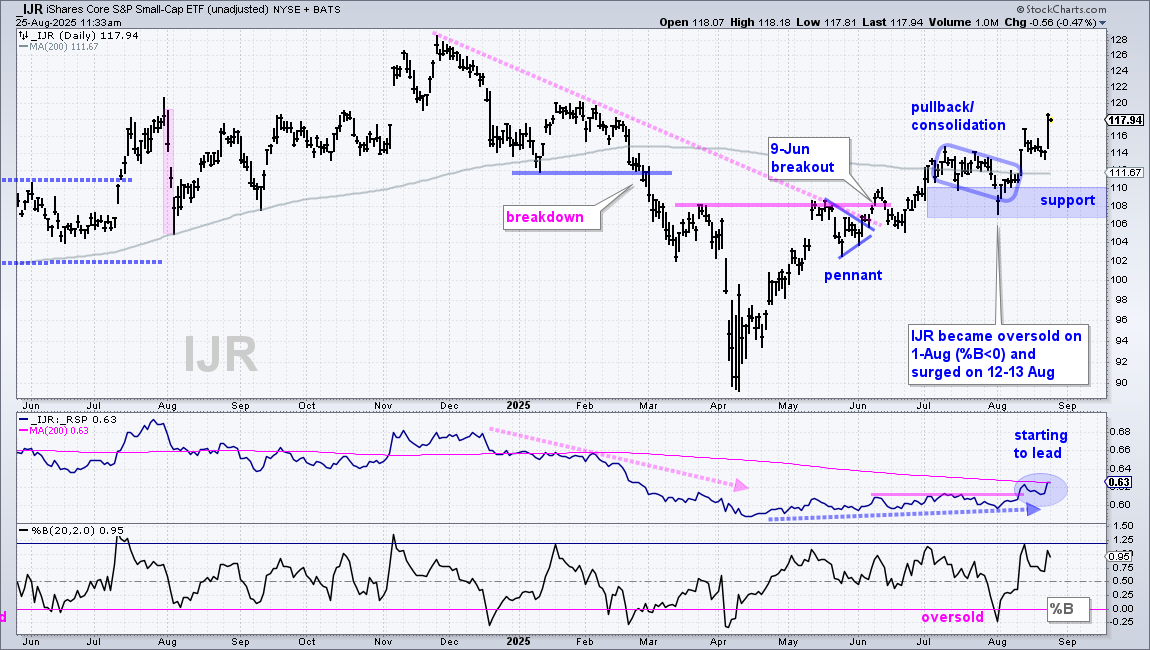
The middle window shows the IJR/RSP ratio falling from mid December to mid April as IJR underperformed. This ratio started to rise in May, but the rise was ever so slight. Even so, the ratio broke out in mid August and is currently testing its 200-day SMA. IJR is starting to outperform the broader market and this is positive for small-caps.
Send feedback to support(at)trendinvestorpro.com or use the contact form. [1]