Correction/Rotation – XLK Weighs on SPY – Defensive ETFs Breaking Out
Posted By
Arthur Hill, CMT
On
In
Archive |
No Comments
Headlines
Correction and Rotation Underway
As XLK Goes, So Go the Tech ETFs
XLC Remains in Beast Mode
Defensive ETFs Breaking Out (XLP, IHI, KIE)
XLU Continues to Lead the Market
XLV Firms after Long-term Oversold Condition
I will post another report and video before noon ET. (Symbols to be covered: IEF, GLD, GDX, SLV, DBB IBIT)
Correction and Rotation Underway
There is a correction underway with tech stocks weighing on the broader market, especially SPY and QQQ. The Technology sector accounts for a whopping 33.72% of SPY and the S&P 500. Financials are a distant second at 13.67%. We then have Consumer Discretionary (10.55%), Healthcare (9.11%) and Industrials (8.50%).
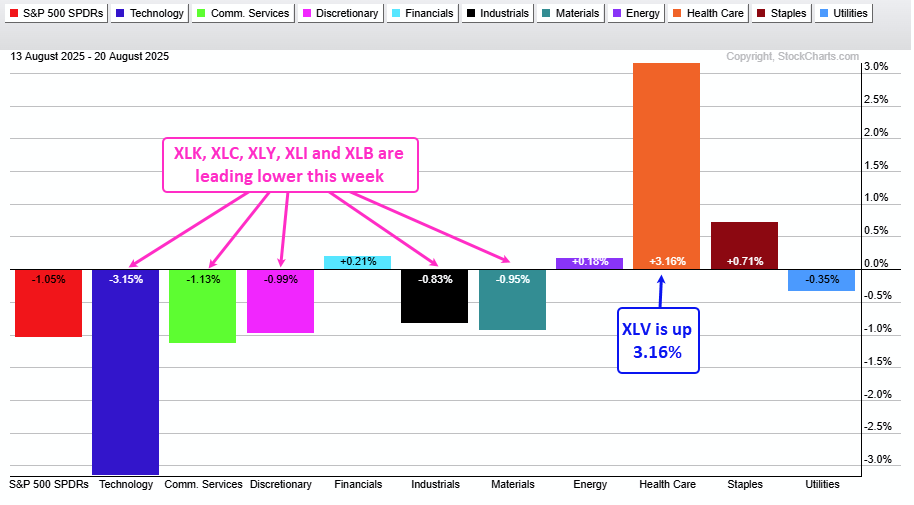
The following PerfCharts show sector performance for the 1 week, 1 month and year-to-date timeframes. The most recent rotation from high beta to defensive is the most pronounced over the last five trading days. XLK is down 3.15%, XLC is down 1.13%, XLY is down .99% and XLI is down .83%. XLF is holding up relatively well this week and XLV is leading the way with a 3.16% gain.
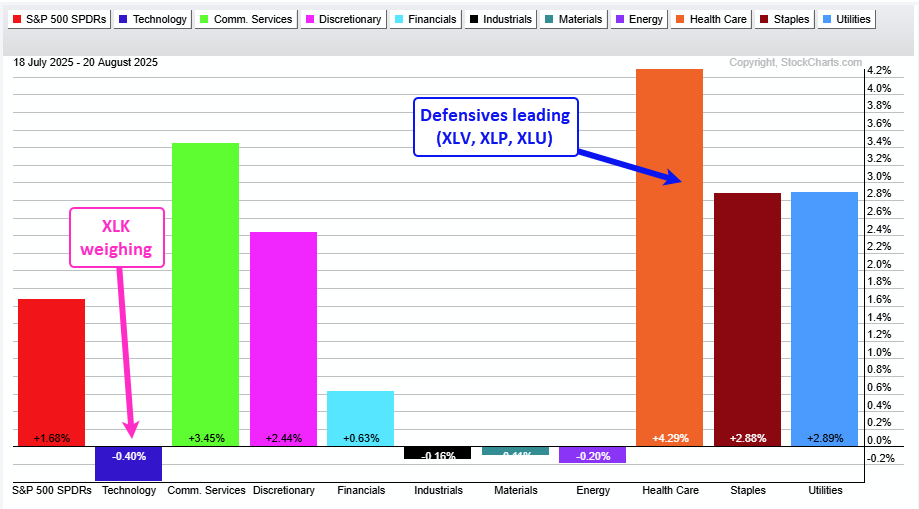
The next chart shows 1 month performance with XLK (-.40%) weighing on the broader market. XLF is underperforming (+.63%). XLI, XLB and XLE are down a fraction. On the far right, the defensive sectors are leading with strong gains in XLV, XLP and XLU. The rotation away from tech started with money moving into the defensive sectors.
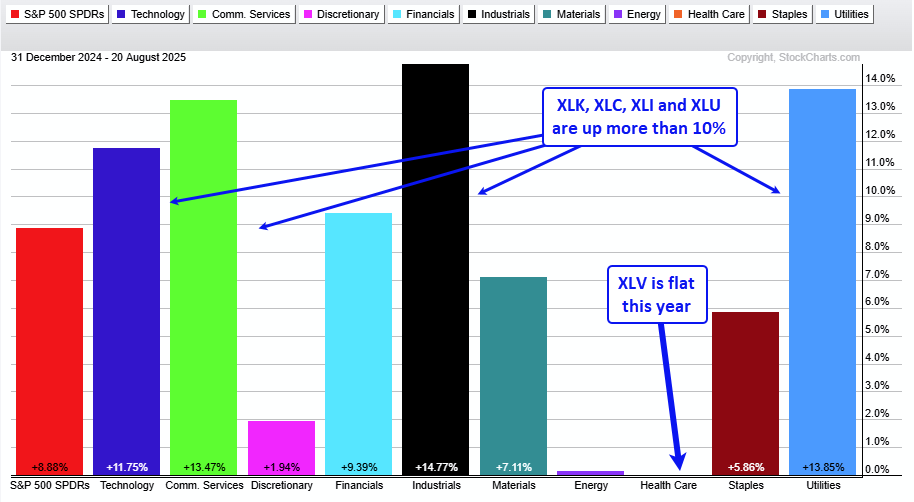
The next chart shows year-to-date performance for the sectors. Despite a 3.16% gain the last five days, the Healthcare SPDR (XLV) is still the weakest sector year-to-date. XLV is down .05% year-to-date and XLE is up .15%. The four leading sectors are up more than 10% this year: XLK, XLC, XLI and XLU. Pretty impressive to see XLU up more than XLK and XLC.
As XLK Goes, So Go the Tech ETFs
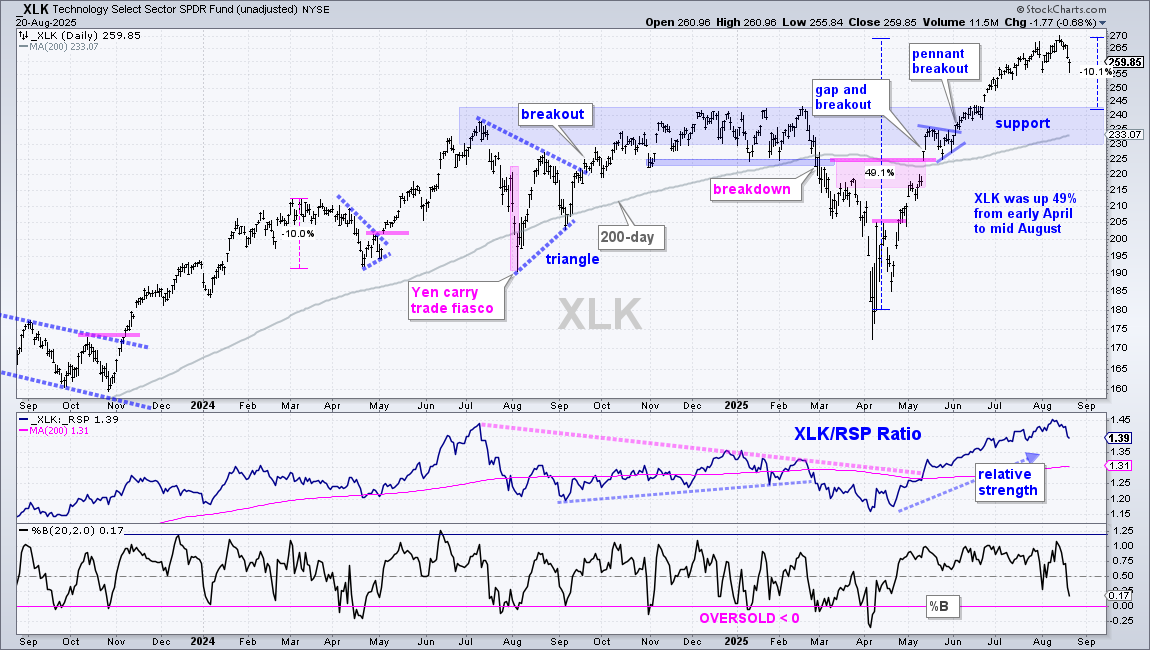
The Technology SPDR (XLK) remains in a long-term uptrend with a new high in mid August and price well above the rising 200-day SMA. Short-term, the ETF fell to its early August low with an intraday low of 255.84 on Wednesday. This low marks short-term support and XLK was short-term oversold near 256. When I say short-term, I am talking VERY short-term. In fact, this is too short-term for my trading style. At this stage, I think XLK has entered a corrective period that will retrace a portion of the prior advance, which was 49%. A normal 10% pullback would extend to the 240s and reach the top of the support zone (blue shading). Broken resistance and the rising 200-day SMA mark this future support zone.
Even though I am marking future support, there is no guarantee that XLK will get there and no guarantee that this level will mark support. At this stage, XLK is correcting within a long-term uptrend. This means there will likely be a trading setup down the road. It is time to exercise some patience and wait for that setup to emerge. Personally, I am looking for oversold conditions, a signs of firming and a tradable pattern.
Should XLK correct, I would expect the other tech-related ETFs to correct. One or two may buck the correction, but most are positively correlated to sector performance (MAGS, AIQ, ARTY, CLOU, SKYY, CIBR, ARKF, ARKK, SMH, SOXX, IGV).
XLC Remains in Beast Mode
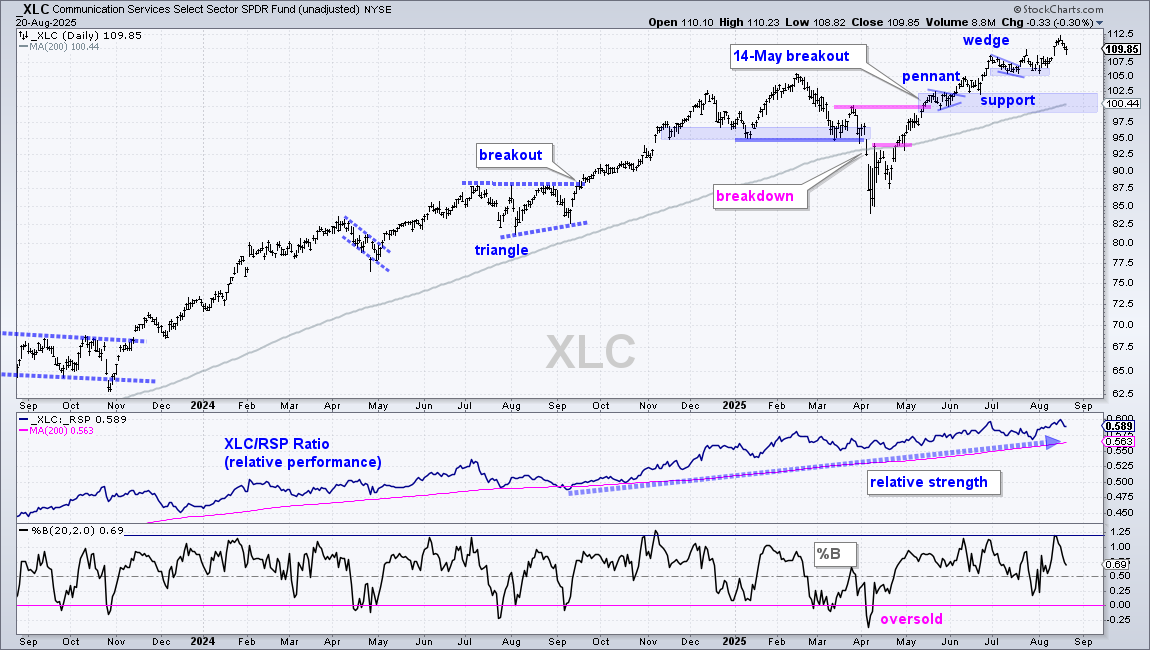
The Communication Services SPDR (XLC) remains in beast mode with a new high last week and a short pullback this week. The last pattern was a very small falling wedge into July and a breakout in mid July. XLC fell back after the breakout, but held support in the 105 area and moved above 110. Long-term, I am marking support in the 99-102 area. This zone stems from the mid May breakout, the May-June pennant and the rising 200-day SMA.
Even though Alphabet is its top holding, the Communication Services SPDR (XLC) is not a tech ETF. Note that GOOGL and META account for almost 40% of the ETF. Top holdings include GOOGL (19.72%), META (18.81%), NFLX (7.84%), EA (4.93%), TMUS (4.77%), VZ (4.38%), T (4.36%), TTWO (4.15%) and DIS (4.15%). Outside of the two hyperscalers, we have video games (EA, TTWO), Streaming (NFLX, DIS) and Telecom (T,VS,TMUS).
Defensive ETFs Breaking Out (XLP, IHI, KIE)
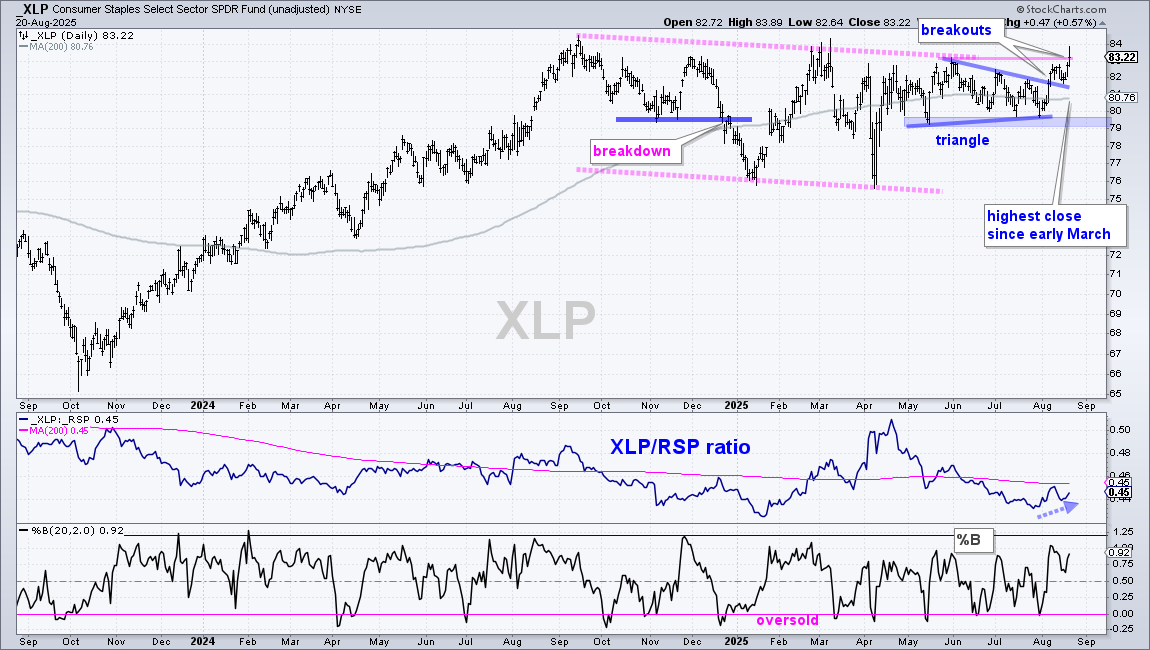
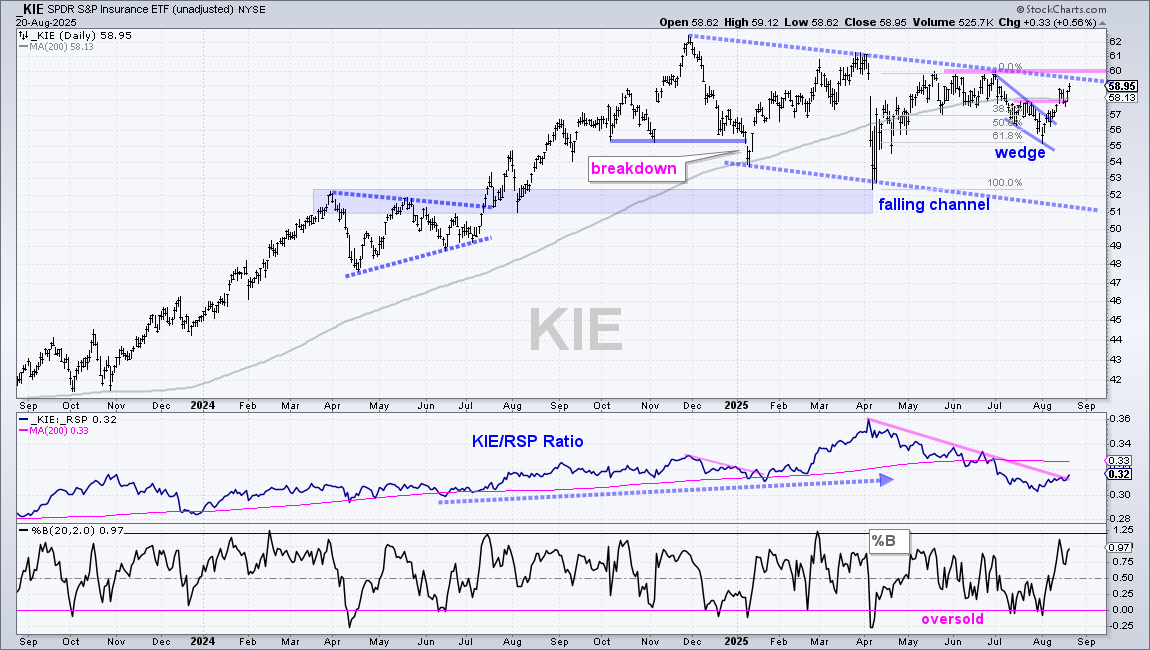
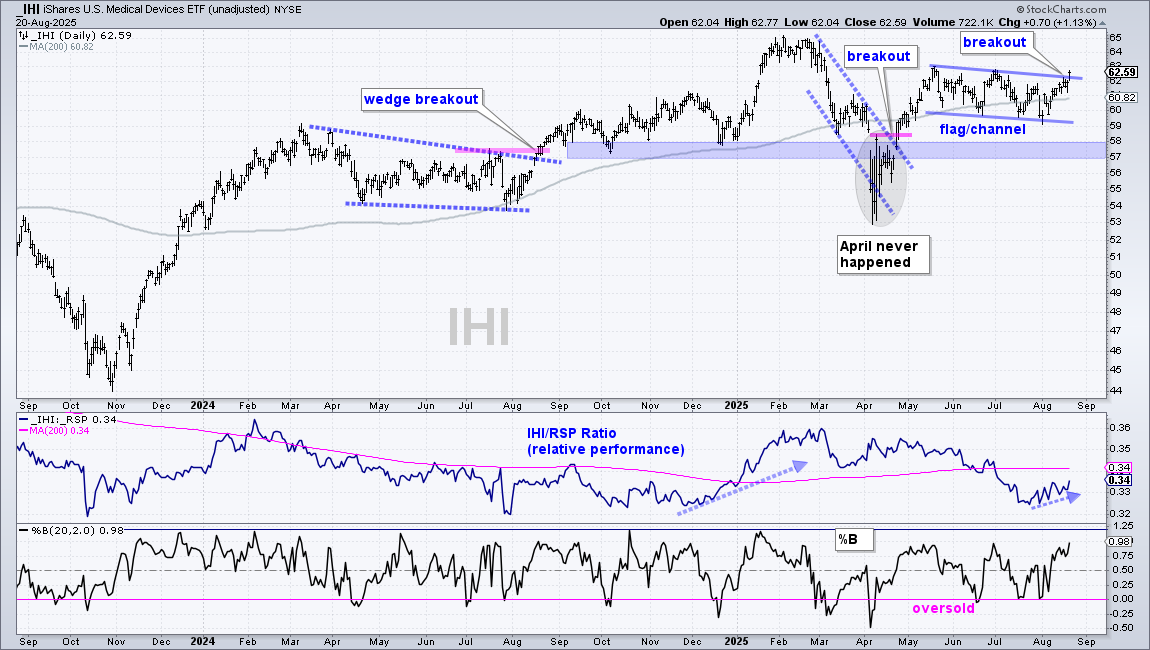
The defensive ETFs perked up in August with the Consumer Staples SPDR (XLP), Medical Devices ETF (IHI) and Insurance ETF (KIE) breaking out of patterns. These are not the most exciting ETFs, but they do offer relative stability when the seas turn choppy. Money moving into these groups reflects a preference for defense over offense.
The first chart shows XLP with a breakdown in late December and downtrend into early August. On a closing basis, the ETF broke the June high and this forged the first higher high (uptrend). Short-term, XLP formed a triangle from May to August and broke out with a surge in early August. I am marking re-evaluation support at 79.
The next chart shows the Insurance ETF (KIE) breaking out of a falling wedge and moving above its 200-day SMA. Overall, KIE is still in a downtrend with lower lows and lower highs since the January breakdown. Technically, a break above the June high (60) is needed to signal the start of an uptrend. Short-term, KIE advanced from 52 to 60, corrected with a falling wedge that retraced 61.8% and broke out of this wedge with a surge above 58. This wedge breakout signals a continuation of the April-May advance and increases the odds for a bigger breakout at 60.
The Medical Devices ETF (IHI) is a real snoozer with a very lethargic uptrend. Nevertheless, an uptrend is an uptrend. IHI is above the rising 200-day SMA and just 4% from its 52-week high. Short-term, IHI surged with the market off the April low with a move from 53 to 63. The ETF then worked its way lower with a falling flag/channel from mid May to mid August. Note that money was moving into high-beta stocks during this period. The flag/channel is a correction after the April-May surge. Thus, the breakout signals an end to this correction and a resumption higher. I am marking long-term support in the 57-58 area for now.
XLU Continues to Lead the Market
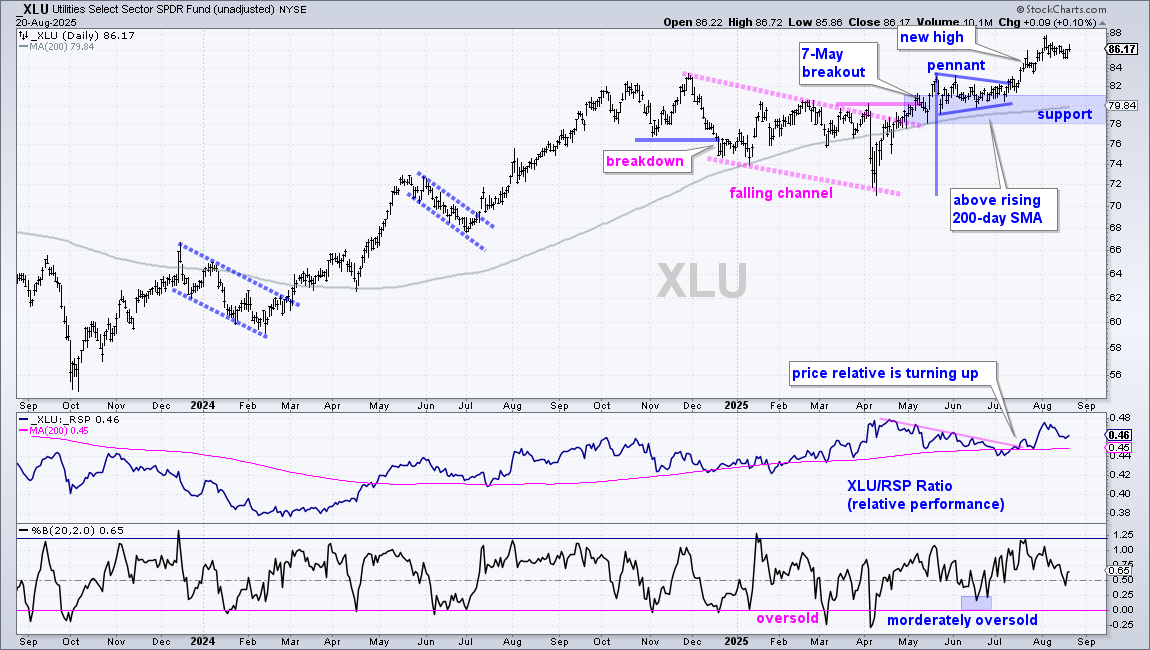
The Utilities SPDR (XLU) was already leading with a trend-reversing breakout on May 7th, a pennant breakout in mid July and new highs in early August. I do not see a tradable pattern on this chart, just a leading uptrend. The pennant lows and rising 200-day SMA mark long-term support in the 78-80 area. The middle window shows the price-relative turning up in mid July and moving above its rising 200-day SMA. This means XLU is outperforming the broader market.
XLV Firms after Long-term Oversold Condition
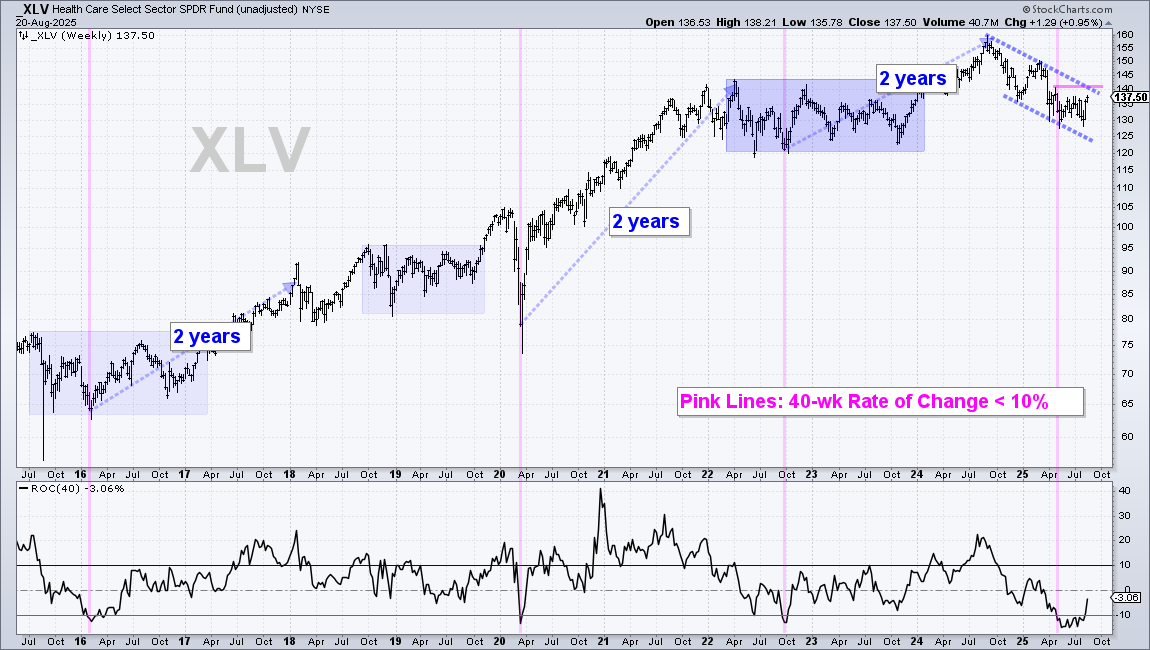
The Healthcare SPDR (XLV) is the weakest sector year-to-date and also one of the weakest equity ETFs. As noted on July 30th, the ETF became extremely oversold because the 40-week Rate-of-Change was below -10% for the fourth time in 10 years. I consider this long-term oversold because sector ETFs cannot go to zero, whereas individual stocks can. XLV could certainly go lower, but history points to a rebound in the coming 6 to 24 months. See the blue arrows on the chart. On the weekly chart below, XLV remains within a falling channel with resistance marked at 142. A breakout here would reverse the 12 month downtrend.
Send feedback to support(at)trendinvestorpro.com or use the contact form. [1]