Utes, Infrastructure and Telecom Lead – Gold is Stuck – Bitcoin Returns to Breakout
Posted By
Arthur Hill, CMT
On
In
Archive |
No Comments
Headlines
Utilities SPDR Remains with Strong Chart
Infrastructure ETF Surges to New Highs
Telecom ETF Surges to New High
Gold SPDR Remains Stuck in Bullish Pattern
Gold Miners ETF Stalls Near High
DB Base Metals ETF Maintains Upswing
Bitcoin ETF Falls Back to Flag Breakout
We are seeing leading uptrends in ETFs related to defensive groups: Utilities, Infrastructure and Telecom. All three hit new highs in August and have strong uptrends working. Elsewhere gold is stuck in a trading range with a classic pattern taking shape and Bitcoin returned to the scene of its prior breakout.
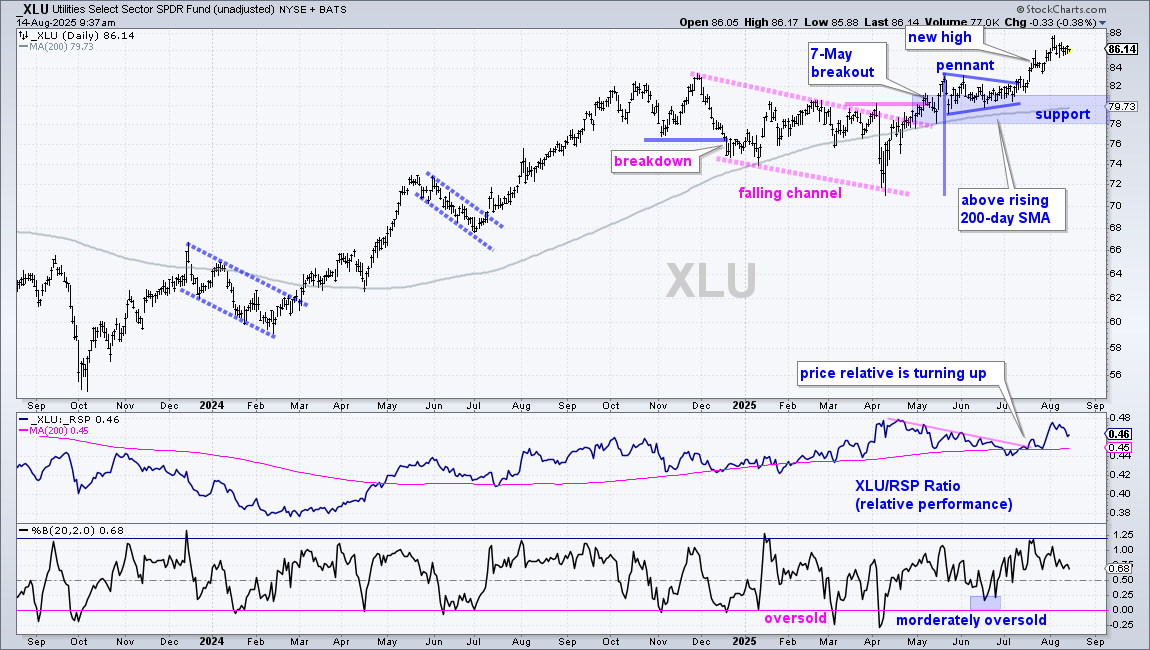
Utilities SPDR Remains with Strong Chart
The Utilities SPDR (XLU) sports one of the strongest price charts because it hit a new high in early August and remains near that high. Overall, the uptrend started when XLU broke out of a falling channel on May 7th. The ETF then consolidated with a pennant into early July, broke out in mid July and extended to new highs. I do not see a setup on this chart because XLU is trading very close to these highs. The pennant lows and rising 200-day SMA mark support in the 78-81 area.
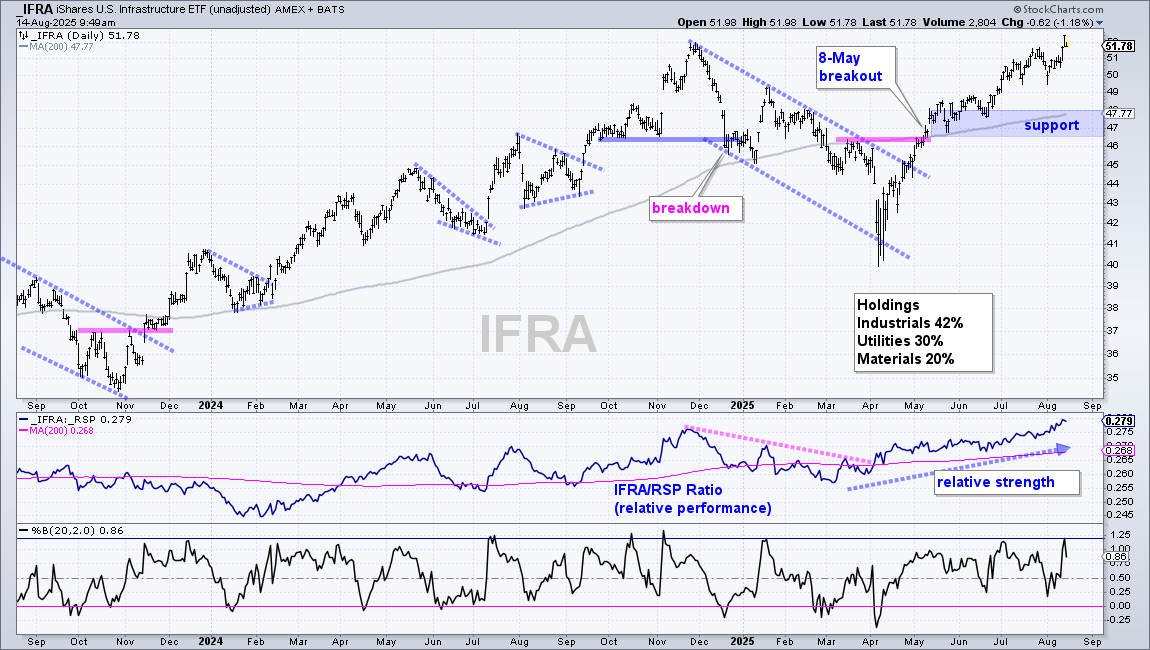
Infrastructure ETF Surges to New Highs
The Infrastructure ETF (IFRA) continues to get a boost from Utilities and Industrials, two of the strongest sectors in the market. IFRA reversed its downtrend with a breakout on May 8th and worked its way higher the last few months. The ETF recorded a 52-week high this week and remains in a strong uptrend. Also notice that the price-relative hit a new high, which means IFRA also shows relative strength. As with XLU, I do not see a tradable setup right now, such as a pullback within the uptrend or short-term oversold conditions.
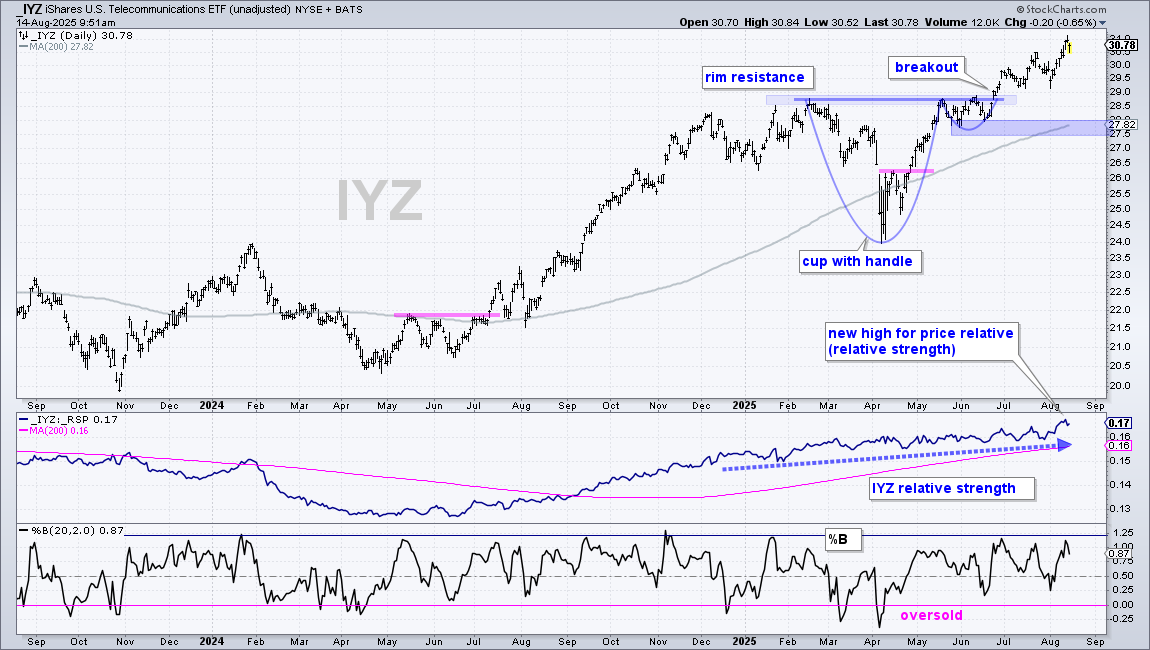
Telecom ETF Surges to New High
The next chart shows the Telecom ETF (IYZ) with a cup-with-handle and a breakout in late June. Cup-with-handles are bullish continuation patterns. The breakout forged a new high, which is also a sign of strength. IYZ extended higher throughout July and also hit a new high this week. IYZ remains a leader with the price-relative hitting a new high. Again, I do not see a setup on this chart, just a leading uptrend. Support is marked in the 27.5-28 area.
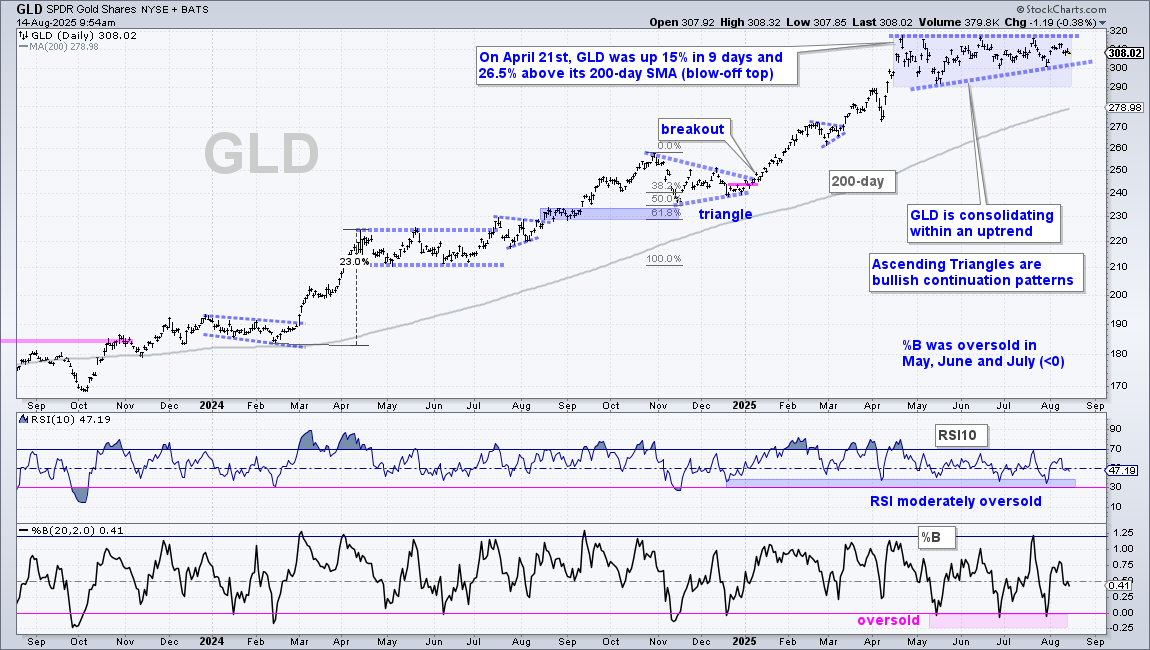
Gold SPDR Remains Stuck in Bullish Pattern
There is no change in the Gold SPDR (GLD). The long-term trend is up with a new high in April. Medium-term, the ETF moved into a trading range with an Ascending Triangle forming. This is a bullish continuation pattern that represents a rest within the uptrend. A breakout at 320 would be bullish. There are price swings within the pattern, but these swings are getting shorter and shorter as the range narrows. A break below 300 would negate the Ascending Triangle, but this would not be a bearish development because it would not affect the long-term uptrend. Instead, a pullback would likely lead to the next oversold setup.
Gold Miners ETF Stalls Near High
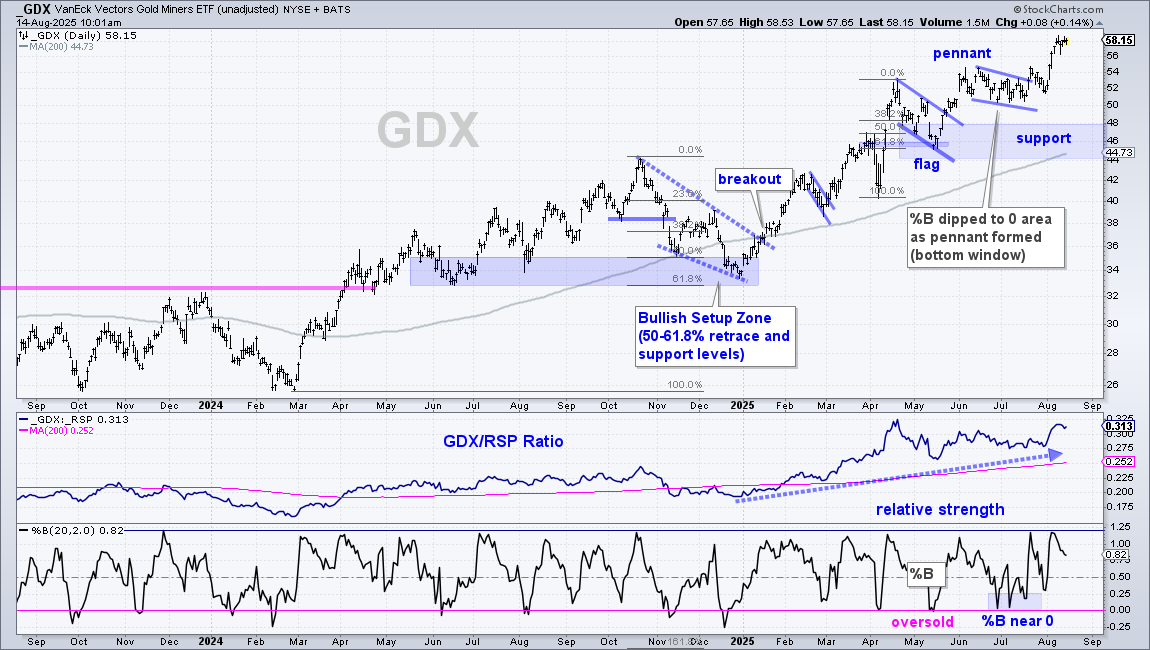
The Gold Miners ETF (GDX) remains in a leading uptrend with a new high in early August. However, this new high occurred after a 13% surge in five days (52 to 58). Even though sharp advances and new highs are a sign of strength, they also create short-term overbought conditions that can foreshadow a rest. GDX is in a leading uptrend, but I do not see a setup and the ETF looks vulnerable to a pullback, which could lead to the next oversold setup.
DB Base Metals ETF Maintains Upswing
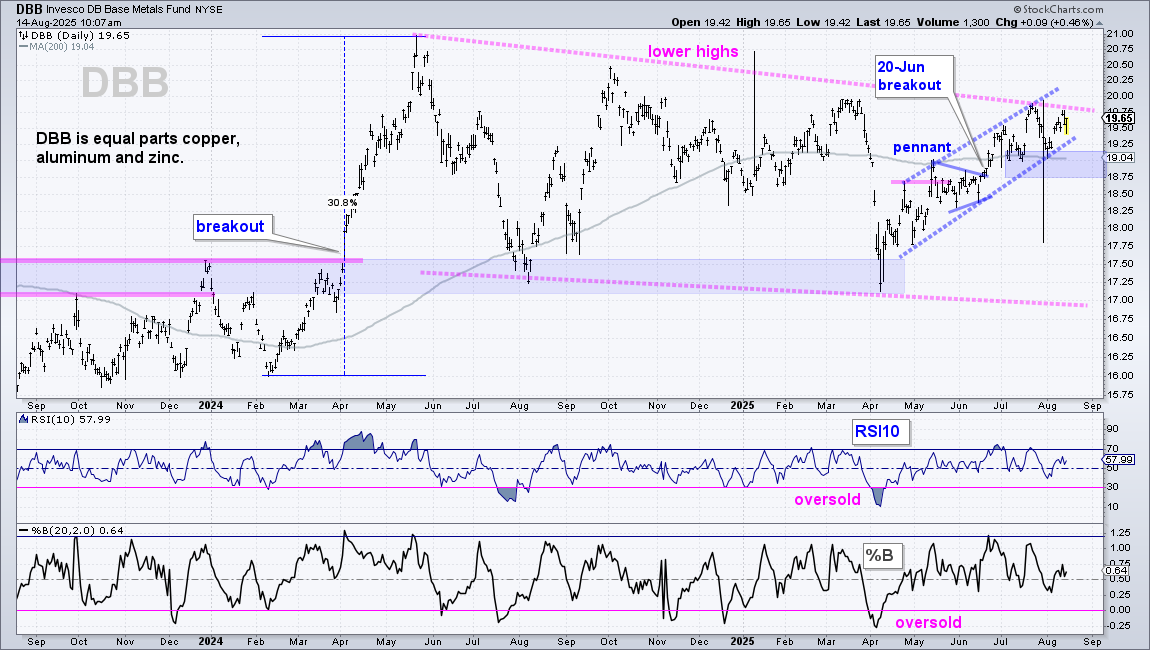
The DB Base Metals ETF (DBB) remains within a long-term downtrend (pink lines), but a medium-term upswing (blue dashed lines). I am focused on the upswing since the breakout on June 20th. The July-August lows, channel trendline and a buffer mark a support zone in the 18.75-19 area. The bulls have the edge as long as this level holds and a breakout at 20 would be most positive. Failure below 20 and a break below 18.75 would reverse the medium-term upswing.
Bitcoin ETF Falls Back to Flag Breakout
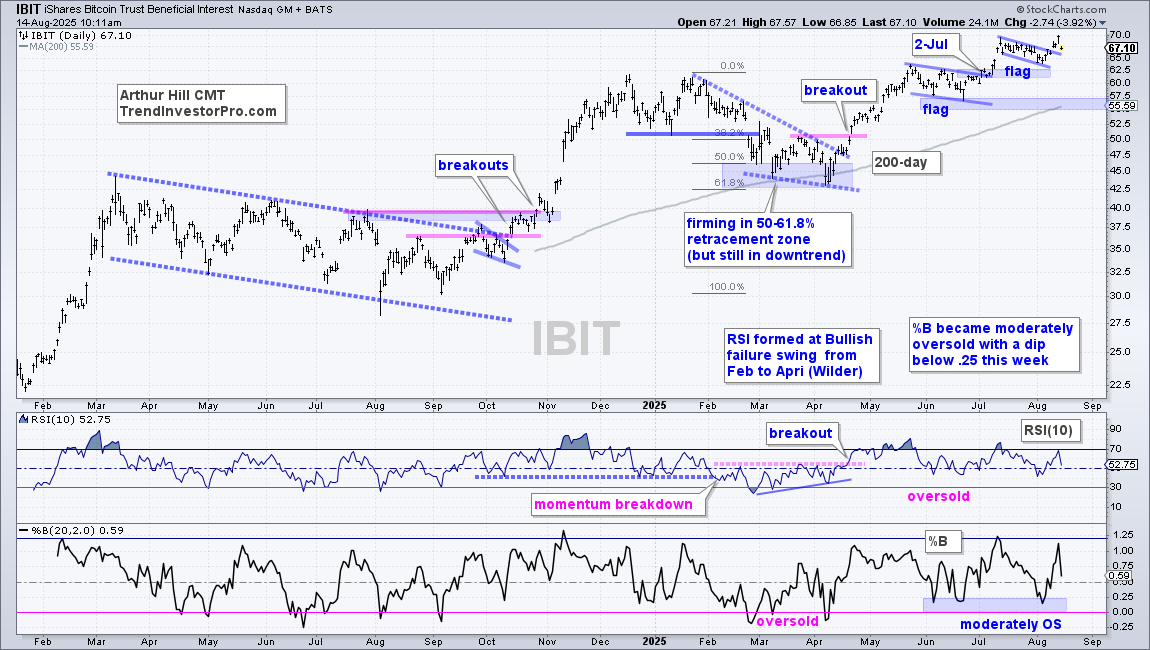
The Bitcoin ETF (IBIT) remains in a long-term uptrend with a new high in mid August and price well above the rising 200-day SMA. Long-term support is based on the June lows and rising 200-day SMA in the 55-57 area. Short-term, IBIT formed a falling flag from mid July to mid August and broke out with a surge on Monday. The ETF popped on Wednesday with a 2.78% gain, but gave it back with a weak open on Thursday (-3.92% at 10:15 AM). IBIT is trading back near the flag breakout and this zone (~67) marks short-term support (very short-term). A move below 65 would negate the flag breakout and it would then be back to the waiting game (waiting for the next setup).
Send feedback to support(at)trendinvestorpro.com or use the contact form. [1]