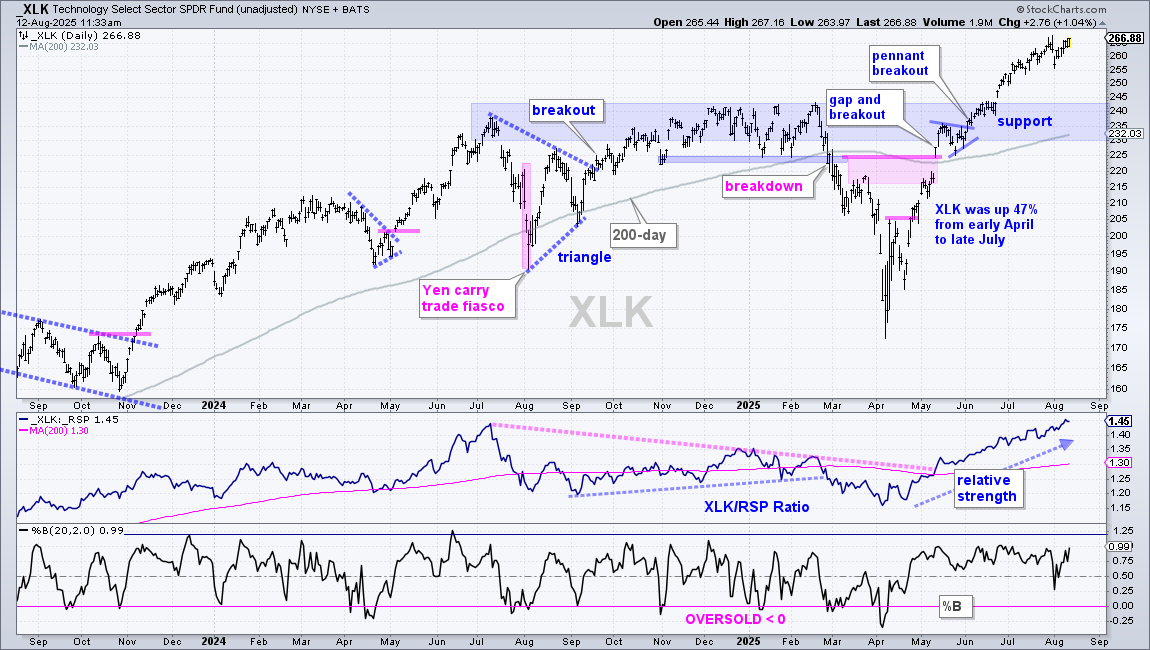
The chart below shows the Technology SPDR (XLK) breaking out to new highs in late June and extending higher into August. There was a sharp one day decline on August 1st, but XLK immediately rebounded with a move back to the late July highs. I do not see a setup on this chart, simply a leading uptrend. Broken resistance and the rising 200-day combine to mark support in the 230-243 aera. The middle window confirms relative strength as the price-relative (XLK/RSP ratio) hit a new high in August.
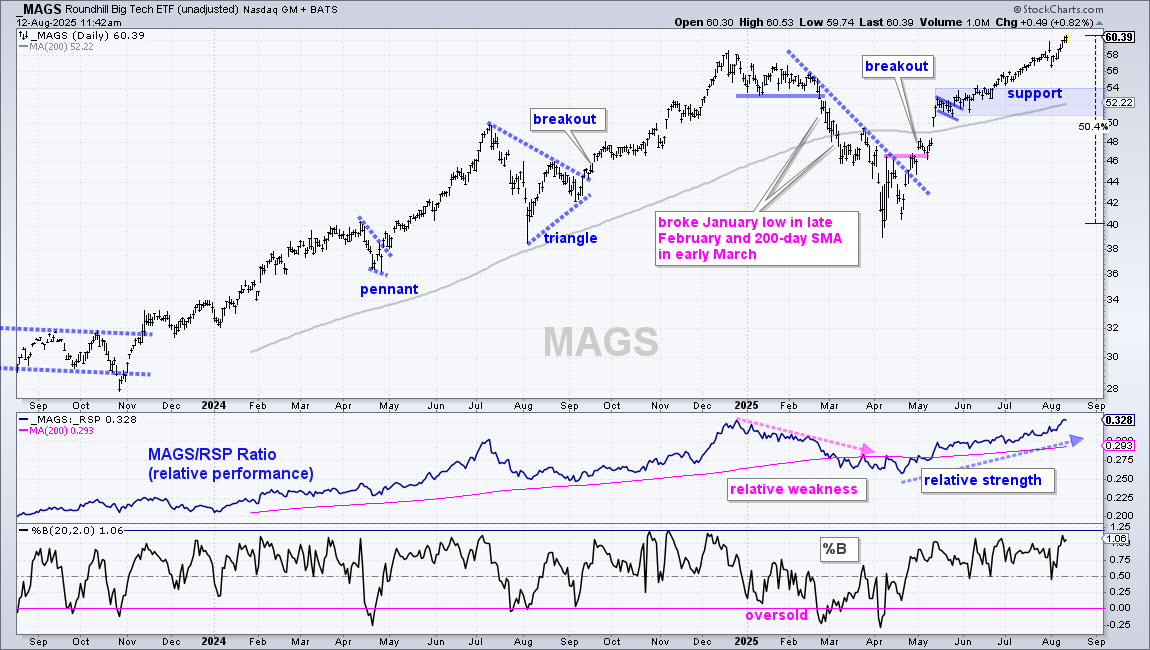
The next chart shows the Mag7 ETF (MAGS) with a 50% advance off the April lows. A 50% move in four months qualifies as overbought, but overbought does not qualify as bearish. ETFs and stocks can become overbought and remain overbought as trends extend. There is no setup on this chart of the steep advance since June. I am marking support in the 50-54 area.
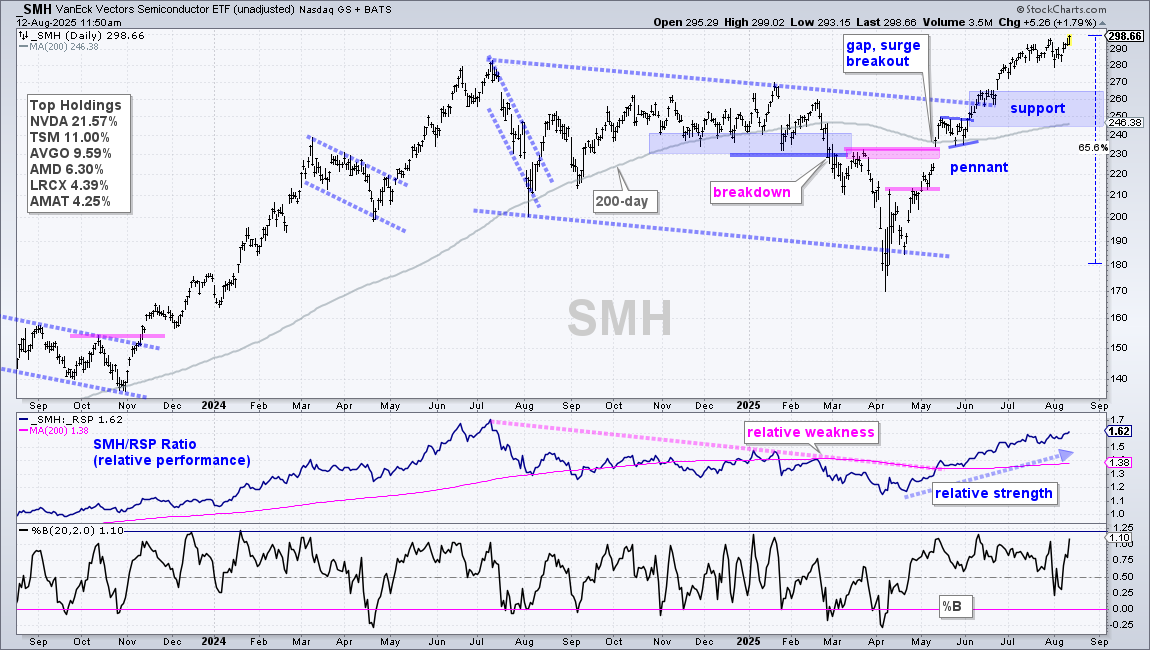
The next chart shows the Semiconductor ETF (SMH) with a 65% advance off the April lows. Note that these three ETFs have one stocks in common: NVDA. Nvidia accounts for 16.15% of MAGS, 16.28% of XLK and 22.57% of SMH. SMH remains in a strong uptrend with support marked in the 243-263 area.
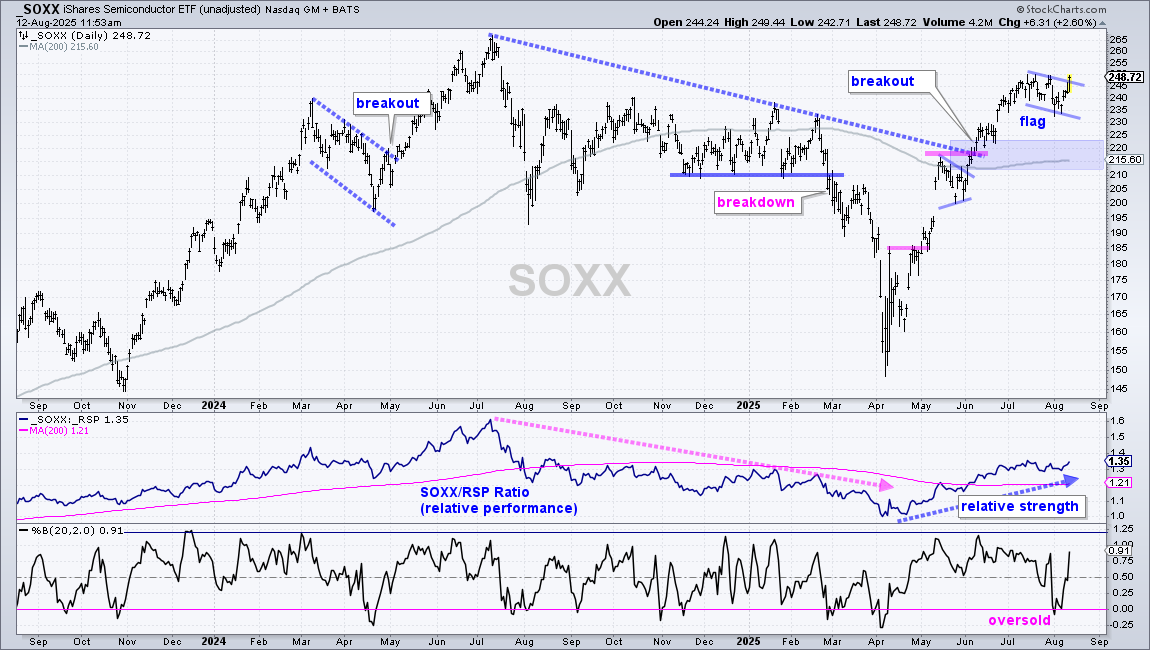
Semiconductor ETF becomes Oversold with Flag (SOXX)
The next chart shows SOXX with a surge from early June to mid July, a falling flag into August and a flag breakout working this week. Notice that %B dipped below zero to become oversold as the flag formed.
Communication Services SPDR Holds Strong (XLC)
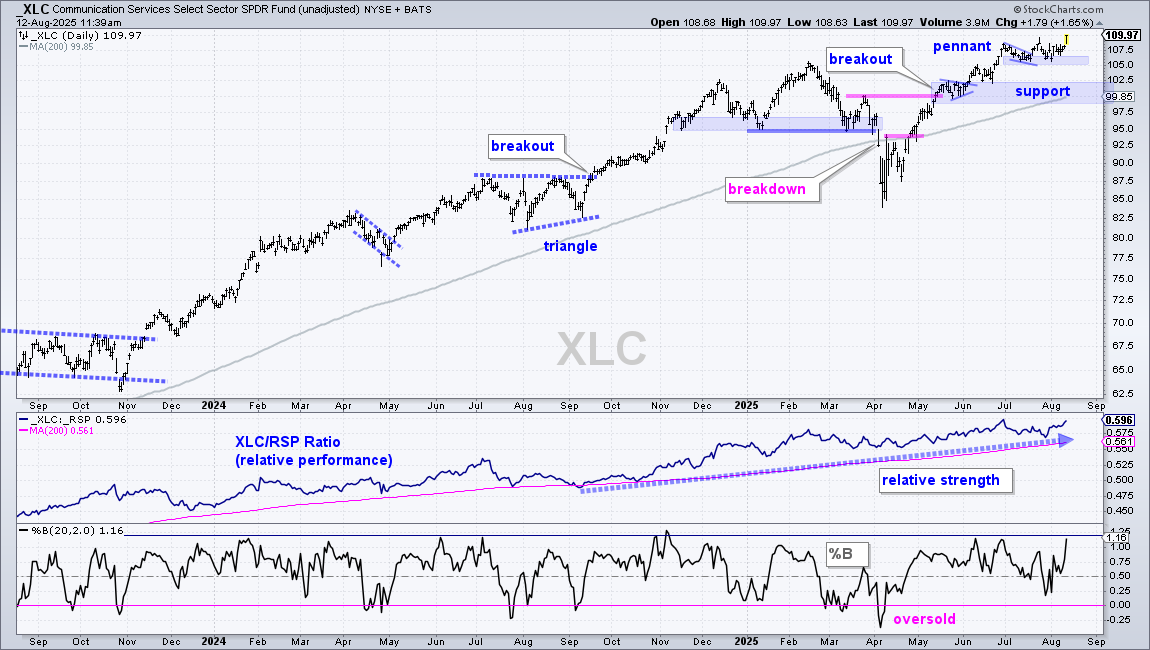
The next chart shows XLC hitting a new high this week and leading the market. XLC formed a small falling wedge (pennant) into mid July and broke out in late July. GOOGL, META, NFLX and EA are powering this ETF higher.
Finance SPDR Gets Oversold Bounce (XLF)
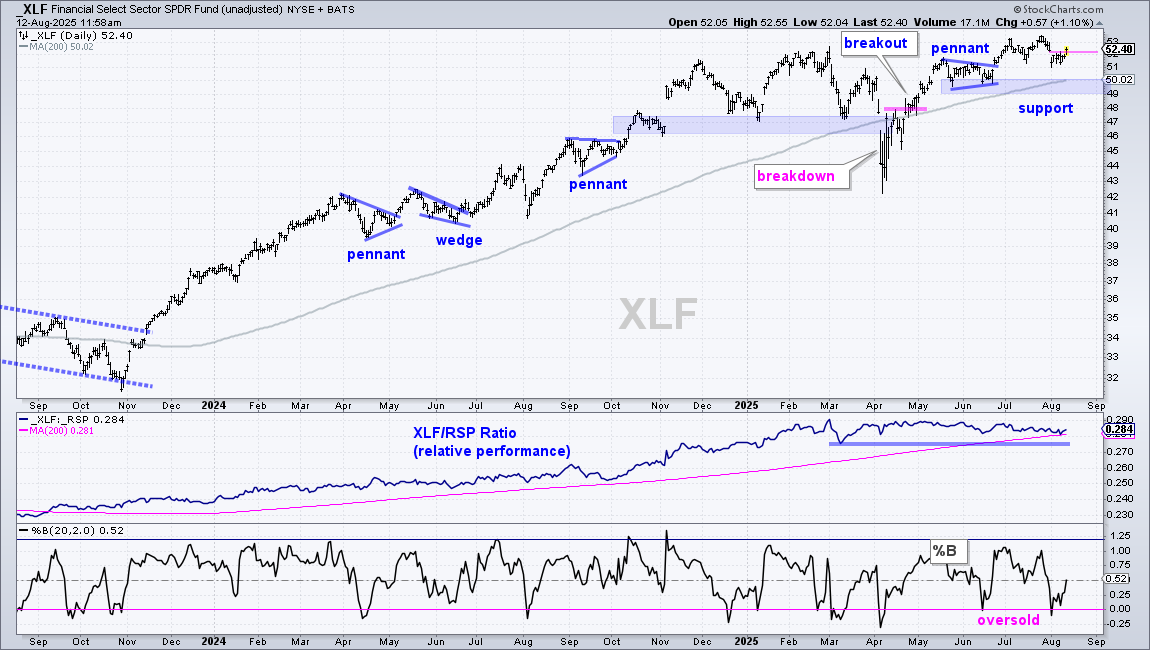
XLF is not the most exciting sector, but it is holding its uptrend and trading close to a 52-week high. On the price chart, XLF broke out of a pennant in late June and held this breakout. The ETF then tagged new highs in July and remains well above its rising 200-day SMA. Most recently, it became oversold as %B dipped below 0 on August 1st and surged above last week’s high with a pop on Tuesday.
Regional Bank ETF Gets Oversold Bounce (KRE)
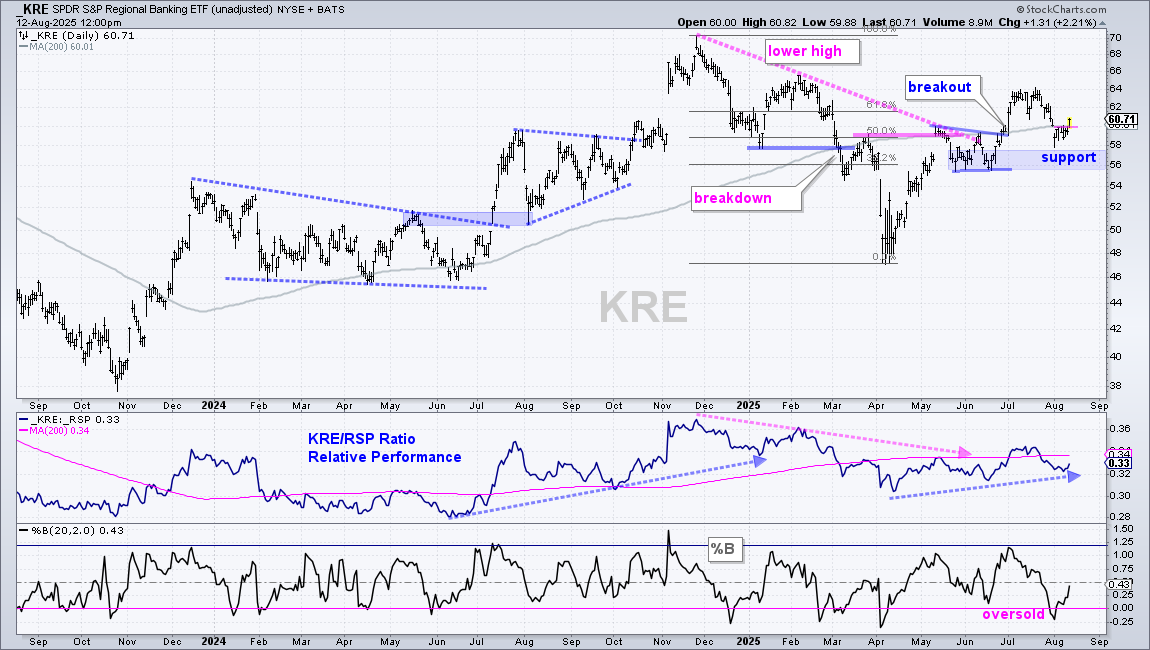
The next chart shows the Regional Bank ETF (KRE) getting a breakout in late June with a move above the 200-day SMA and pennant line. KRE extended to 64 and then fell rather sharply with a move back below the 200-day SMA in early August. Despite this decline, the long-term trend was up and support in the 56-58 area held. KRE also became oversold in late July as %B dipped below zero. Tuesday’s break back above the 200-day signals a short-term upturn after this oversold condition.
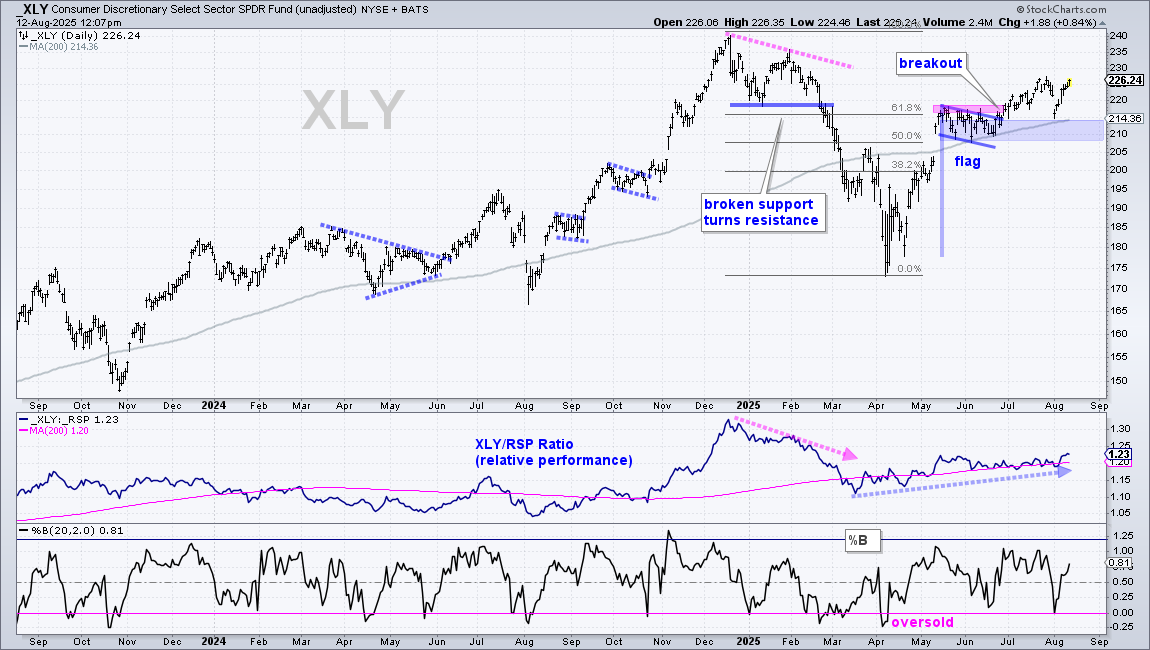
The next chart shows XLY forming a bull flag above its 200-day SMA and breaking out in late June. There was a short and sharp pullback to the rising 200-day SMA on August 1st, but XLY bounced right back to maintain its uptrend. The June lows mark support.
Cybersecurity Corrects with Flag Forming (CIBR)
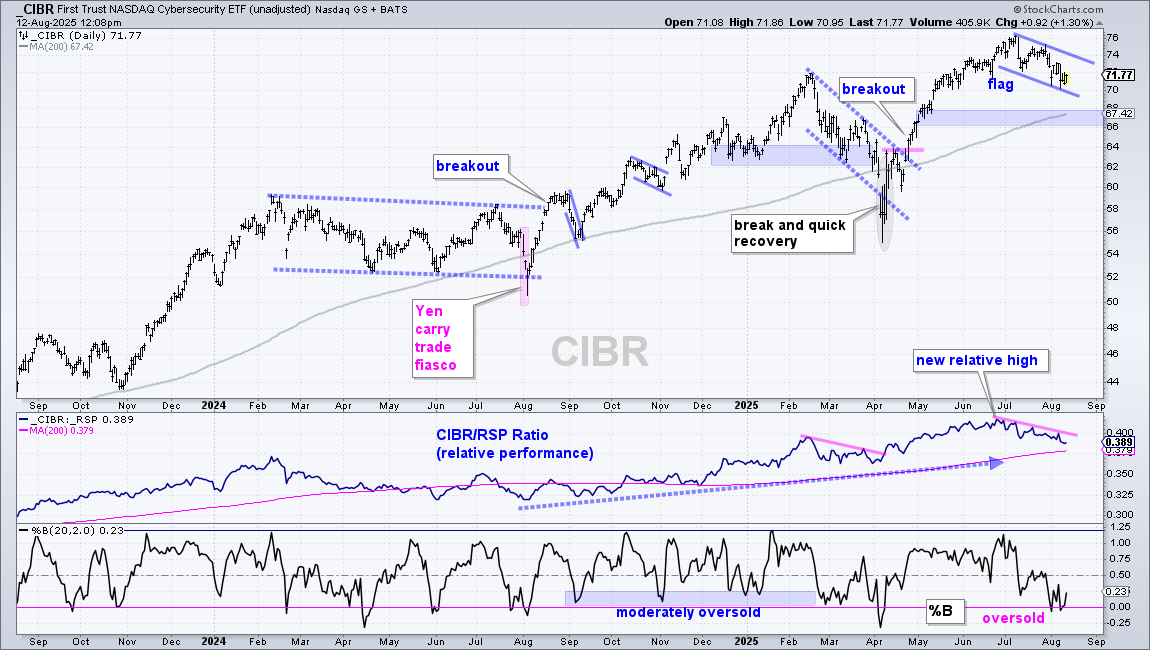
The next chart shows the Cybersecurity ETF (CIBR) hitting a new high in early July and correcting into August with a falling flag. This is a short-term bullish continuation pattern that represents a correction after a sharp advance. A breakout at 75 would confirm the pattern. Note that %B became oversold twice in early August with dips below zero. Short-term oversold conditions signal pullbacks or consolidations within long-term uptrends. These can be opportunities.
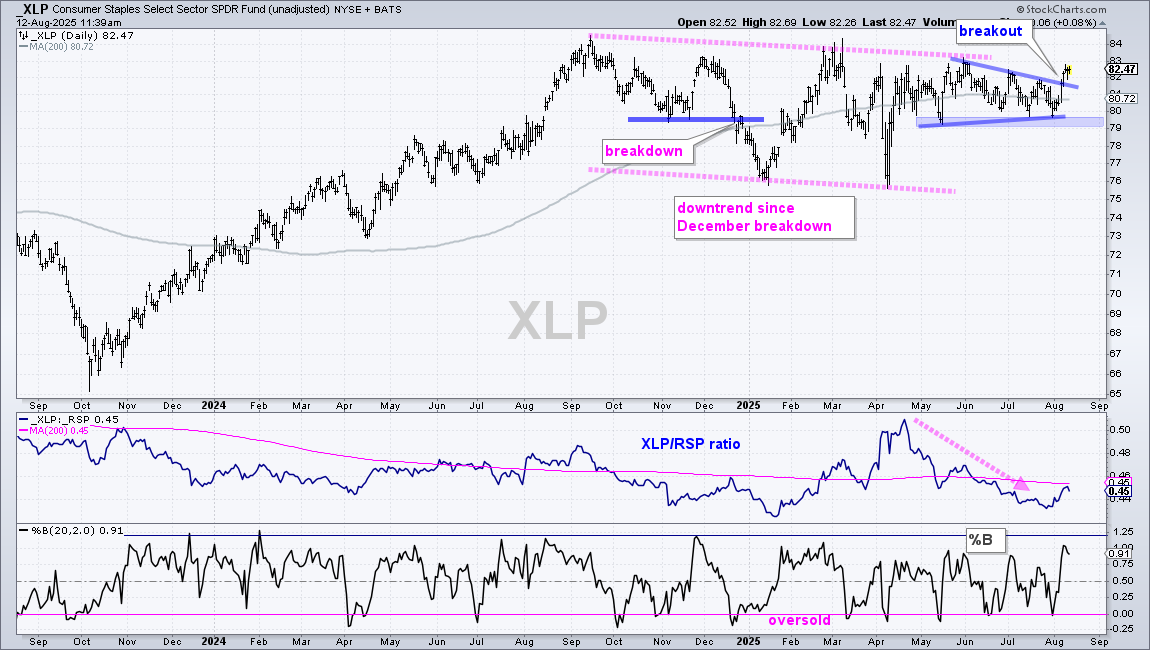
The next chart shows the Consumer Staples SPDR (XLP) with a triangle breakout last week. The triangle breakout is promising because it signals a continuation of the April-May advance. I am marking key support in the 79-80 area. Note that XLP is not a leader because it remains with lower highs and within a falling channel.
Big Declines weigh on Software and Cloud ETFs
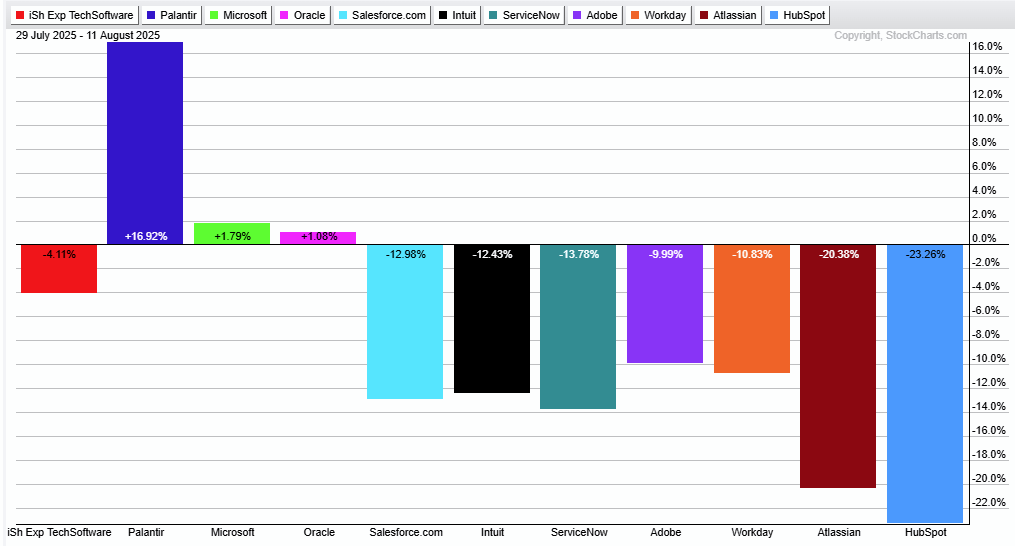
AI is shaking up the software and cloud business, namely Software as a Service stocks (SaaS). While Microsoft, Palantir, Alphabet, Meta and Nvidia power to new highs, we are seeing weakness within the Software ETF (IGV) and Cloud ETF (CLOU). The PerfChart below shows IGV with a 4% decline since July 29th. Its top three components are holding up fine, but there are several names with double digit declines. See PerfChart below.
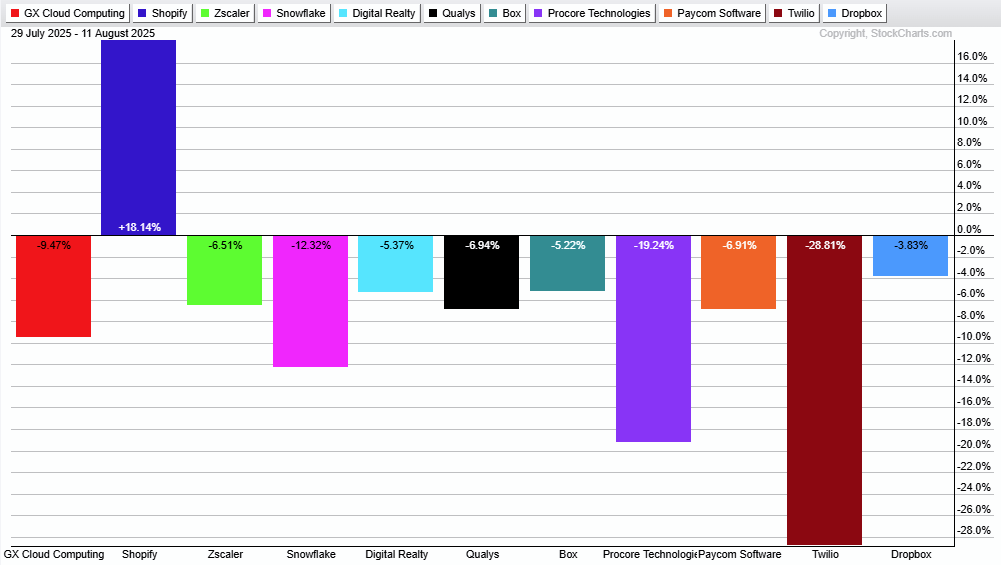
The next image shows CLOU with a 9.49% decline the last two weeks. SHOP is up over 18%, but the other nine stocks are down between 3.83% and 28.81%.
Send feedback to support(at)trendinvestorpro.com or use the contact form. [1]