Gold Forms Classic Pattern – Gold Miners Lead – Base Metals Maintain Upswing
Posted By
Arthur Hill, CMT
On
In
Archive |
No Comments
Headlines
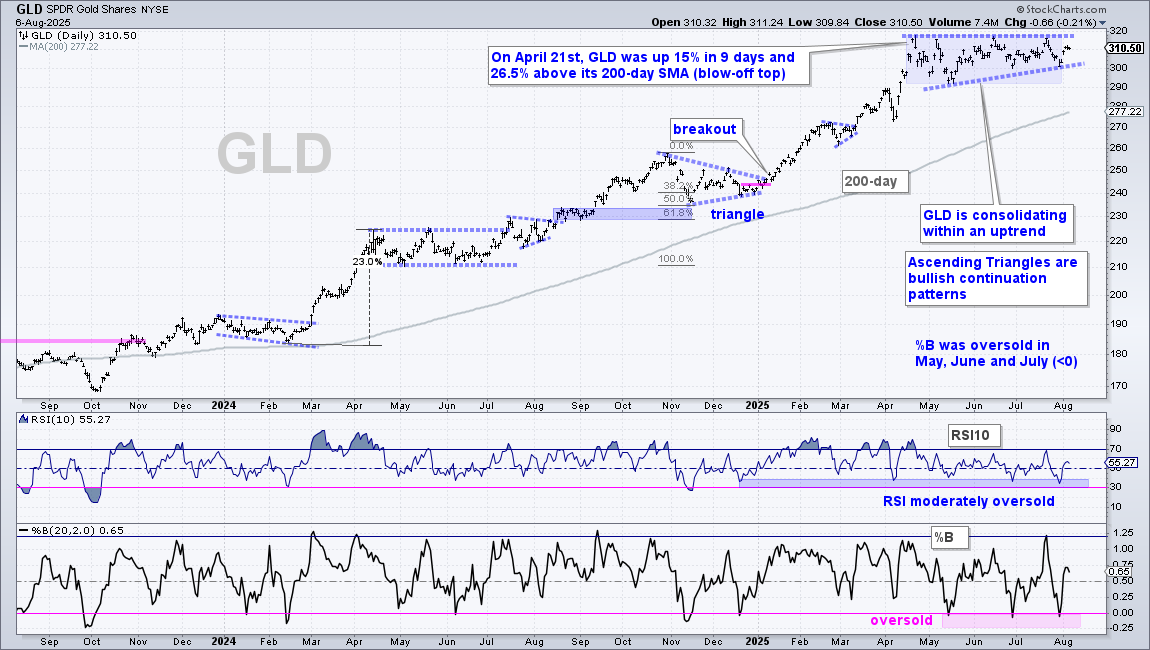
GLD forms Classic Bullish Continuation Pattern
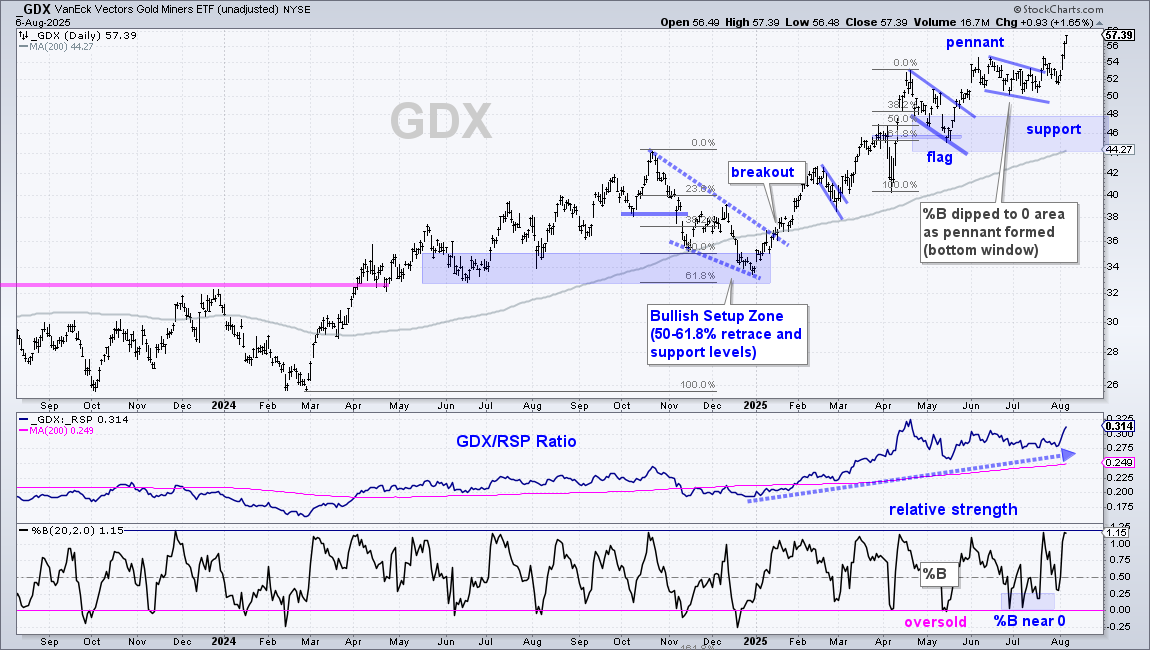
Gold Miners ETF Extends on Flag Breakout
Silver and Silver Miners ETFs Remain Strong
Base Metals ETF Holds Upswing
Bitcoin with Bullish Pattern and Moderately Oversold
Gold, silver and their respective miners remain in leading uptrends. The Gold and Silver Miners ETFs are leading with new highs after big moves the last three days. Even though gold is lagging, a classic bullish continuation pattern is taking shape. Silver is a little more erratic, but the mid July breakout is holding. Even though the Base Metals ETF is not as strong gold, its upswing is holding after the plunge in copper. And finally, Bitcoin remains in a leading uptrend with a short-term bullish pattern taking shape.
Note that I am trying something different today. Instead of a paragraph or two analyzing the chart, I am using bullet points to highlight the key items. These start with a long-term trend assessment and then cover the current pattern/setup at work. Hopefully, this will help streamline the reading process for you.
GLD forms Classic Bullish Continuation Pattern
GLD is in a leading uptrend with a new high in April and price well above the rising 200-day SMA.
An Ascending Triangle formed since May and this is a classic bullish continuation pattern.
The upward sloping trendline shows a higher low, indicating that buying pressure came in at a higher level in late July (300).
Consolidations within uptrends represent the pause that refreshes. This is a rest within the ongoing uptrend.
A breakout at 320 would signal a continuation of the long-term uptrend.
Notice that %B dipped below zero three times during this consolidation (May, June and July).
Oversold conditions within uptrends or consolidations offer a chance to buy the dip for a mean-reversion bounce.
Gold Miners ETF Extends on Flag Breakout
The Gold Miners ETF (GDX) is in a long-term uptrend with a new high this week and price well above the rising 200-day SMA.
Short-term, GDX surged from 46 to 54 and then pulled back with a pennant in June-July.
A pennant after an advance is a short-term bullish continuation pattern.
The breakout on July 22nd reversed the short-term slide and signaled a continuation of the prior advance.
Notice that GDX dipped back into the pennant after the breakout. This offered a second chance to partake.
GDX surged to new highs this week and remains in a leading uptrend.
The middle window shows the price-relative above its rising 200-day SMA (relative strength) and turning up in early August.
Long-term support is set in the 44-48 area. Here we have the rising 200-day SMA and the May lows.
Silver Remains Strong
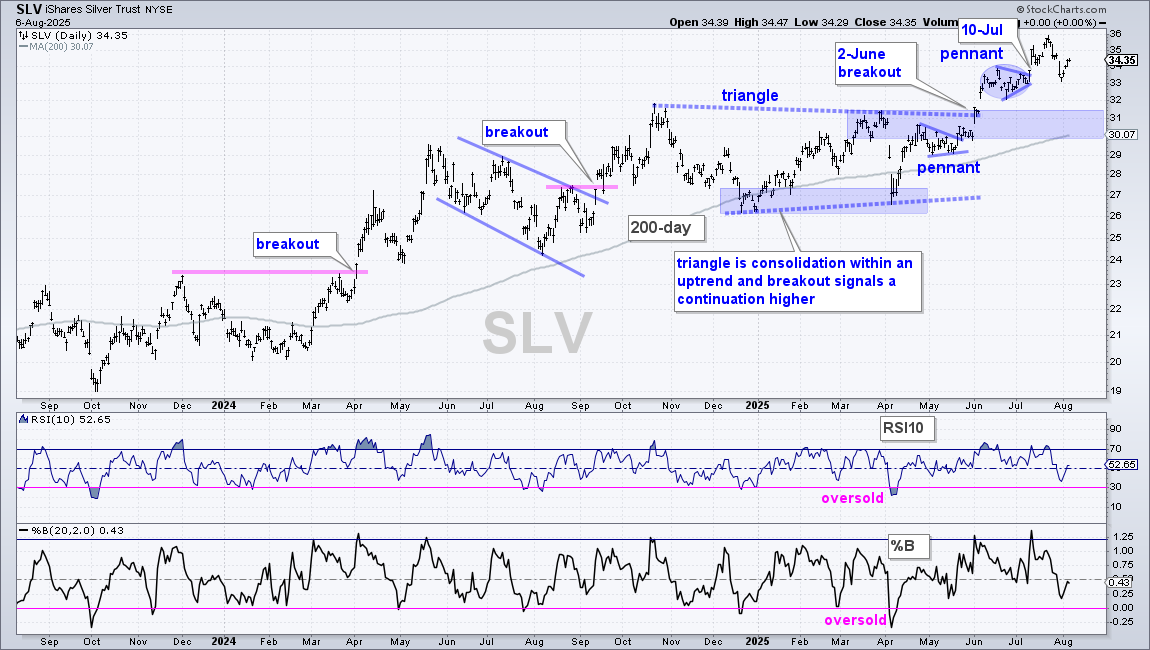
The Silver ETF (SLV) remains in a leading uptrend with a new high in July and price well above the rising 200-day SMA.
Silver is more volatile than gold and the uptrend on the price chart is more erratic.
After surging to new highs in June, the ETF consolidated with a pennant into July and broke out with a surge on July 10th.
Price action since this breakout has been choppy as SLV surged above 36, fell back to 33 last week and bounced to 34.35 this week.
This is just short-term noise after the July 10th breakout and this breakout remains the active signal.
Long-term, the most recent signal was the triangle breakout on June 2nd. Just prior to this breakout, SLV formed a pennant and broke out in late May.
Broken resistance and the rising 200-day SMA mark first support in the 30-31 area.
Silver Miners ETF Surges to New High
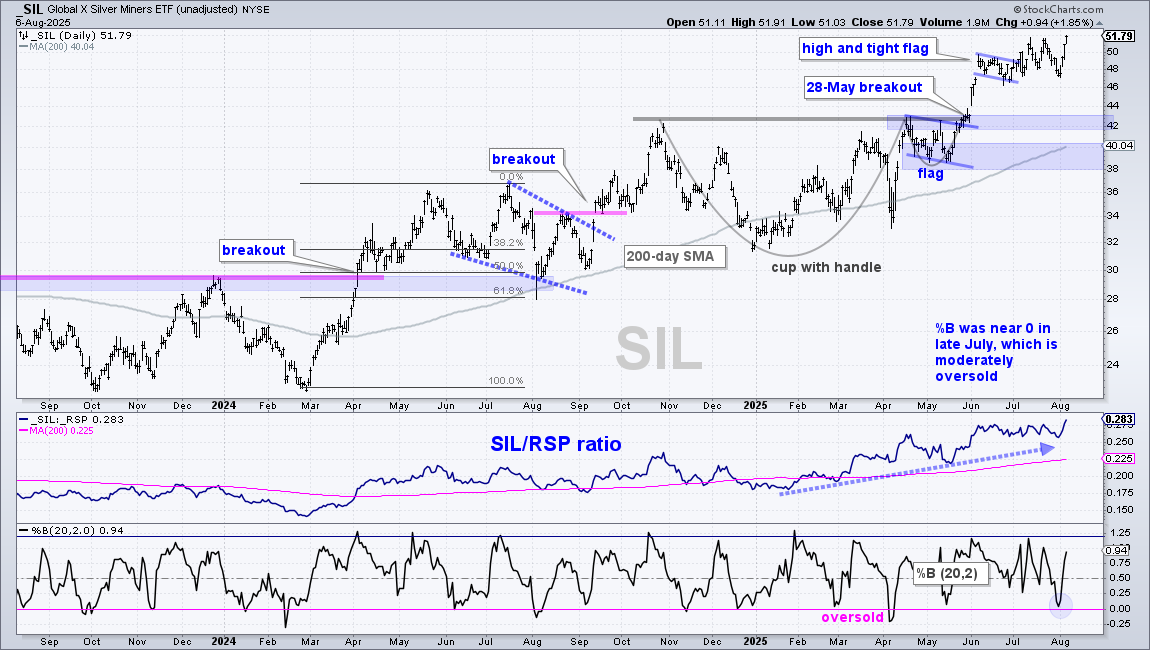
The Silver ETF (SLV) is in a leading uptrend with a new high this week and price well above the rising 200-day SMA.
After a short-term surge from 38 to 50, the ETF consolidated with a high and tight flag, and broke out with a surge in early July.
Price action since the breakout has been choppy, but the flag lows held and remained valid through this volatility.
Notice that %B dipped to 0 in late July. This marked a short-term oversold condition and paved the way for this week’s mean-reversion bounce.
The price-relative (SLV/RSP ratio) is above its rising 200-day SMA as well and hit a new high in early August (relative strength).
Long-term, SLV broke out of a cup-with-handle pattern in early June and broken resistance turns first support in the 42-43 area.
Long-term support is set using the rising 200-day SMA and May lows (38-40).
Base Metals ETF Holds Upswing
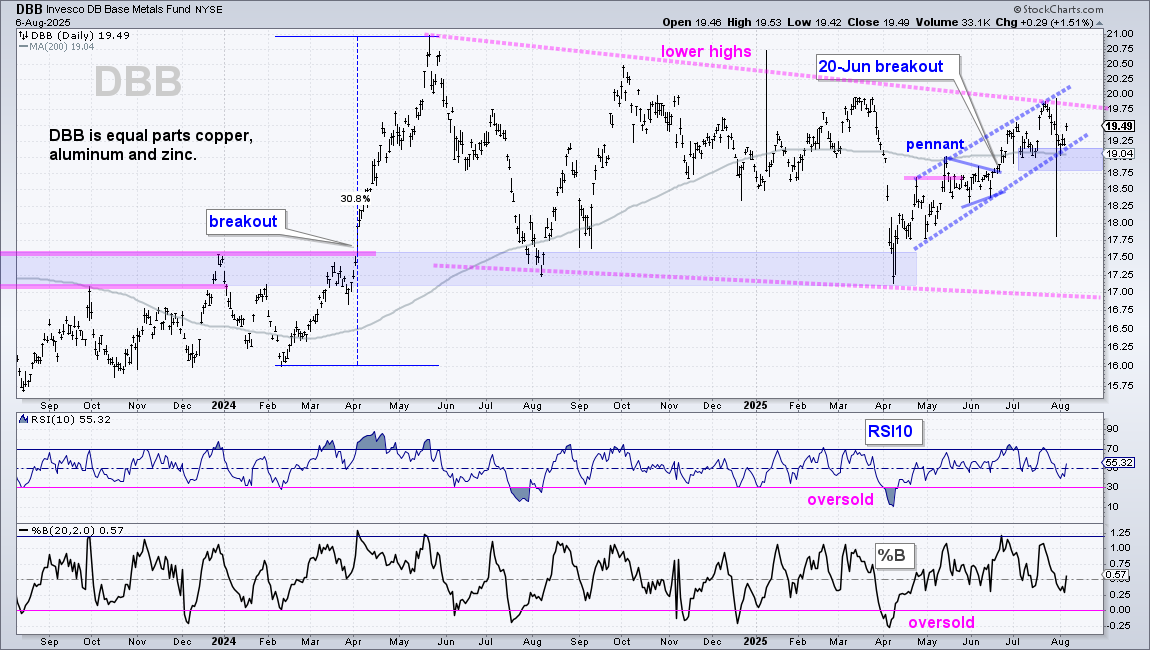
The DB Base Metals ETF (DBB) is in a long-term downtrend with lower highs and lower lows the last 12+ months (pink trendlines).
Even so, DBB is in a short-term uptrend since the resistance breakout in mid May (pink line).
There is also a pennant breakout on June 20th and DBB extended higher after this breakout.
DBB needs to break 20 to forge a higher high and reverse the long-term downtrend.
Short-term, I am watching the July lows and April trendline, which mark support in the 18.75-19 area.
The bulls have the immediate edge as long as long as this support zone holds.
Bitcoin with Bullish Pattern and Moderately Oversold
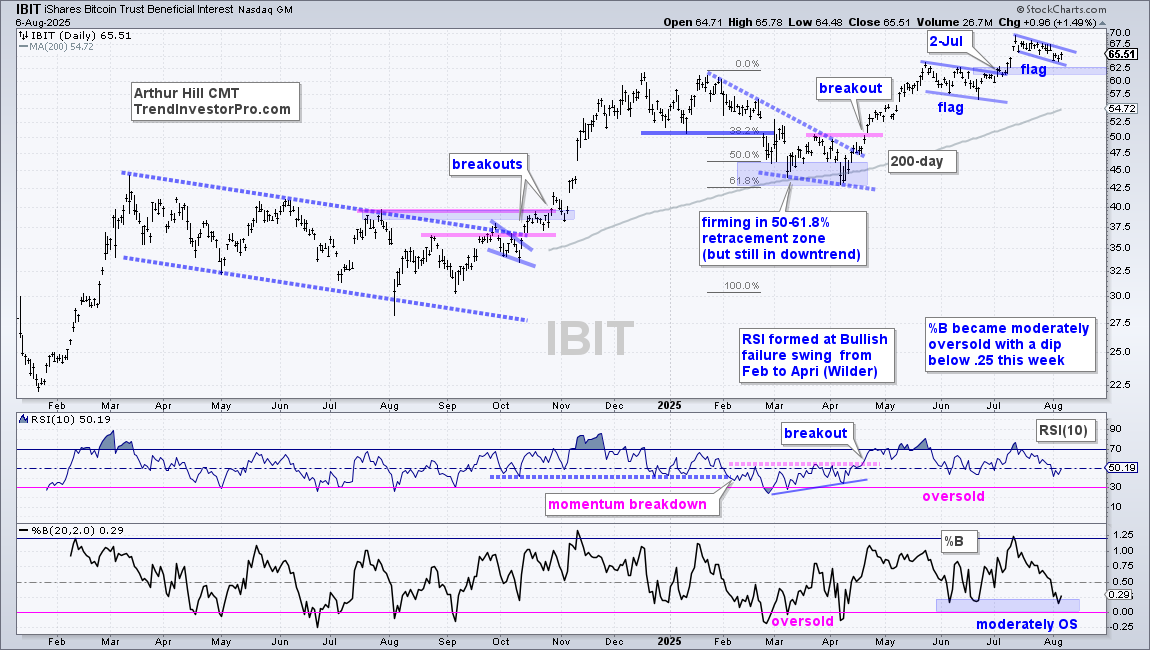
The Bitcoin ETF (IBIT) is in a leading uptrend with a new high in mid July and price well above the rising 200-day SMA.
Short-term, IBIT surged from 57.5 to 70 and then corrected with a falling flag from mid July to early August.
After a sharp advance, a falling flag is a bullish continuation pattern and a break above the flag line (67.25) would be bullish.
IBIT is also trading near the 2-July flag breakout, which marks support because broken resistance turns into first support.
The bottom window shows %B dipping into the 0-.25 area, which marks a moderately oversold condition.
IBIT is ripe for an oversold bounce and a breakout at 67.50 would be bullish.
Send feedback to support(at)trendinvestorpro.com or use the contact form. [1]