Headlines
- Where are the New Highs?
- %Above 200-day SMA Indicators Take a Hit
- Put/Call Ratio Triggers Bearish
- Seasonal Patterns Weak Until October
- SPY/QQQ in Uptrends, but Ripe for Corrections
- Counter Trend Bounces for Small and Mid Caps (IJR/IJH)
This report looks at several indicators that point to a correction. Leadership in 2025 was narrow because new highs did not expand to previous levels. We saw the percentage of stocks above their 200-day SMA increase the last few months, but these indicators were hit hard in early August. A large percentage of stocks are below their 200-day SMAs, and in long-term downtrends. We will also review the put/call ratio, seasonality and the targets for SPY and QQQ.
Leadership is Narrow, but New Highs Outpace New Lows
New high data shows narrow leadership within the S&P 500. In the first window, notice how the number of new highs exceeded 50 (solid line) only once this year (July 23rd). In comparison, new highs exceeded 75 (dotted line) several times during the 2024 bull run, and even 100 a few times. High-Low Percent confirms these numbers. S&P 500 High-Low% exceeded +10% only once this year (July 23rd). During the 2024 bull run, High-Low Percent exceeded 15% on a regular basis and even pushed above 20% a few times. 2024 was a bull market with broad leadership – the kind of bull market we want to trade.
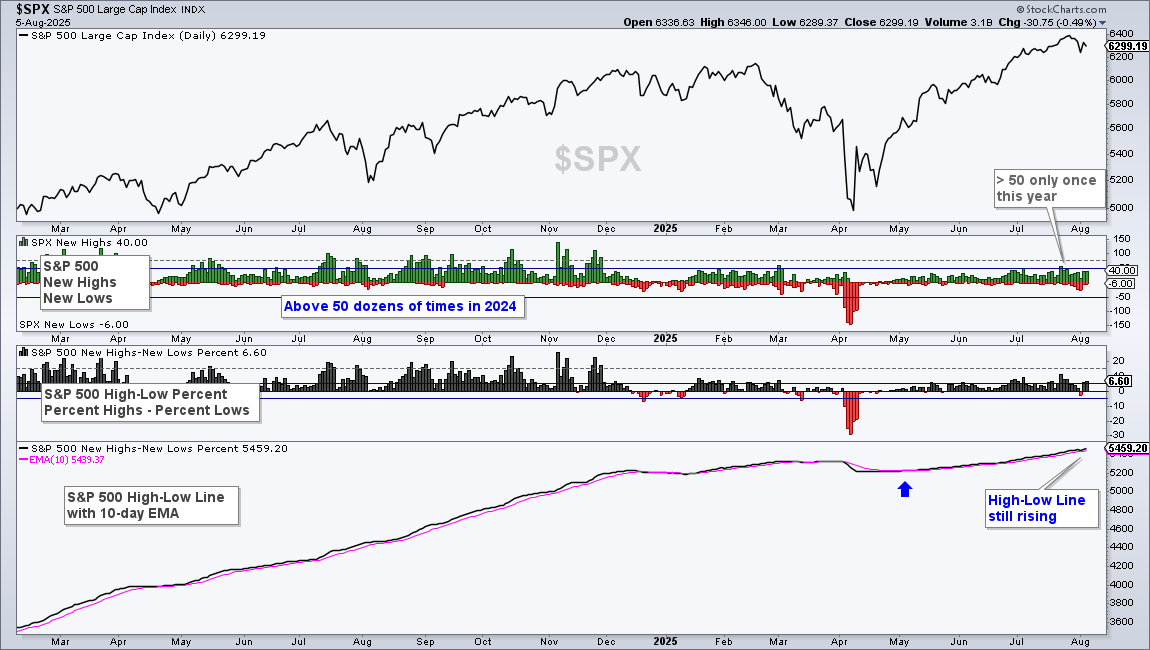
The bottom window shows the S&P 500 High-Low Line turning up in early May with a break above its 10-day EMA. A rising High-Low Line means new highs are outpacing new lows, even if leadership is narrow. This line is still rising and bullish. A downturn and break below the 10-day EMA would be negative. This would show new lows outpacing new highs, and be bearish for stocks.
About these indicators: In the first window, S&P 500 new highs/lows are shown as an up/down pair. New highs are positive and new lows are negative. S&P 500 High-Low% ($SPXHLP) is the percentage of new highs less the percentage of new lows. It is positive when there are more new highs than new lows. The S&P 500 High-Low Line is a cumulative measure of net new highs (new highs less new lows). It rises when new highs outnumber new lows and falls when new lows outnumber new highs.
%Above 200-day SMA Indicators Take a Hit
The chart below shows the percentage of stocks above their 200-day SMA for the S&P 500, Nasdaq 100, S&P MidCap 400 and S&P SmallCap 600. In the first window, notice how SPX %Above 200-day exceeded 60% in December 2023 and held above 60% for a year (until December 2024). This was a strong bull run that lifted most boats (stocks). Most recently, SPX %Above 200-day crossed above 60% in early July, but it is already back below 60% (57.20%). Even though this is not exactly bearish, it indicates that 43% of S&P 500 stocks are below their 200-day SMAs and in long-term downtrends. Stocks in downtrends are weighing on the market and 43% is a large percentage.
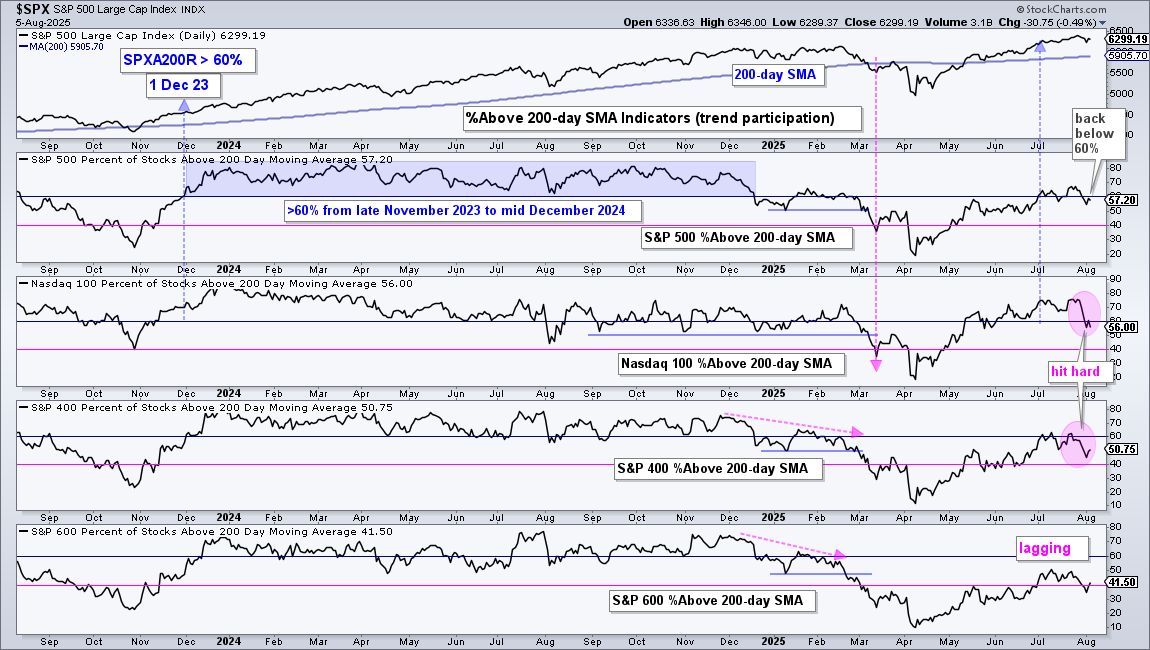
The pink ovals show NDX %Above 200-day falling from 75 to 56 percent and MID %Above 200-day falling to 50.75%. This means 44% of Nasdaq 100 are below their 200-day SMAs and 49% of S&P MidCap 400 stocks are below their 200-day SMAs. Again, a high percentage of stocks are in downtrends and this weighs negatively on the market.
Equity Put/Call Ratio Triggers Bearish
As noted last week the 21-day EMA of the CBOE Equity Put/Call Ratio ($CPCE) fell below .55 in May and July (top window). This reflects excessive call volume. The breakout in June was a bad signal, but we now have a bigger breakout at .60, which is a bearish signal. The current setup and signals are similar to what we saw from December to February.
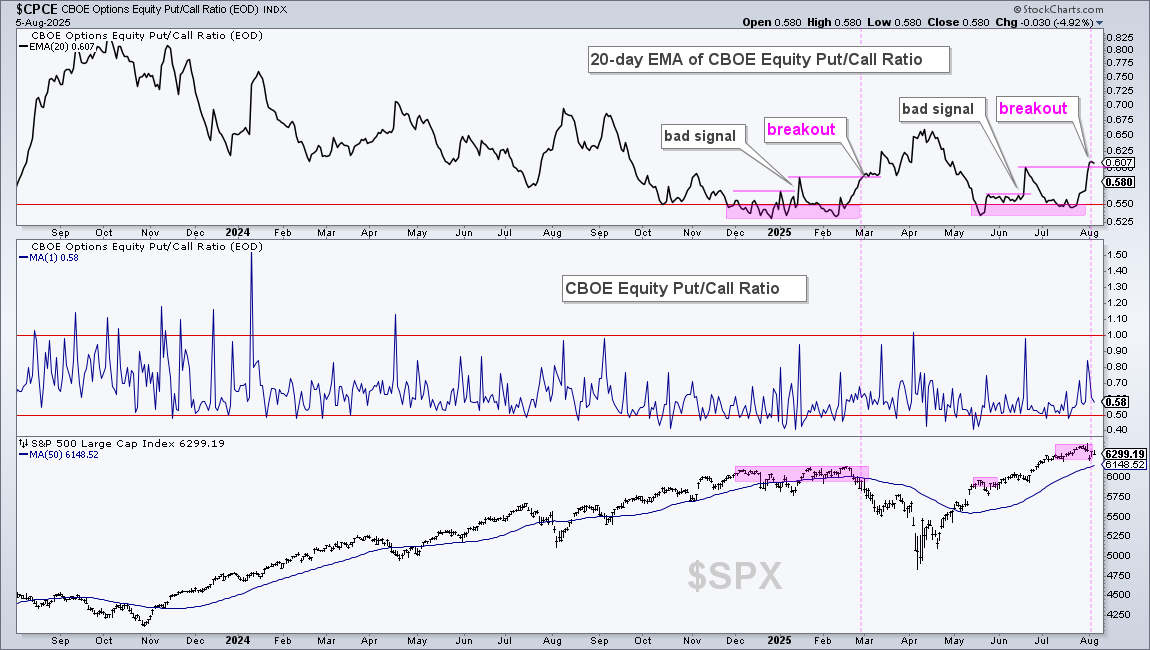
About $CPCE: The CBOE Equity Put/Call Ratio ($CPCE) shows the ratio of put volume to call volume (put volume divided by call volume). I use a 20-day EMA to smooth the date. This ratio is 1 when put volume is equal to call volume. Readings above 1 show exceptionally strong put volume and bearishness. This is a contrarian indicator that can mark a low in SPY. Readings at .50 indicate that put volume is half that of call volume, or call volume is twice as high as put volume. This shows exceptionally strong call volume and bullishness. As a contrarian indicator, this can foreshadow a peak in SPY.
Seasonal Weakness from August to October
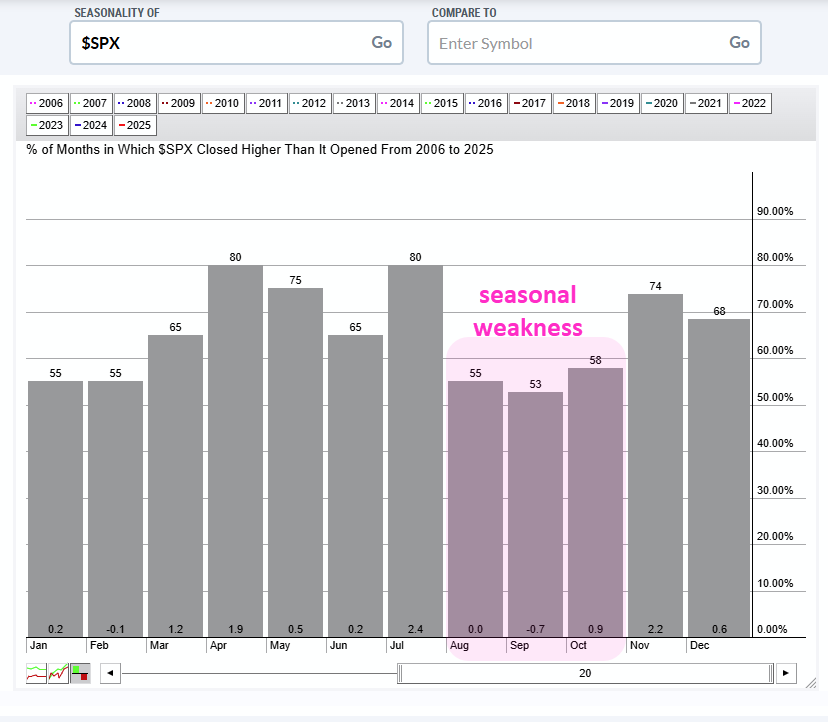
The next chart shows the seasonal tendencies over the last twenty years. The three month stretch from August to October was the weakest (least strong) three month period for stocks. Even so, we can see that the S&P 500 was up 55% of the time in August, 53% of the time in September and 58% of the time in October. Call it a coin flip.
SPY and QQQ Targets
Several indicators argue for a correction. First, QQQ and SPY are up sharply since April and ripe for a correction. Second, there were signs of excess with the outsized gains in several tech and AI related names. Third, the advance since April was narrow and did not lift a high percentage boats. Fourth, sentiment became excessively bullish in July and the CBOE Equity Put/Call Ratio triggered bearish in August. Fifth, a high percentage of stocks are below their 200-day SMAs (in long-term downtrends). Sixth, seasonal patterns are weak from August to October. This evidence does not guarantee a correction, the odds certainly favor one.
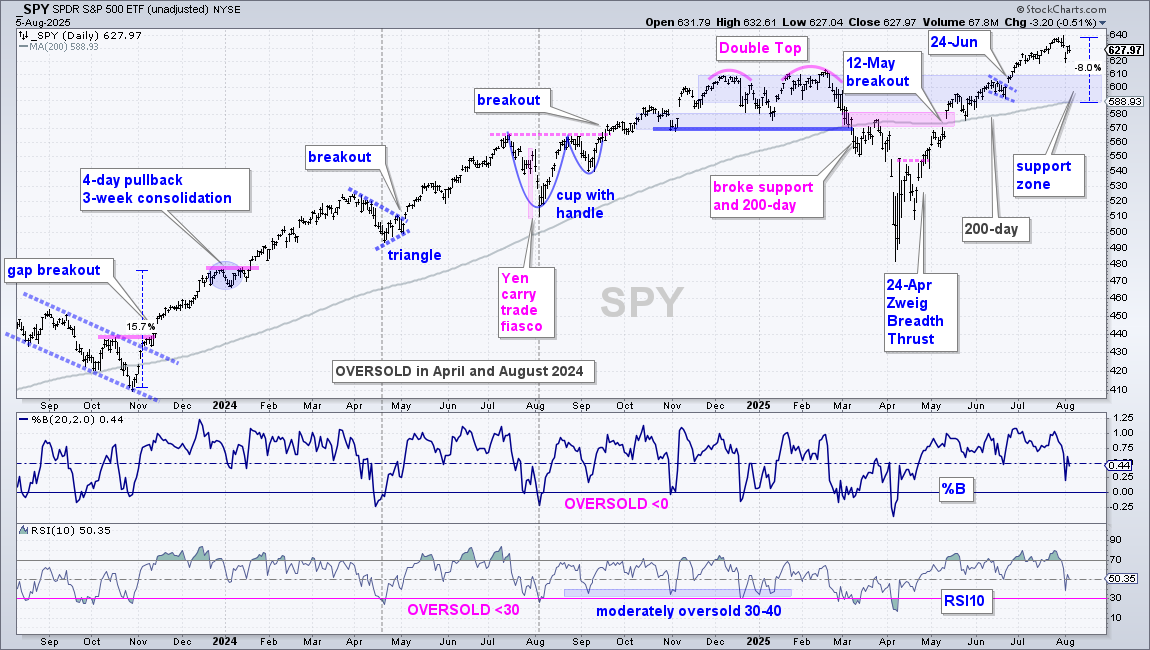
The chart below shows SPY with a correction target in the 600 area. A 5-8 percent decline would extend into the 590-610 area. This is a relatively normal amount for a correction. The blue shading marks support from broken resistance, the June flag and the rising 200-day SMA. The trend trouble starts if SPY moves below its 200-day and negates the mid May breakout. Let’s cross that bridge when and if it gets here.
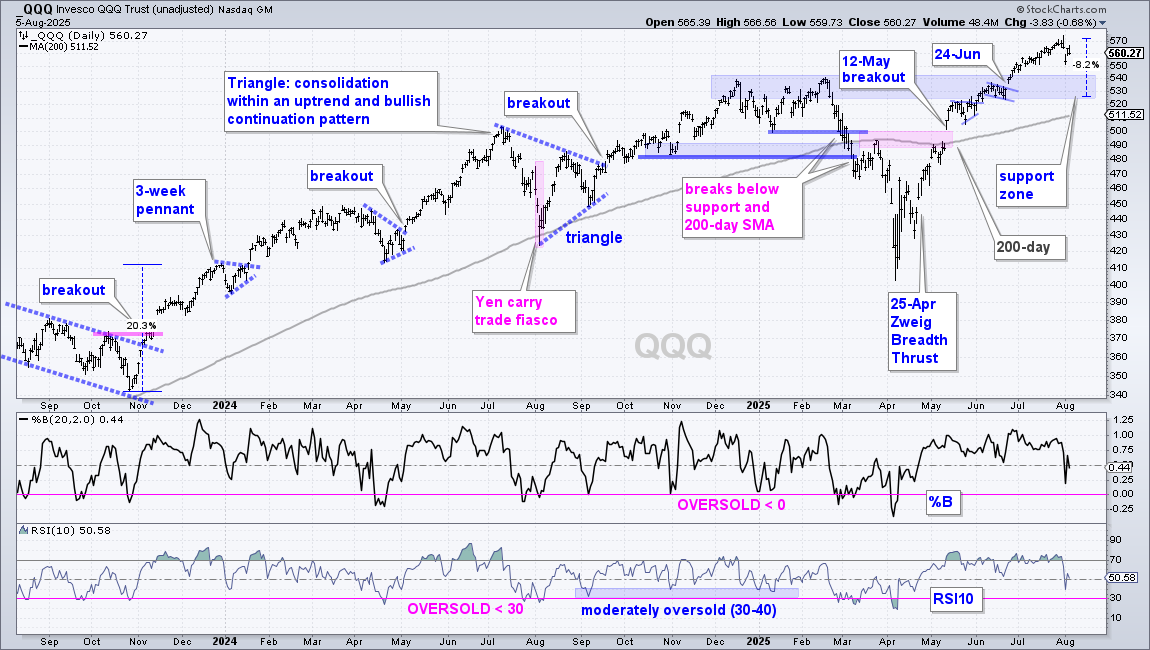
The next chart shows QQQ with a correction target in the 525-540 area. Again, this represents a 5-8 percent pullback from the July highs. The blue shading marks support from broken resistance and the June flag. Note however, that QQQ is more volatile than SPY. A 5-8 percent pullback in SPY could cause a 10-12 percent pullback in QQQ. The 200-day SMA is currently at 511.52.
Send feedback to support(at)trendinvestorpro.com or use the contact form. [1]