Recent Breakouts and Short-term Leaders Favor Yield and Risk Aversion (w/ video)
Posted By
Arthur Hill, CMT
On
In
Archive |
No Comments
Headlines
MLP ETF Holds Triangle Breakout
REIT ETF Battles Breakout Zone and 200-day
Utilities SPDR Breaks to New Highs
7-10Yr TBond ETF Surges after Jobs Report
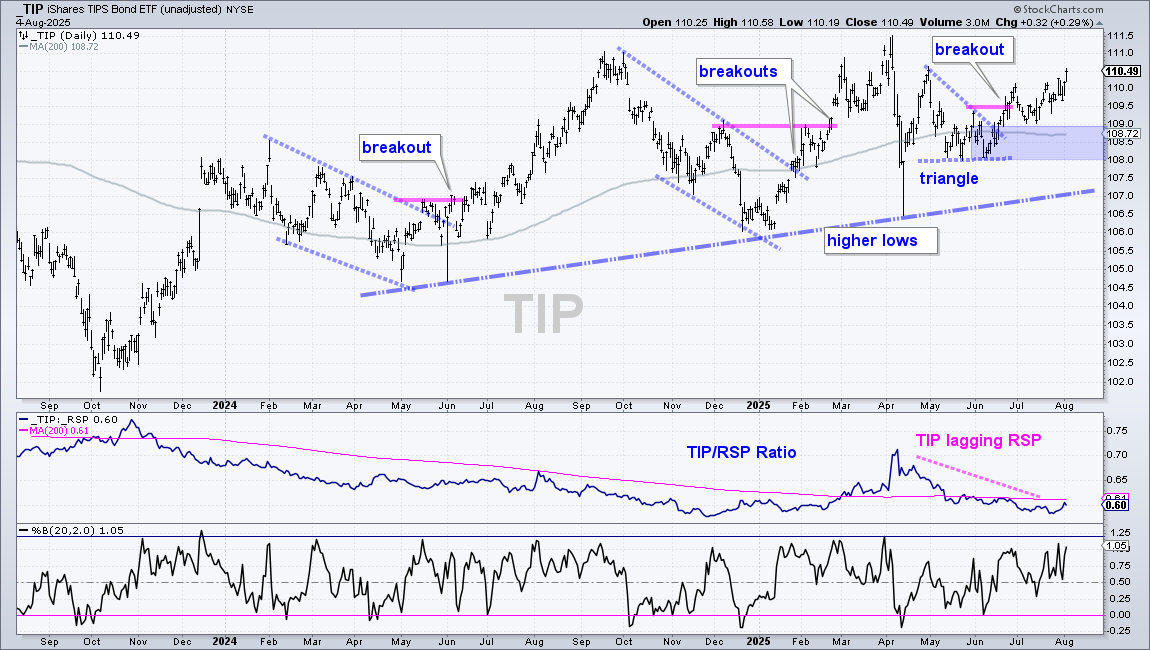
0-30Yr TIPS Bond ETF Leads with Bigger Move
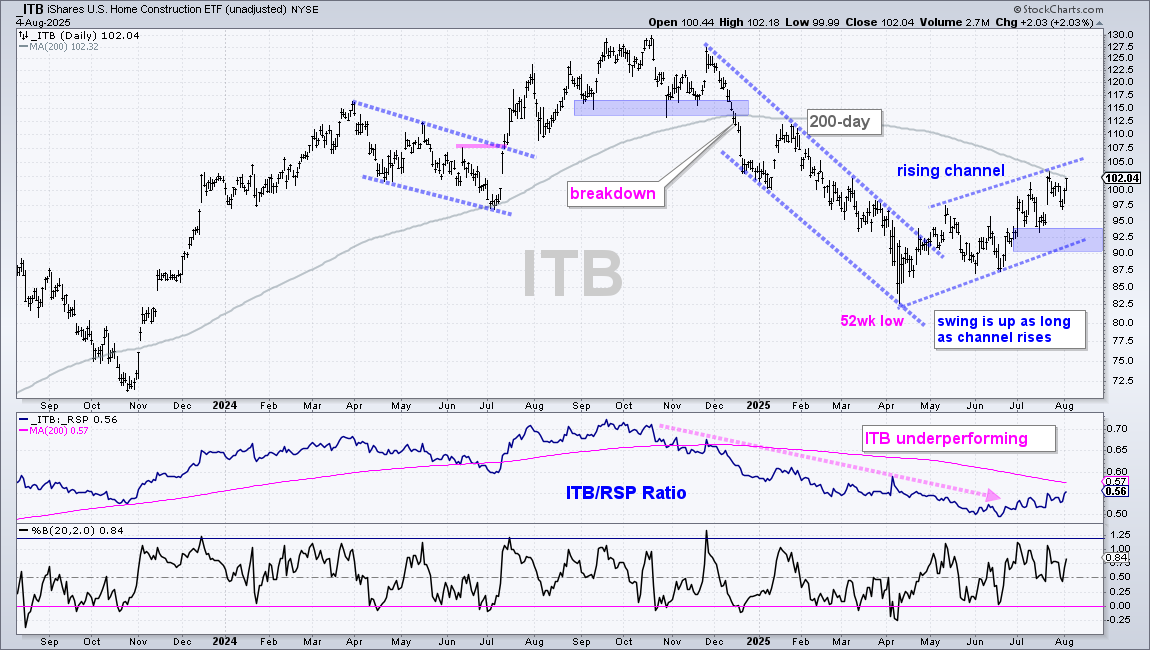
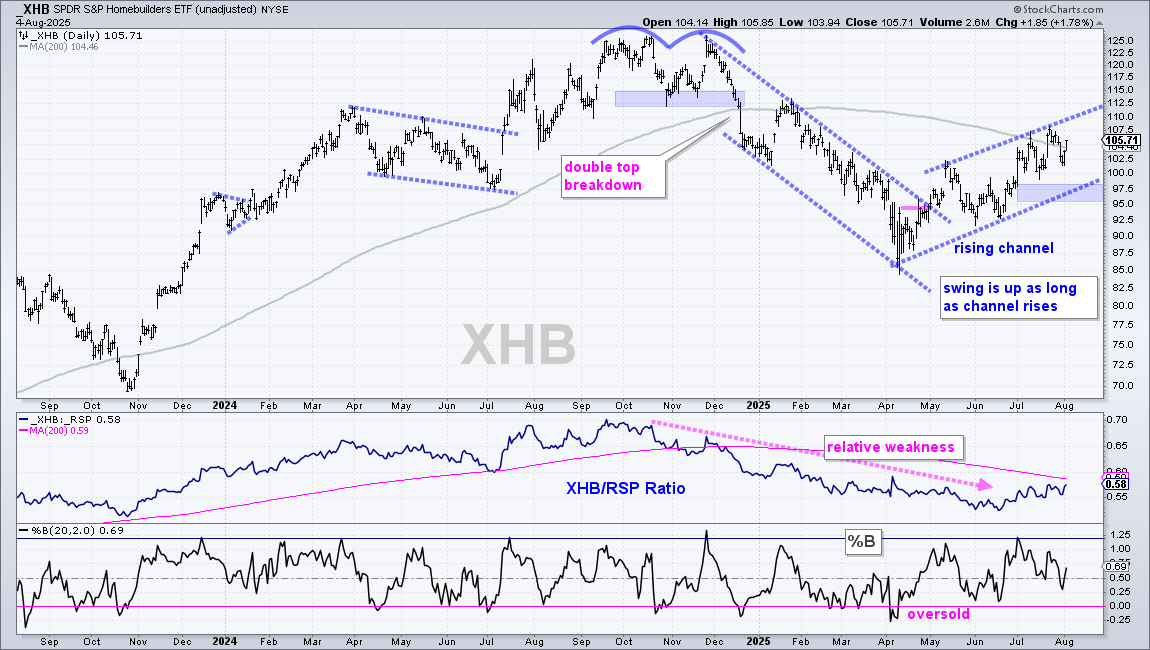
Housing ETFs Follow Bonds with Upswing
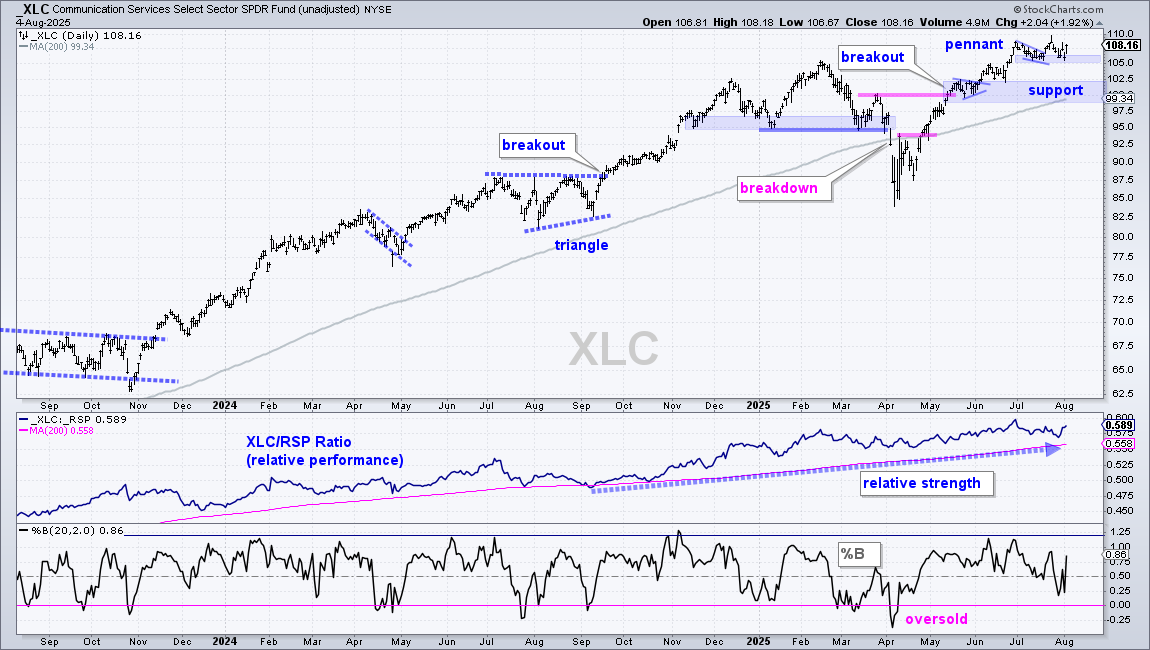
Communication Services SPDR Holds Pennant Breakout
The risk profile changed in the market over the last two weeks. Tech ETFs led the market into the July highs, but we are seeing leadership emerge in some defensive areas the last two weeks. Namely, the MLP, Utilities and Bond ETFs are breaking out. XLU is leading the pack with a surge to new highs. Lower Treasury yields are providing a lift for the Home Construction ETF (ITB), but this is still viewed as a counter-trend bounce within a bigger downtrend.
MLP ETF Holds Triangle Breakout
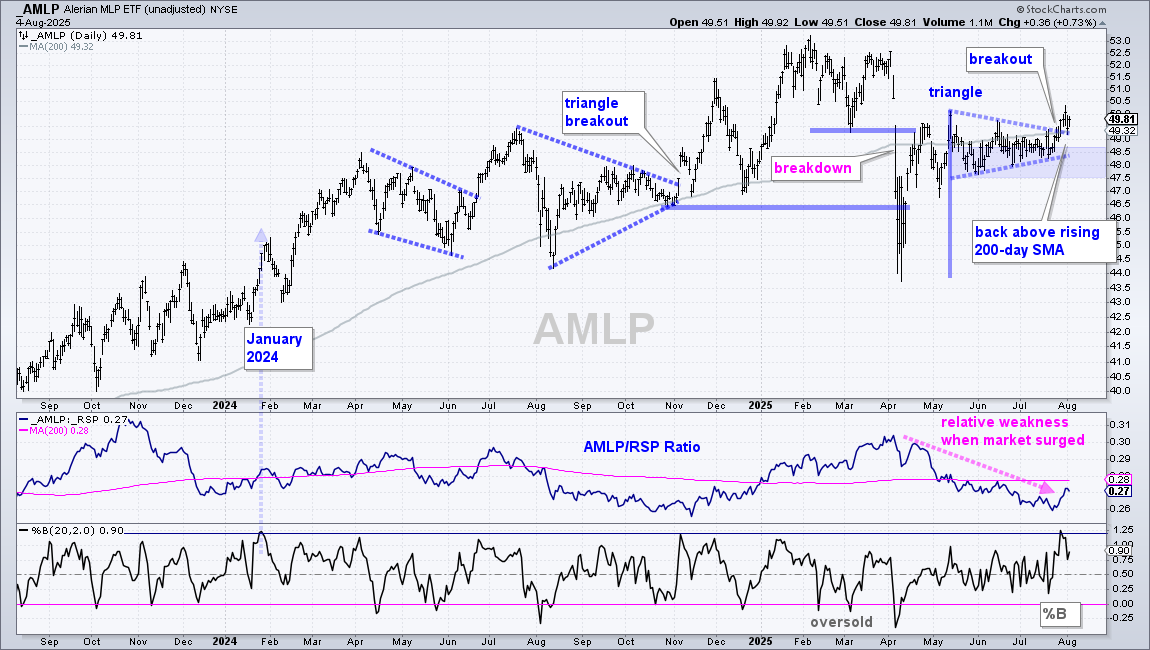
The chart below shows the MLP ETF (AMLP) breaking out of a triangle consolidation and exceeding its rising 200-day SMA. There is some sort of long-term uptrend when price is above the rising 200-day SMA. Short-term, AMLP surged off the April low and consolidated with a triangle. A consolidation after a sharp advance is a bullish continuation pattern. AMLP broke out last week to signal a continuation higher and this argues for a move to new highs. The triangle lows mark support in the 47.5-48.50 area.
REIT ETF Battles Breakout Zone and 200-day
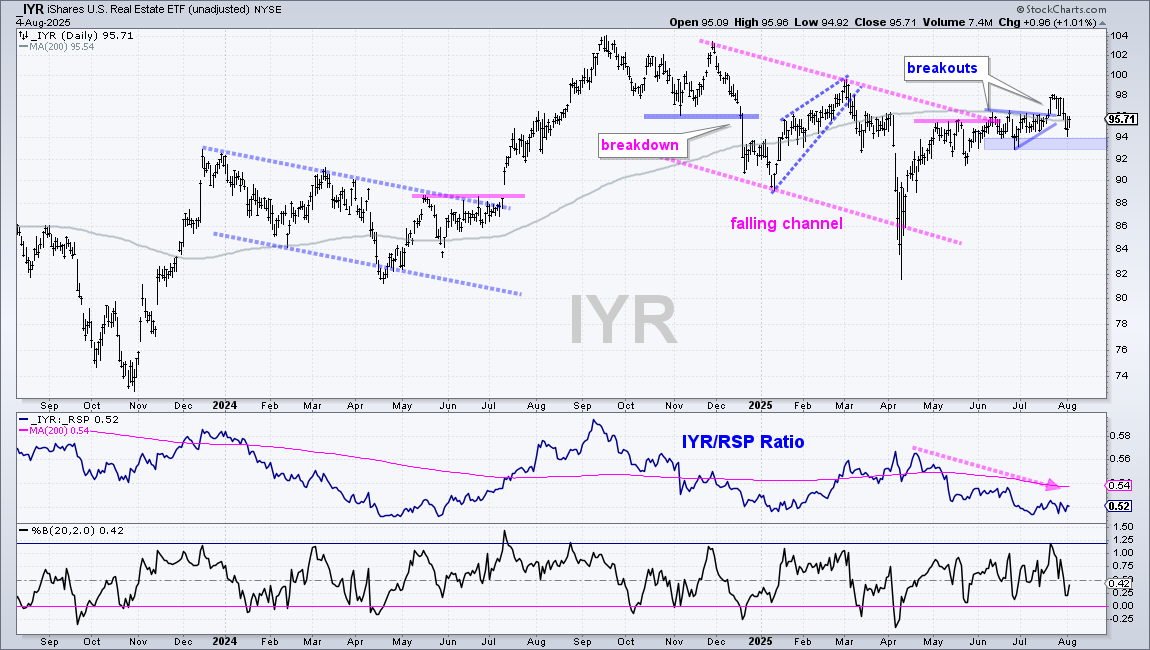
The REIT ETF (IYR) is also attempting a breakout, but is not as strong as AMLP. IYR is currently trading near the flat 200-day SMA. The ETF formed a falling channel into April and attempted a breakout in early June, but this breakout is not getting much traction. Shorter term, a pennant formed into June-July and IYR broke out with a surge above 97. The ETF quickly got cold feet with a dip back below the 200-day last week, but has yet to break support from the triangle lows (blue shading). A break below 93 would negate these breakouts and reverse the upswing in IYR.
Utilities SPDR Breaks to New Highs
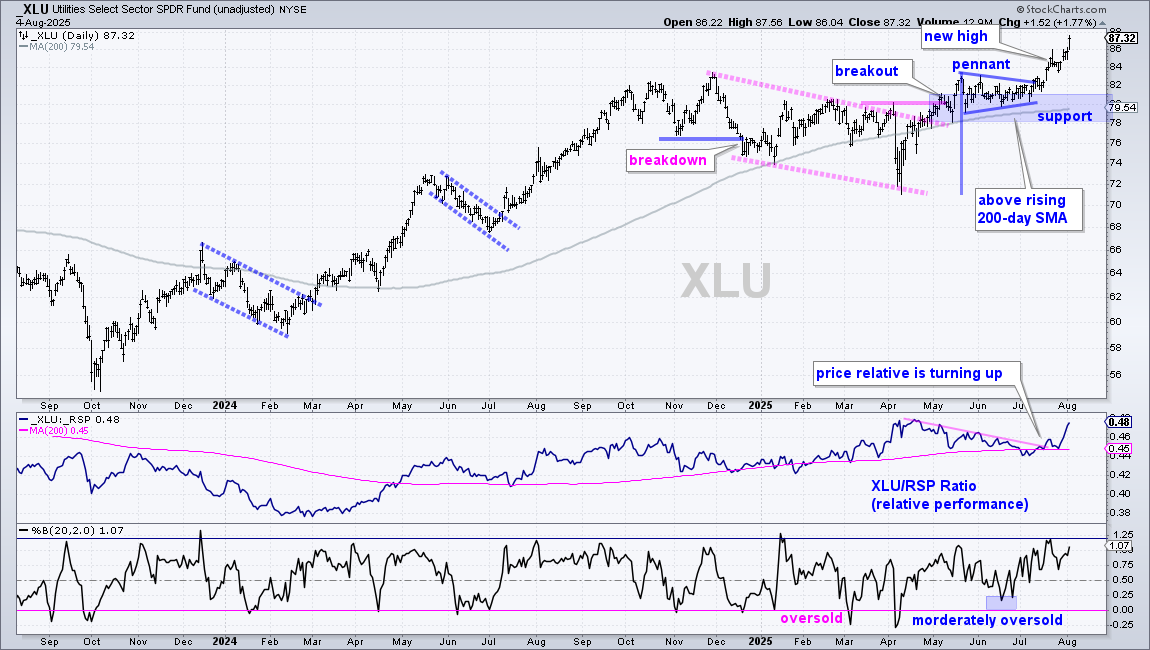
The Utilities SPDR (XLU) is leading the sectors and the market with a fresh new high this week. Long-term, XLU corrected with a falling channel into April and broke out in early May. The breakout did not get much traction as a pennant consolidation formed into early July. XLU broke out of the pennant and surged to new highs the last few weeks. This sector is in a leading uptrend with support marked in the 78-81 area (blue shading). The middle window shows the price-relative (XLU/RSP ratio) turning up in July as XLU starts to outperform the broader market.
7-10Yr TBond ETF Surges after Jobs Report
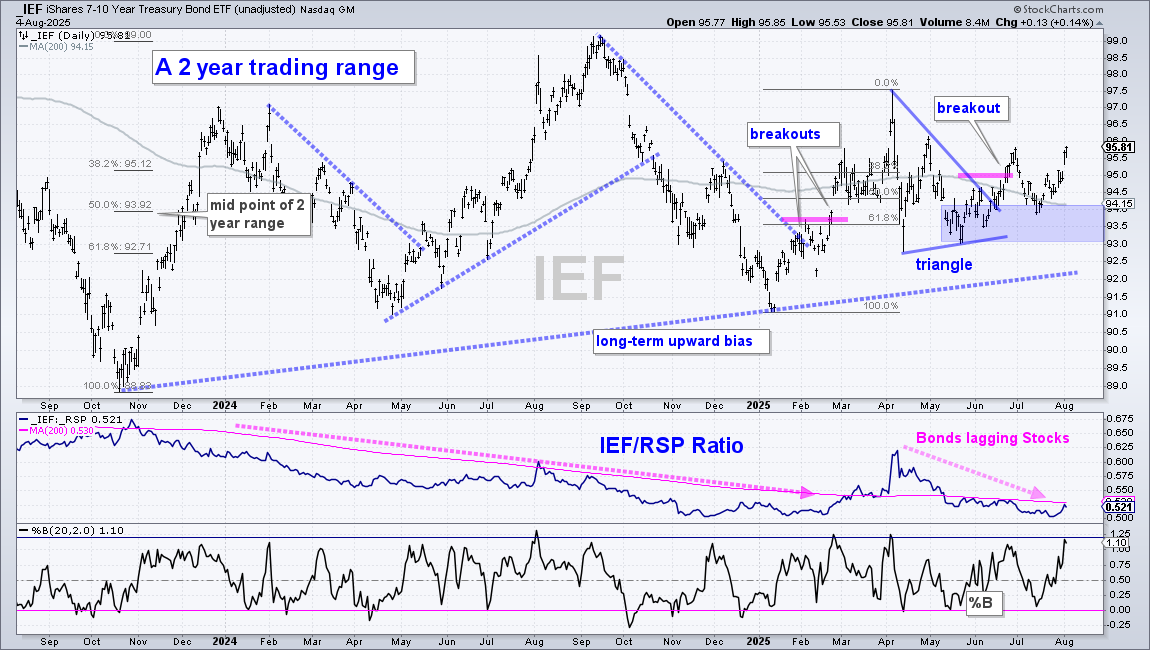
The 7-10Yr TBond ETF (IEF) broke out in June, took a deep dip into mid July and resumed its breakout with a surge the last two weeks. Overall, IEF is in a long-term uptrend with a higher low from October 2023 to January 2025 and a higher high from December 2023 to September 2024. Short-term, the ETF surged in Q1, corrected with a volatile triangle in Q2 and broke out in late June. I view this triangle as a correction after the Q1 advance and the breakout signaled a continuation higher. Trading has been volatile since the breakout, but the support zone held (blue shading) and I expect higher prices. A rise in IEF translates into lower Treasury yields.
0-30Yr TIPS Bond ETF Leads with Bigger Move
The inflation-protected 0-30Yr TIPS Bond ETF (TIP) is even stronger than IEF. The chart below shows TIP with a strong uptrend with price moving from the lower left towards the upper right. After hitting a new high in early April, TIP corrected with a triangle into June and broke out in late June. The ETF followed through on this breakout the last two weeks and I expect the uptrend to continue (new highs). Key support is set in the 108-109 area (blue shading).
Housing ETFs Follow Bonds with Upswing
The 10-yr Treasury Yield ($UST10Y) fell from 4.6% to 4.2% since late May and this move boosted the housing related ETFs. Even so, I still view these upswings as counter-trend bounces within bigger downtrends. The Home Construction ETF (ITB) is back at its falling 200-day SMA and the Homebuilders ETF (XHB) is just above its falling 200-day SMA. Even though they are showing relative strength since late June, the long-term trends are still down and falling 200-day SMAs act as resistance. Rising channels define the upswings with the blue shadings marking support.
Communication Services SPDR Holds Pennant Breakout
The Communication Services SPDR (XLC) surged from early April to June and then consolidated with a range in July. A high and tight pennant formed in the first half of July and XLC broke out with a surge on July 21st. There was no follow through as the ETF fell back to the pennant lows, thus the consolidation in July. Overall, the pennant is a short-term bullish continuation pattern and the breakout is still holding. A close below the pennant low at 105 would negate the breakout. The rising 200-day SMA and late May pennant mark the next support zone in the 100-102 area.
Send feedback to support(at)trendinvestorpro.com or use the contact form. [1]