Market-ETF Report – Commodity and Crypto Related ETFs in the Leadership Group
Posted By
Arthur Hill, CMT
On
In
Archive |
No Comments
The next report will be on Tuesday, June 24th
Report Headlines
IEF is Range Bound as TIP Trends Higher
GLD Breaks Flag Line
SLV Surges to New Highs
GDX and SIL Pullback after New Highs
Palladium ETF Pulls Back after Breakout
Platinum ETF Extends Even Further
CPER Remains in Choppy Uptrend
Agriculture ETF Consolidates after Breakout
Natural Gas ETF Battles Support Zone
USO Hits Resistance and Becomes Overbought
Bitcoin Extends Short-term Correction
ETF Momentum Ranking
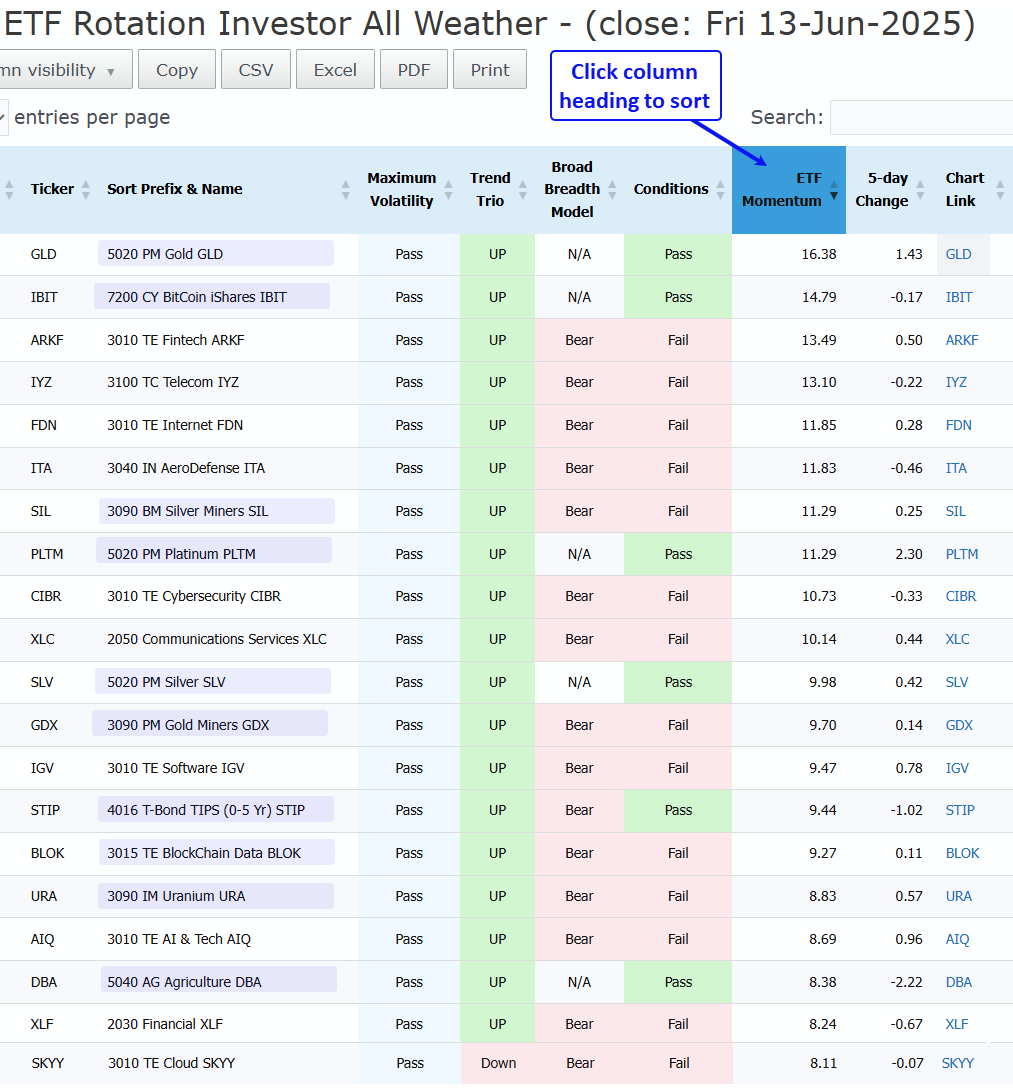
The image below comes from the ETF Rotation Investor ranking table[1], which is updated every Saturday. Hence, the last close is Friday, June 13th. I clicked the ETF Momentum column to sort by this value, putting the momentum leaders at the top. This table shows the 20 ETFs with the strongest momentum (the leaders). Half of these ETFs are related to commodities, bonds and crypto (blue shading). The other half are equity ETFs. GLD and IBIT are the leaders.
IEF is Range Bound as TIP Trends Higher
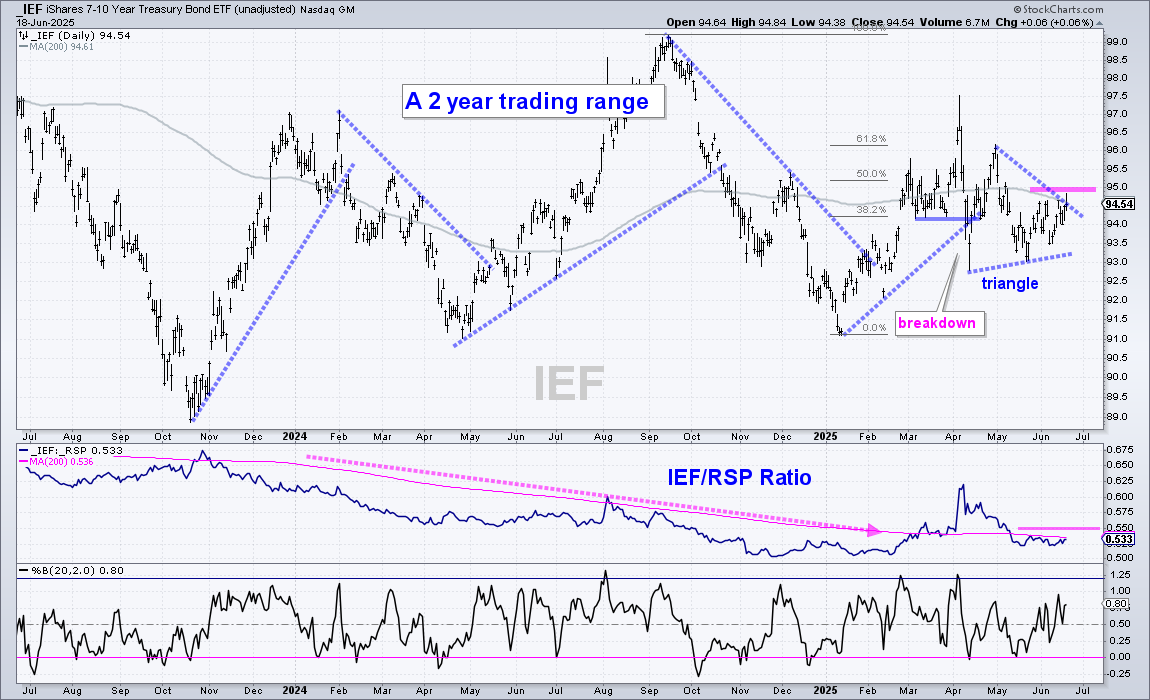
There is no change for the 7-10Yr TBond ETF (IEF), which remains range bound the last two years and the last two months. IEF is currently trading in the middle of both ranges and right at the 200-day SMA, which is flat. It doesn’t get any flatter than this. The most recent signal was the early April breakdown. Trading since this breakdown has been choppy with a narrowing range taking shape (triangle). An upside breakout at 95 would be bullish.
The middle window shows the IEF/RSP ratio moving sideways since mid May. This ratio rises when bonds outperform stocks and falls when stocks outperform bonds. In a normal risk-on environment, bonds should underperform stocks (ratio falls). The ratio fell from early April to mid May as stocks advanced and bonds underperformed. This ratio flattened since mid May as stocks stalled (RSP). A breakout at .55 would show relative strength returning to bonds.
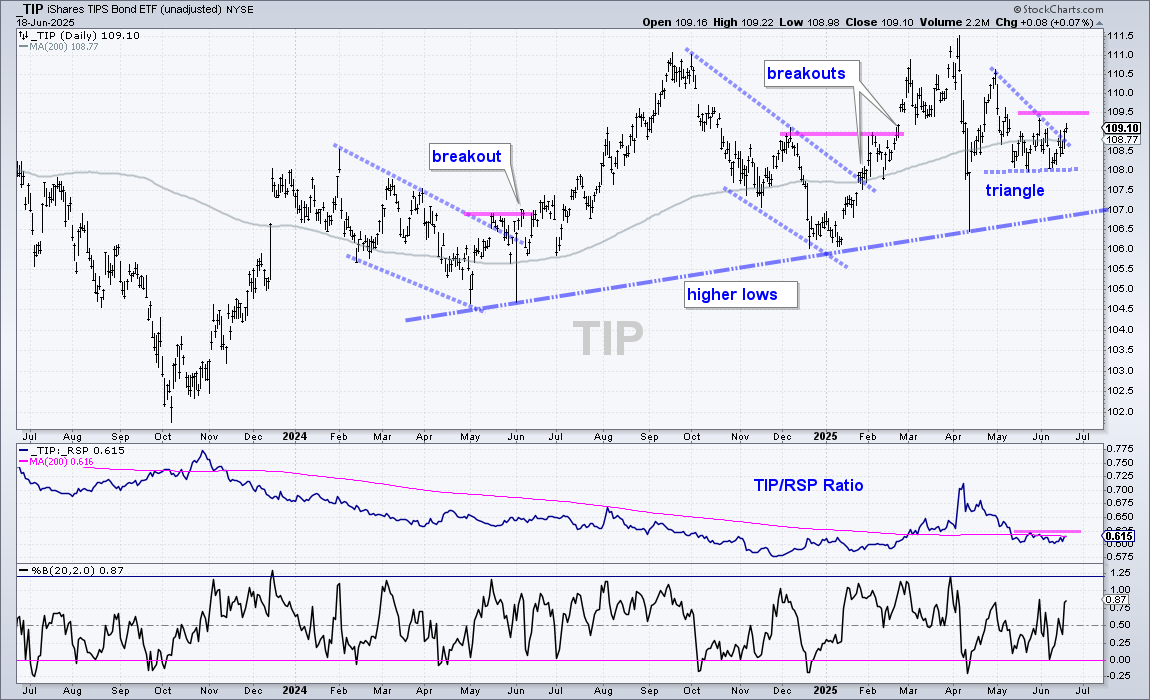
The next chart shows the 0-30Yr TIPS Bond ETF (TIP), which is inflation-protected. TIP is in a long-term uptrend with new highs in September and April. TIP fell back after the early April high and consolidated the last two months. I am marking short-term resistance at 109.5 and a breakout here would be bullish. This would argue for a continuation of the bigger uptrend and target new highs.
GLD Breaks Flag Line
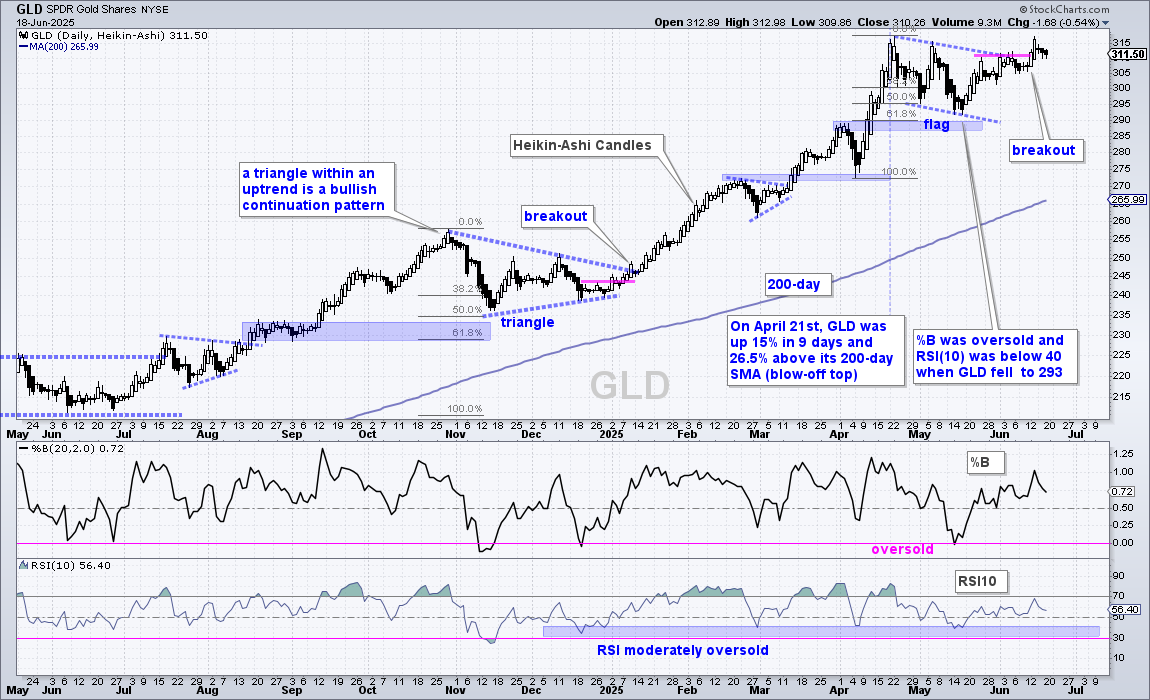
The Gold SPDR (GLD) formed a falling flag into June and broke out with a surge on June 12-13. Keep in mind that these are Heiken-Ashi candlesticks, which combine two days of price action into one candlestick. The long-term trend is up and flags are bullish continuation patterns. This breakout, therefore, signals a continuation higher and new highs are expected.
SLV Surges to New Highs
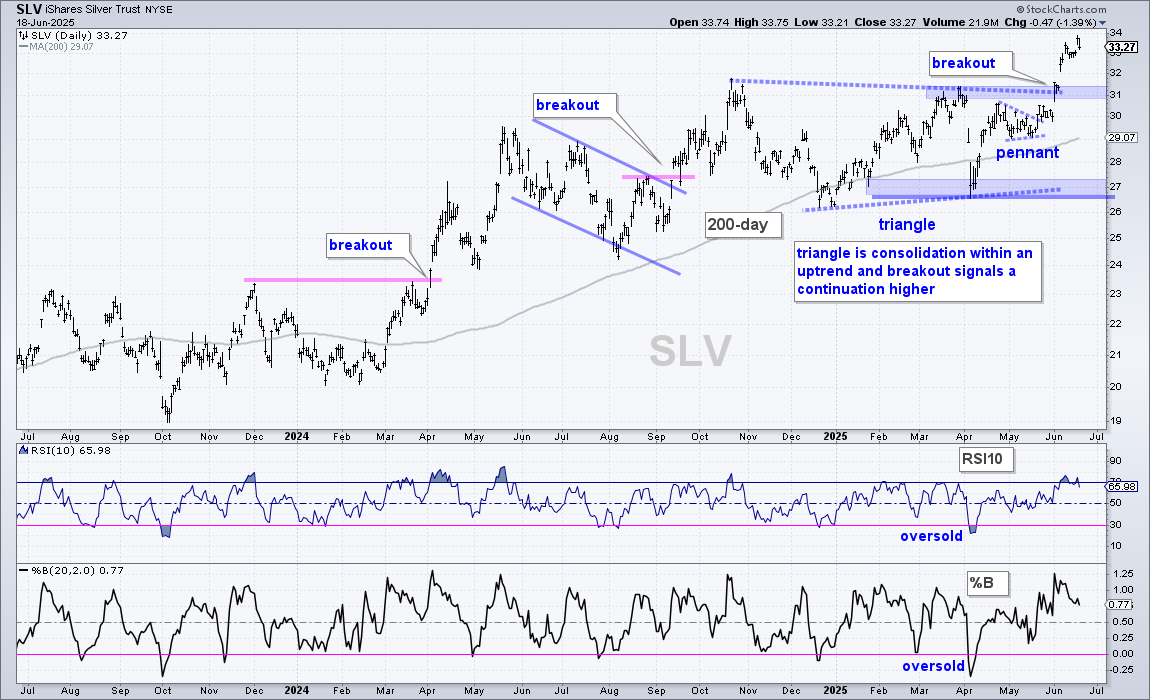
The Silver ETF (SLV) broke out of a pennant on May 21st and broke triangle resistance on June 2nd. SLV also recorded its first new high on June 2nd. The ETF extended higher the last two weeks and hit more new highs. SLV is up around 11% in 13 days and getting stretched. This is not bearish, it just means there is no setup on the chart. Broken resistance in the 31 area turns first support to watch should SLV pull back.
GDX and SIL Pullback after New Highs
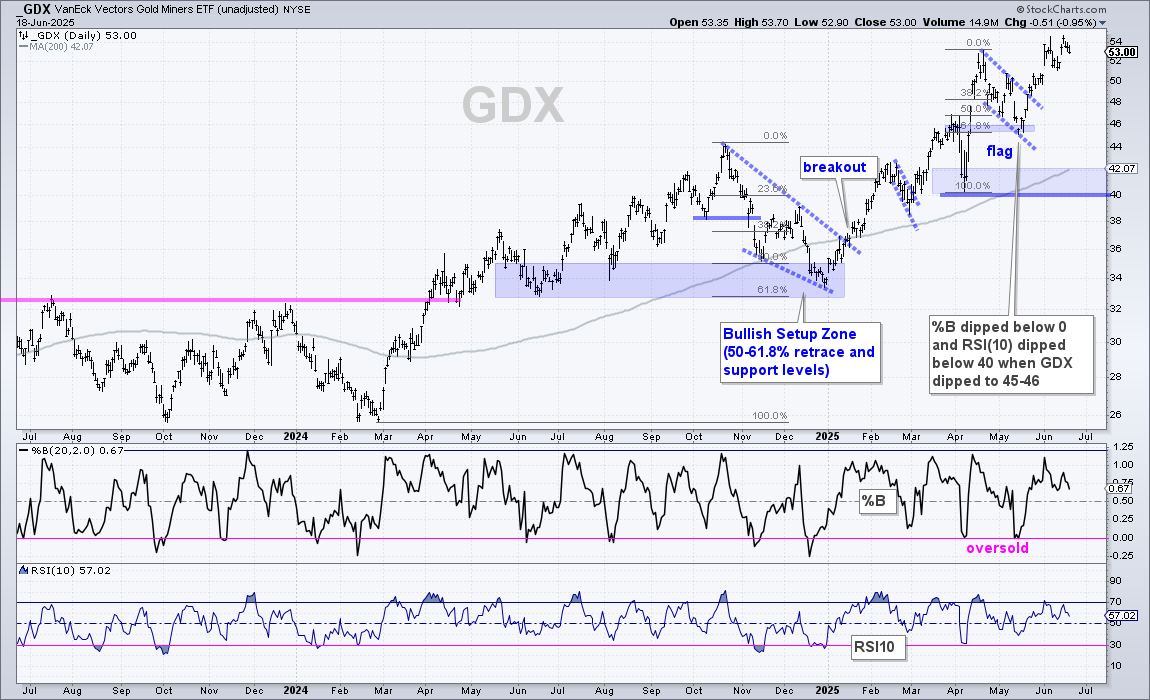
There is no change with the Gold Miners ETF (GDX), which is in the trend-monitoring phase. This means the setup (oversold) and signal (flag breakout) have passed. Now is the time to monitor price action for the next trading setup within the leading uptrend. GDX hit a new high again this week and is up around 16% in five weeks. It is somewhat extended here, but certainly not bearish.
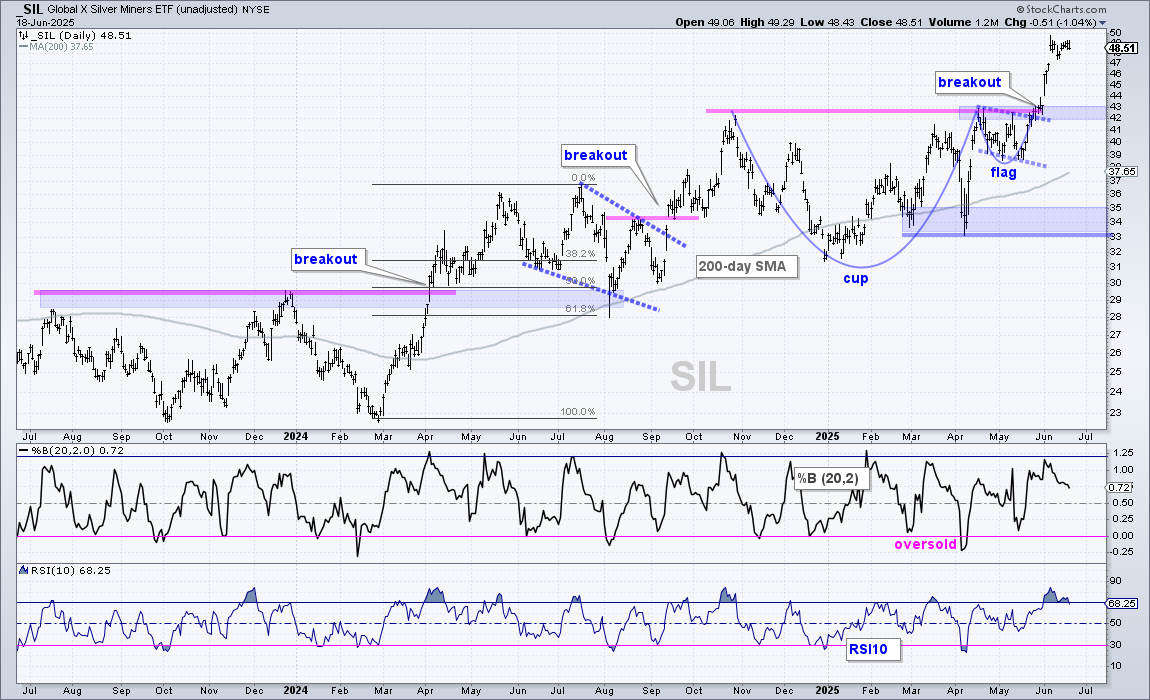
The Silver Miners ETF (SIL) is also in the trend-monitoring phase. SIL broke flag resistance on May 28th and surged in early June. The ETF is up around 24% in five weeks. SIL is also extended short-term, but certainly not bearish. Broken resistance in the 42-43 area turns first support should we see a pull back.
Palladium ETF Pulls Back after Breakout
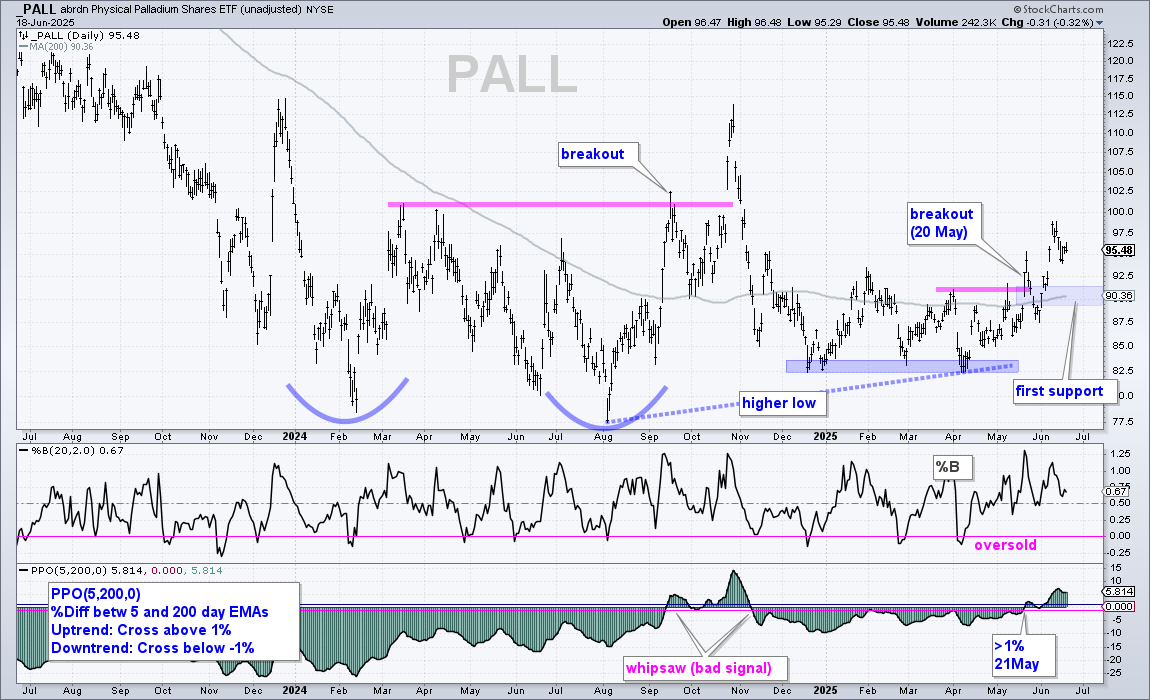
The Palladium ETF (PALL) moved into a long-term uptrend with a breakout in late May and a PPO(5,200,0) cross above +1%. This uptrend signal remains valid until a cross below -1%. PALL hit a new high for 2025 last week and fell back this week. The breakout zone and rising 200-day SMA mark the first support zone to watch for an opportunity (blue shading). I added %B to identify a potential oversold conditions. This indicator becomes moderately oversold with a dip into the 0-.25 area and oversold with a move below 0, which means the close is below the lower Bollinger Band (20,2).
Platinum ETF Extends Even Further
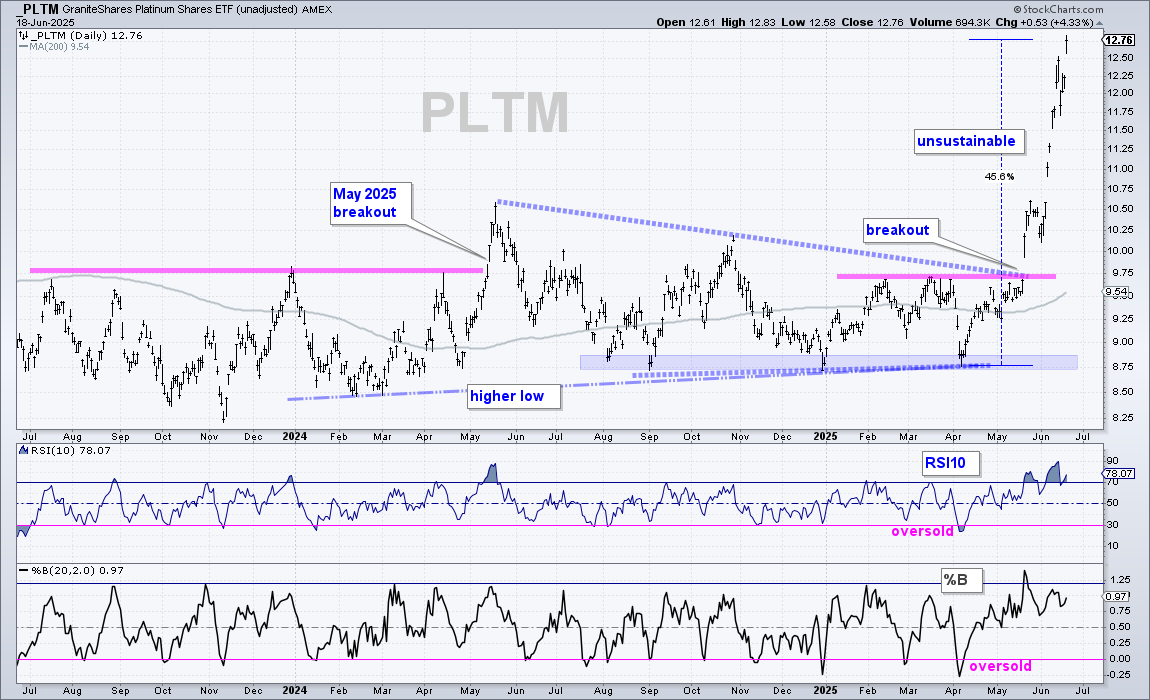
The Platinum ETF (PLTM) extended further and hit another new high this week. With a 4.33% gain on Wednesday, the ETF is up 45% since early April and very extended. Overextended and overbought are not bearish. It just means traders should prepare for a pullback or consolidation. PLTM is also going parabolic, which can be dangerous. The 21-day annualized Standard Deviation is currently 37.5%, which is higher than the Bitcoin ETF (34%) and lower than the Ethereum ETF (59.6%). Volatility cuts both ways. On the chart below, I changed the indicators to %B and RSI to identify short-term oversold conditions in the future, which would opportunities.
CPER Remains in Choppy Uptrend
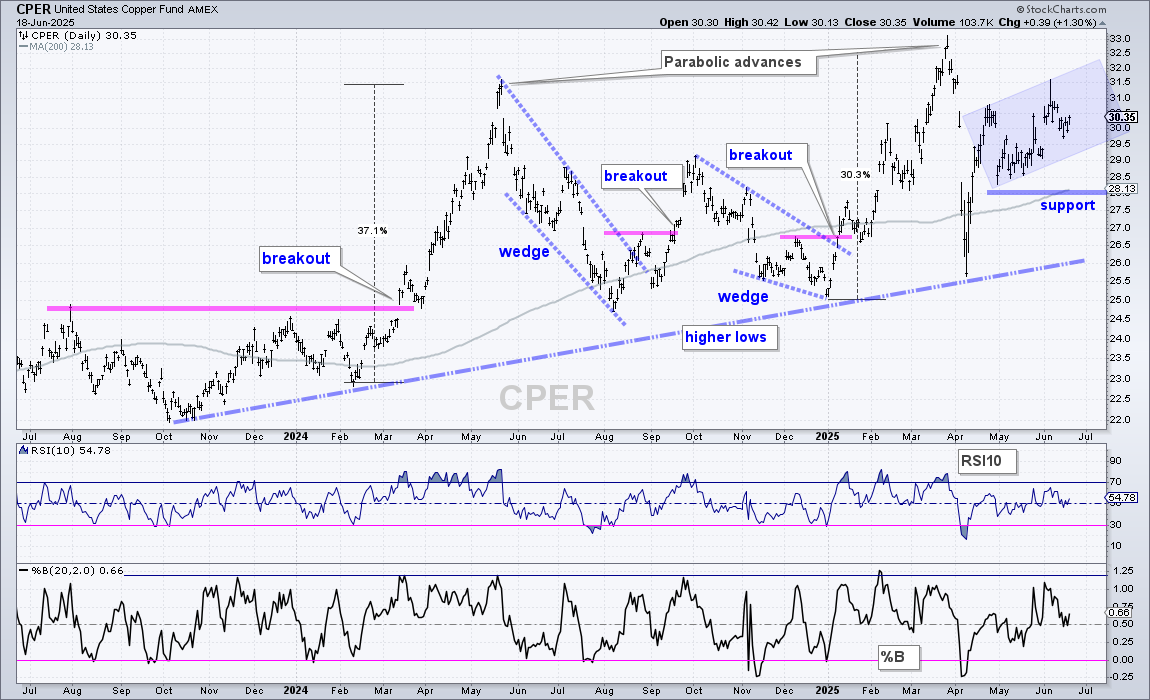
The Copper ETF (CPER) remains in long-term and short-term uptrends. Long-term, CPER is above the rising 200-day SMA with a string of higher lows since early 2024 and a 52-week high in late March. Short-term, CPER surged in the second half of April and worked its way higher in May-June. And I do mean “worked”. Trading has been choppy since late April, but the short-term trajectory remains up (blue shading). Key support is set at 28.
DB Agriculture ETF Consolidates after Breakout
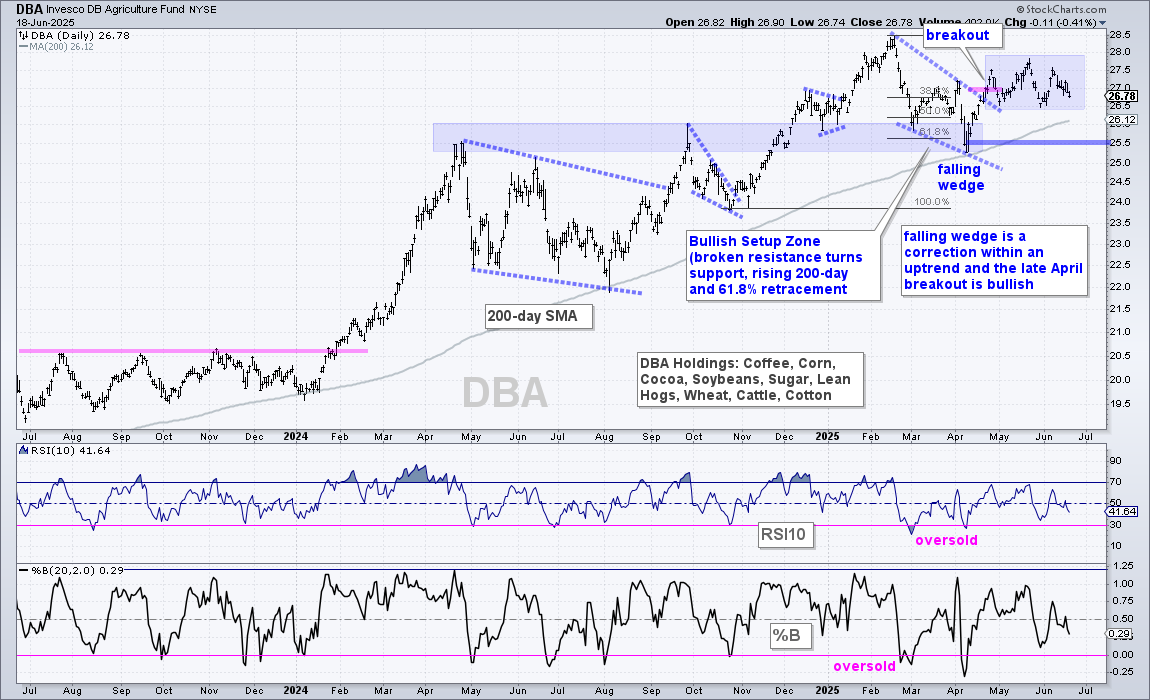
There is no change for the DB Agriculture ETF (DBA), which remains in a long-term uptrend and with a wedge breakout in early April. Long-term, DBA hit a new high in February and price is well above its rising 200-day SMA. Short-term, the ETF corrected with a falling wedge into early April and hit a Bullish Setup Zone. DBA broke out with a surge in late April, but has yet to follow through and remains stuck in a consolidation (blue shading). Despite lack of follow through, the breakout has yet to be negated and remains bullish. Long-term support is set at 25.50.
Natural Gas ETF Gets a Breakout
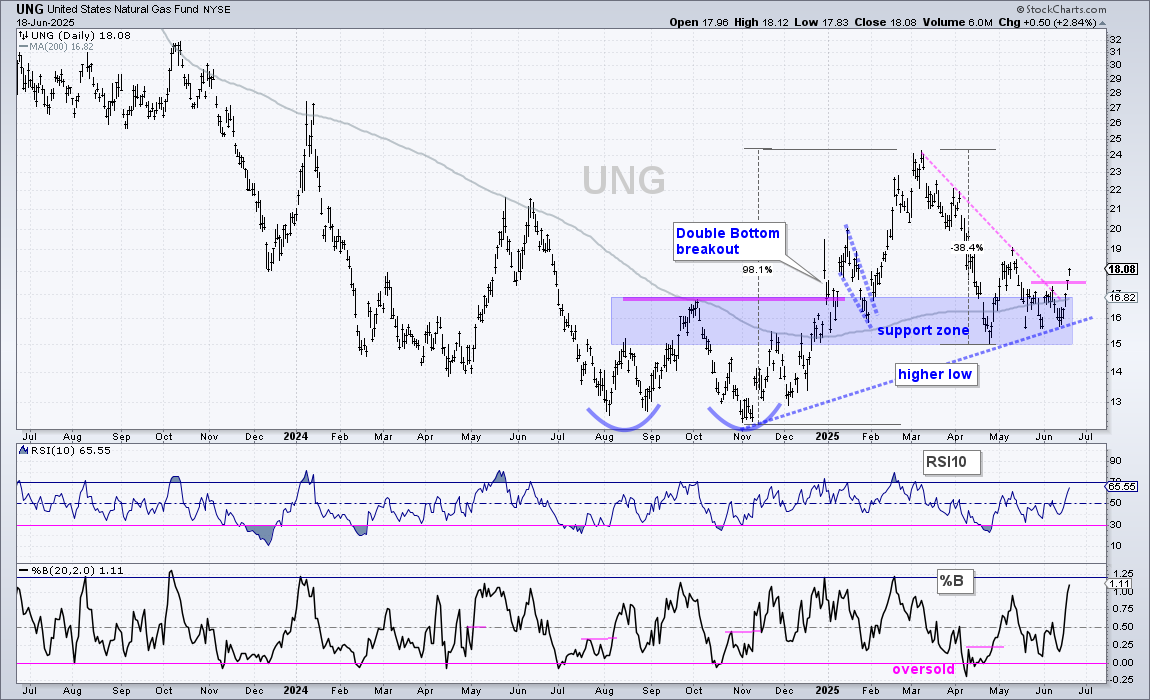
The Natural Gas ETF (UNG) broke resistance at 17.5 with a surge the last four days. Overall, I see a long-term uptrend with a 52-week high in early March, a higher low the last few months and a slightly rising 200-day SMA. UNG fell back to its support zone in late April and stalled for two months. I view the decline from 24 to 15 as a correction after the November-March surge. With the breakout at 17.5, UNG reversed this short-term decline and also signaled a continuation of the long-term uptrend. I will mark re-evaluation support at 15.
USO Hits Resistance and Becomes Overbought
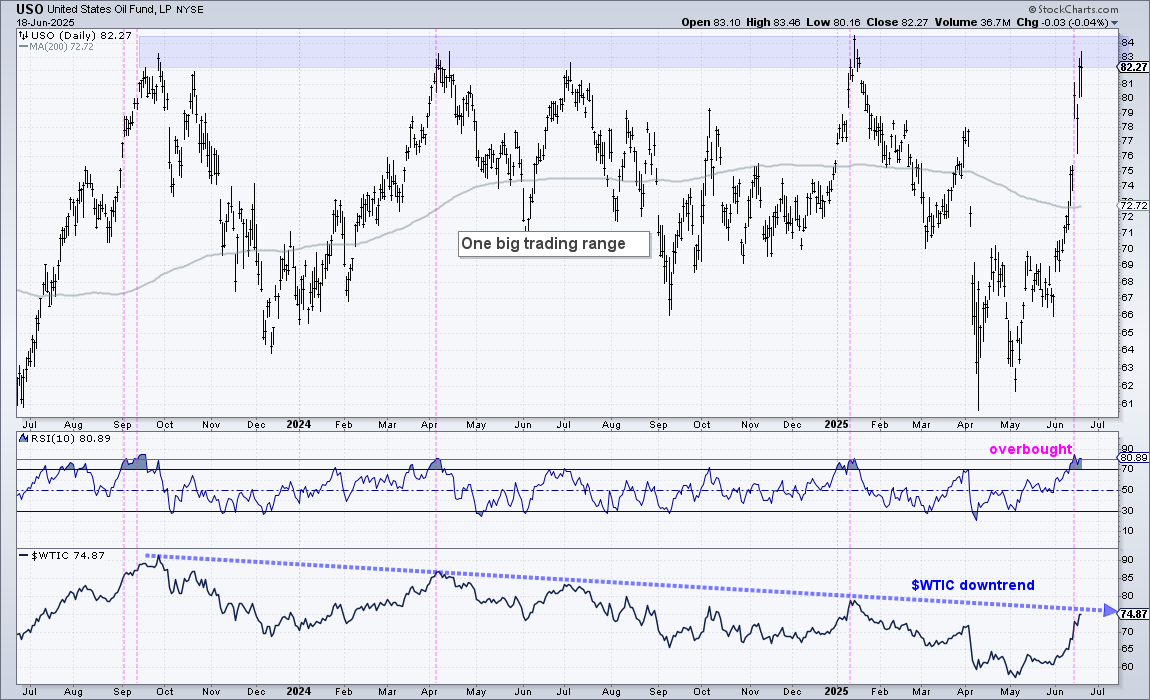
The chart below shows the US Oil Fund (USO) in the main window, RSI(10) and WTI Crude Continuous Futures ($WTIC) in the lower window. First, note that $WTIC is in a long-term downtrend and near the trendline extending down from September 2022. Second, notice that RSI(10) exceeded 80 for the fourth time in two years. This is an extremely oversold condition. Third, notice that USO is pushing against resistance from the prior highs (83-84). I do not short ETFs, stocks or futures contracts and the geopolitics are an issue, but this looks like a short-term overreaction within a long-term downtrend.
Bitcoin Extends Short-term Correction
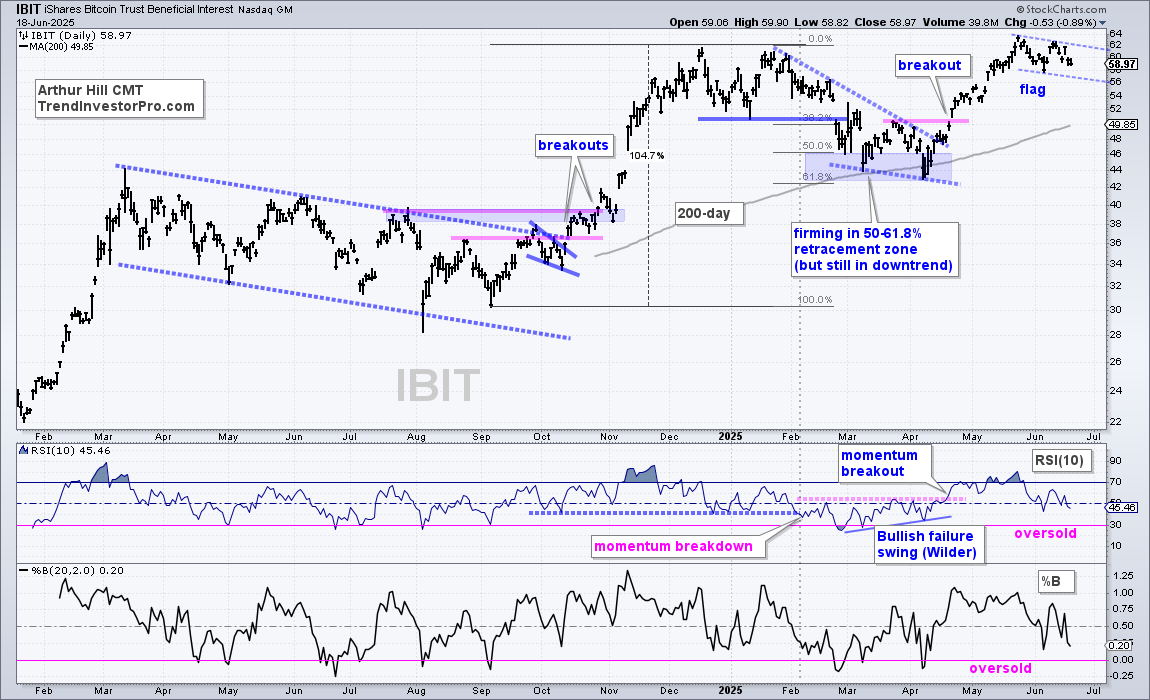
The Bitcoin ETF (IBIT) remains in a long-term uptrend since the wedge breakout in late April. IBIT extended to a new high in late May and then corrected into June with a shallow pullback. A falling flag could emerge here with two areas to watch. First, a breakout at 62 would be bullish and signal a continuation higher. Second, a dip into the 56 area could create a short-term oversold condition. A %B move to 0 and an RSI move to 30 would create an oversold condition.
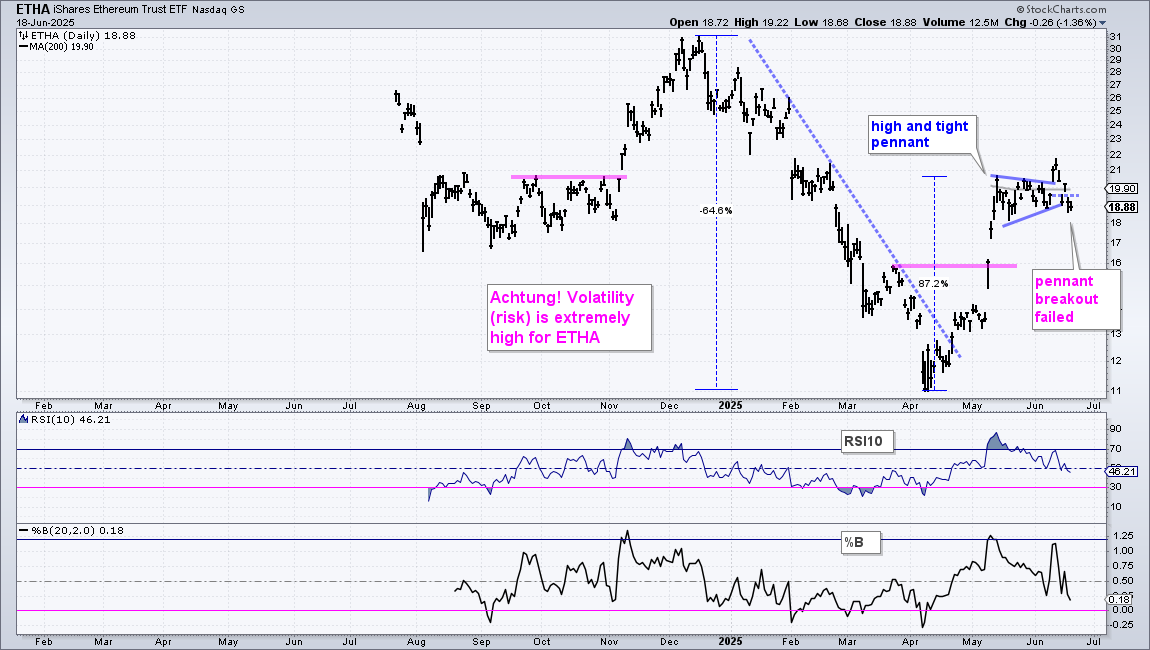
The next chart shows the Ethereum ETF (ETHA) failing to hold its pennant breakout and dipping below its early June low. Bitcoin sneezes and Ethereum catches a cold.
Send feedback to support(at)trendinvestorpro.com or use the contact form. [2]