This Market Regime Page is updated every Wednesday.
An alert will be sent should conditions change between updates
Report Headlines
- Zweig Breadth Thrust Remains Active (bullish)
- SPX 5/200 1% Cross Remains Active (bullish)
- SPY and S&P 500 Breadth: Bearish since March 13th
- QQQ and Nasdaq 100 Breadth: Bearish since March 31st
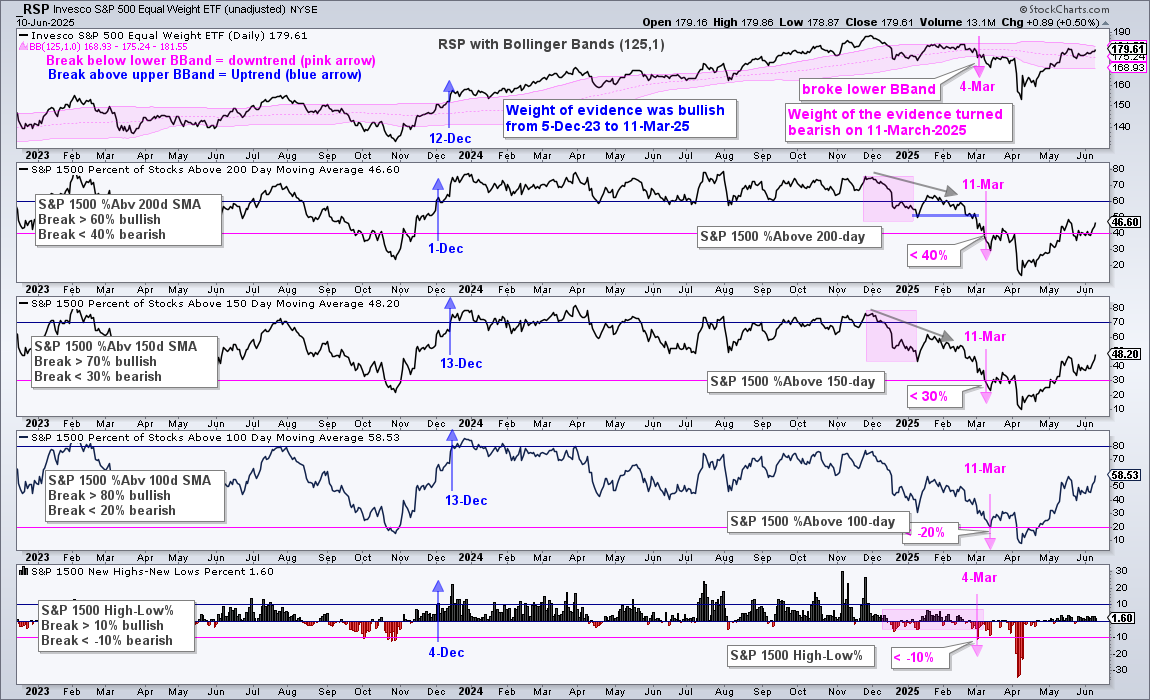
- RSP and S&P 1500 Breadth: Bearish since March 11th.
- Yield Spreads Fall back to March Levels
- 3-month Yield Remains Flat (Fed on Hold)
- 10-yr Yield Breaks Out of Small Wedge
Improvements Continue with One More Hurdle
QQQ and Nasdaq 100 stocks continue to lead the market since the April low. QQQ extended higher and crossed the upper Bollinger Band on Wednesday for an uptrend signal. A breadth indicator also flipped bullish, which means the Nasdaq 100 indicator group is now net bullish (four of five).
As the trend/breadth charts below show, there are three indicator groups totaling 15 indicators. All indicators covering the S&P 500 and S&P 1500 remain with bearish signals, which means 11 of the 15 indicators are bearish. Large-cap tech stocks (QQQ) and, perhaps, large-caps, are bullish, but small and mid cap stocks are still dragging their feet.
The S&P 500 is also mixed with 54.4% of stocks above their 200-day SMAs, which means 46.6% are below their 200-day SMAs. Even though the S&P 500 cup seems half full because over 50% of stocks are in long-term uptrends, 54.4% is not the vast majority of stocks. It is a slim majority. The vast majority of stocks (>60%) are in uptrends during bull markets. This is still a selective bull market, at best.
The technical time line shows a steady improvement since the Zweig Breadth Thrust on April 24th. The long-term trend and breadth indicators are the last hurdle. I am mostly focused on the 5/200 cross for SPY right now. This signal is bullish until the 5-day moves more than 1% below the 200-day SMA.
Technical Event Timeline
- March 13th – Bearish Long-term Breadth and Trend Indicators
- April 4th – Capitulation [1]
- April 24th – Bullish Zweig Breadth Thrust [2]
- April 29th – Bullish Thrust S&P 1500 %Above 20-day SMA [3]
- May 12th – SPY/QQQ Gap above 200-day SMAs
- May 15th – Bullish Cross SPY 5/200 day %Difference > 1% [4]
Zweig Breadth Thrust Remains Active
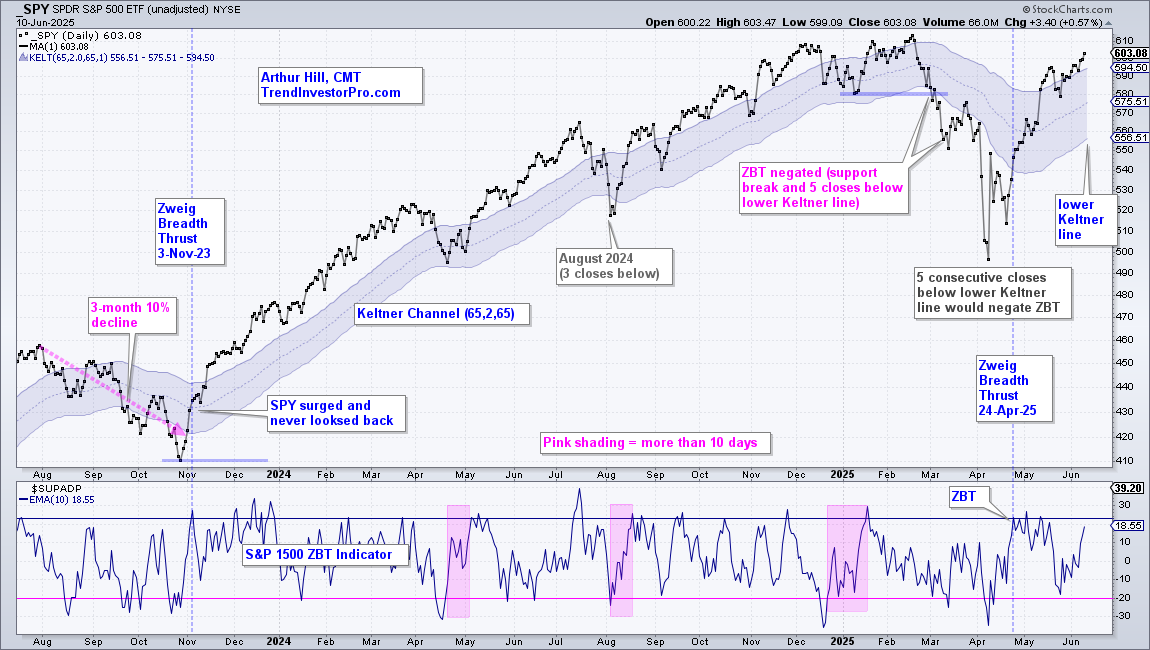
A Zweig Breadth Thrust triggered on April 24th and SPY also moved above the lower Keltner line (65,2,65). As laid out in this strategy report [2], the breadth thrust is bullish as long as SPY holds the lower Keltner line. Five consecutive closes below the lower Keltner line would negate the Zweig Breadth Thrust.
5/200 1% Cross Remains Active (bullish)
The chart below show SPY with the 5-day SMA, the 200-day SMA and the Percentage difference between the two in the indicator window (Percent above MA(5,200,1). A bullish signal triggers when Percent above MA crosses above +1% (blue lines) and the bearish signal triggers with a cross below -1% (pink lines). As with all trend-following indicators and moving average crosses, there will be whipsaws (bad signals) and extended trends (good signals). The 5-day moved more than 1% above the 200-day SMA for a bullish trend signal on May 15th. This signal remains valid until the 5-day is more than 1% below the 200-day SMA. See this research report [4] on the 5/200 day SMA cross for SPY, QQQ, MDY and IJR.
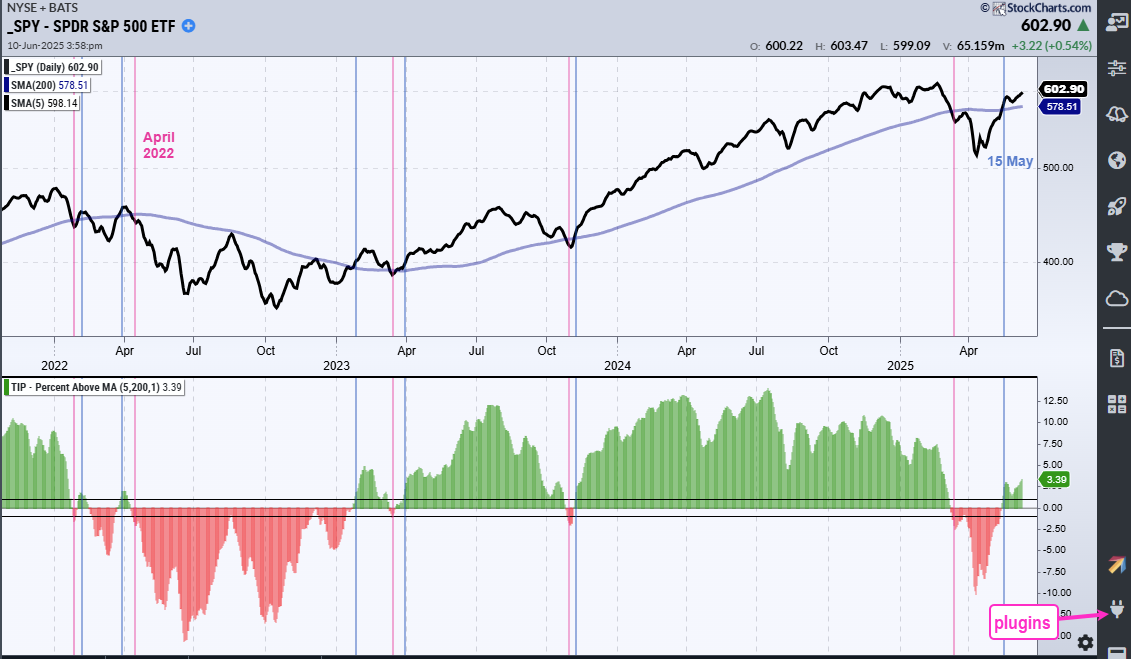
This indicator is one of eleven in the TIP Indicator Edge plugin for StockCharts ACP. [5]
SPY and S&P 500 Breadth: Net Bearish since March 13th
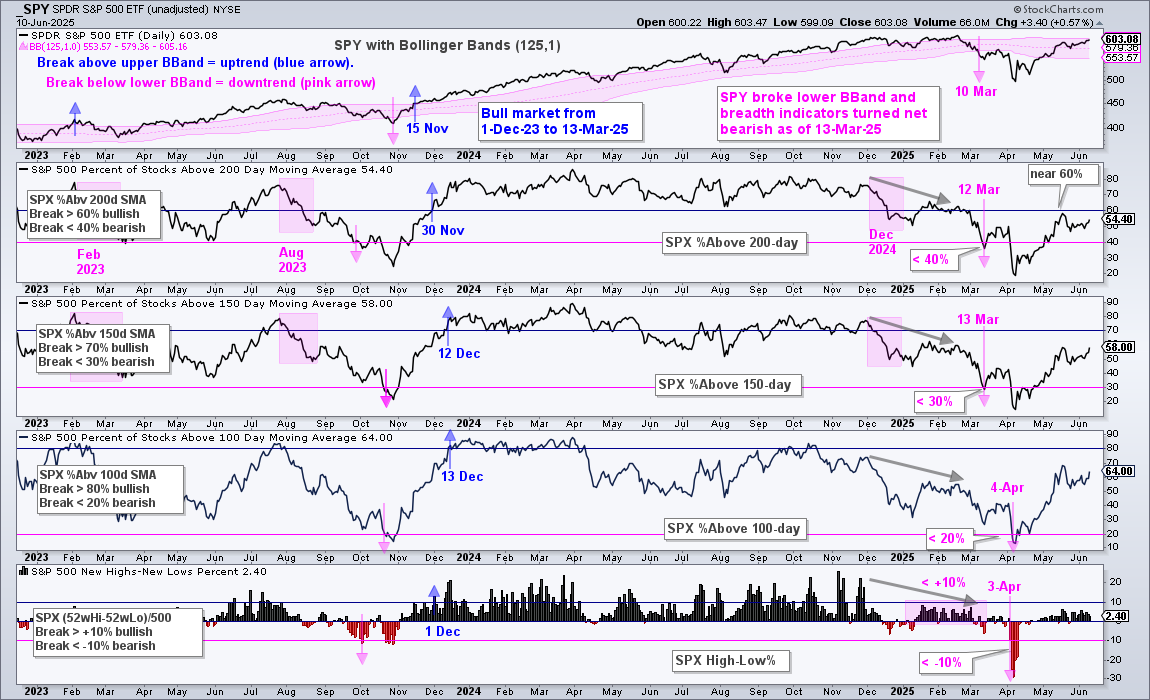
SPY and S&P 500 breadth turned net bearish on March 13th. Breadth indicators became extremely oversold in early April and then rebounded with a vengeance into mid May as SPX %Above 200-day SMA came close to 60%. A cross above 60% is needed to turn bullish. This would mean the vast majority of S&P 500 stocks are above their 200-day SMAs (long-term uptrends).
Active Signals: Bears 5 – Bulls 0
- Bearish: SPY broke the lower Bollinger Band (125,1) on March 10th
- Bearish: SPX %Above 200-day broke below 40% on March 12th
- Bearish: SPX %Above 150-day broke below 30% on March 13th
- Bearish: SPX %Above 100-day broke below 20% on April 4th
- Bearish: SPX High-Low Percent Hit -10% on April 3rd
About the Major index ETFs and Breadth Signals
The top window on each breadth chart shows the corresponding major index ETF with Bollinger Bands (125,1). An uptrend signals when the ETF breaks above the upper Bollinger Band and a downtrend signals with a break below the lower band. The index ETFs are the S&P 500 SPDR (SPY), Nasdaq 100 ETF (QQQ) and S&P 500 EW ETF (RSP).
Each index has four breadth indicators. SPY uses S&P 500 breadth, QQQ uses Nasdaq 100 breadth and RSP uses S&P 1500 breadth.
- The percentage of stocks above the 200-day SMA triggers bullish with a move above 60% and bearish with a move below 40%.
- The percentage of stocks above their 150-day SMAs triggers bullish with a move above 70% and bearish with a move below 30%.
- The percentage of stocks above their 100-day SMAs triggers bullish with a move above 80% and bearish with a move below 20%.
- High-Low Percent triggers bullish with a move above +10% and bearish with a move below -10%. High-Low Percent is the percentage of stocks making 52-week highs less the percentage making 52-week lows.
These bullish/bearish signal thresholds are designed to identify significant changes in the stock market (bull market or bear market). As trend-following signals, they will lag and there will be whipsaws. Long-term, these signals keep us on the right side of the market. The idea is to be invested during bull markets (risk-on) and in cash during bear markets (risk-off).
QQQ and Nasdaq 100 Breadth: Bullish since June 10th
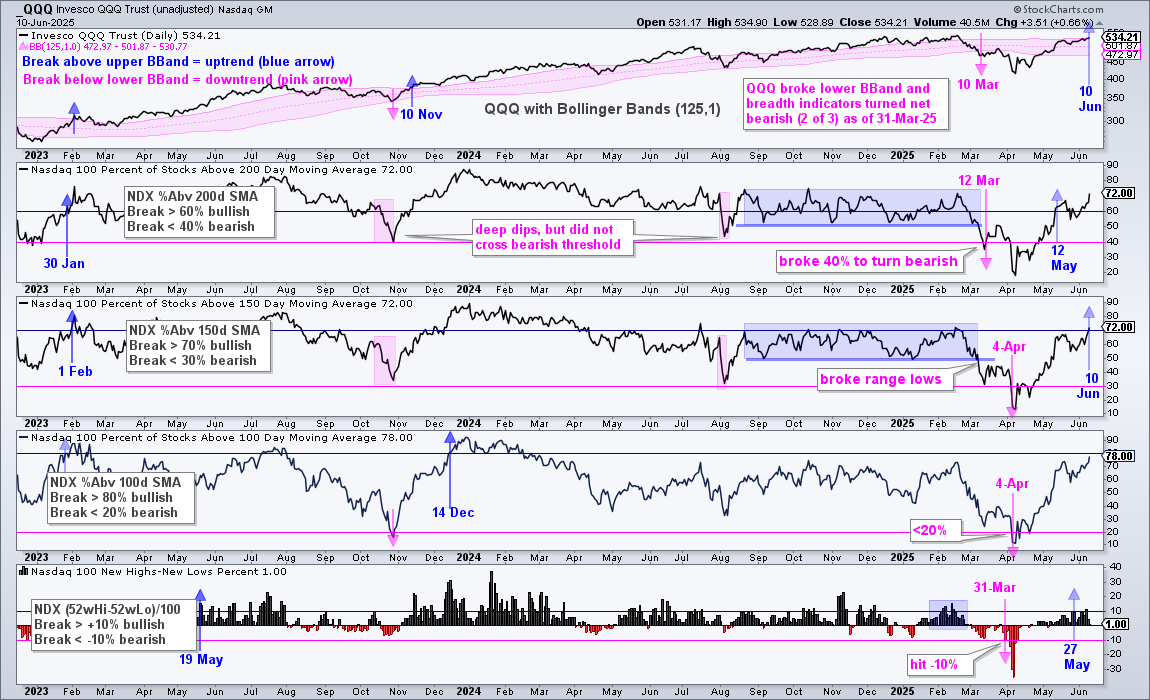
Four of the five indicators are bullish as Nasdaq 100 stocks continue to lead the market. Most recently, QQQ closed above the upper Bollinger Band for a trend signal and $NDX %Above 150-day broke above 70%. Previously, NDX %Above 200-day SMA ($NDXA200R) exceeded 60% on May 12th and Nasdaq 100 High-Low% ($NDXHLP) hit +10% on May 27th.
Active Signals – 4 Bullish and 1 Bearish:
- Bullish: QQQ broke the upper Bollinger Band (125,1) on June 10th
- Bullish: NDX %Above 200-day broke above 60% on May 13th
- Bullish: NDX %Above 150-day broke above 70% on June 10th
- Bearish: NDX %Above 100-day broke below 20% on April 4th
- Bullish: NDX High-Low Percent Hit +10% on May 27th.
RSP and S&P 1500 Breadth: Bearish since March 11th.
No change. RSP and S&P 1500 breadth turned net bearish on March 11th and all five indicators are currently bearish. S&P 1500 breadth remains the weakest of the three because fewer than 50% of component stocks are above their 200 and 150 day SMAs. Mid-caps and small-caps are lagging and weighing within the S&P 1500.
Active Signals – 5 Bearish and 0 Bullish:
- Bearish: RSP broke the lower Bollinger Band (125,1) on March 4th
- Bearish: S&P 1500 %Above 200-day broke below 40% on March 11th
- Bearish: S&P 1500 %Above 150-day broke below 30% on March 11th
- Bearish: S&P 1500 %Above 100-day broke below 20% on March 11th
- Bearish: S&P 1500 High-Low Percent broke below -10% on March 4th
Yield Spreads Fall back to March Levels
The chart below shows SPY, the Junk Bond Spread ($$HYIOAS) and the BBB Bond Spread ($$BBBOAS). Yield spreads narrowed as stocks advanced from early April to June. The Junk Spread is back to its 200-day SMA and the BBB spread is below its 200-day SMA. This narrowing shows confidence in the credit markets and is bullish for stocks. The pink lines mark levels to watch for an upturn (widening) that would be negative for stocks (3.5 on the Junk Spread and 1.25 on the BBB spread).
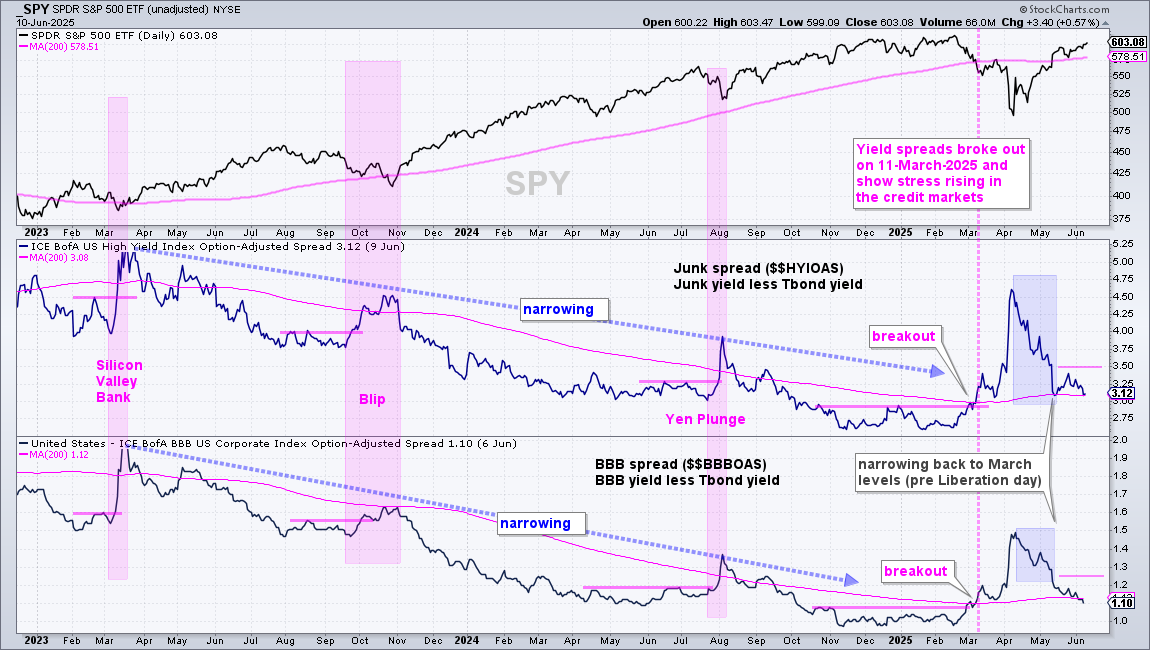
The yield spread is the difference between the Junk Bond Yield or BBB Bond Yield and a comparable Treasury Bond Yield. Junk and BBB bonds represent risk assets, while Treasuries represent relative safe-havens. The spread is the risk premium for holding the riskier assets. Narrow/narrowing spreads show confidence and this is bullish for stocks. Wide/widening spreads show stress and this is negative for stocks.
3-month Yield Remains Flat (Fed on Hold)
No change. The 3-month Treasury Yield ($UST3M) continues to trade with a tight range, signaling that the Fed is on hold. A breakout at 4.5% would argue for a more hawkish Fed, while a break below 4.2% would argue for a move dovish Fed.
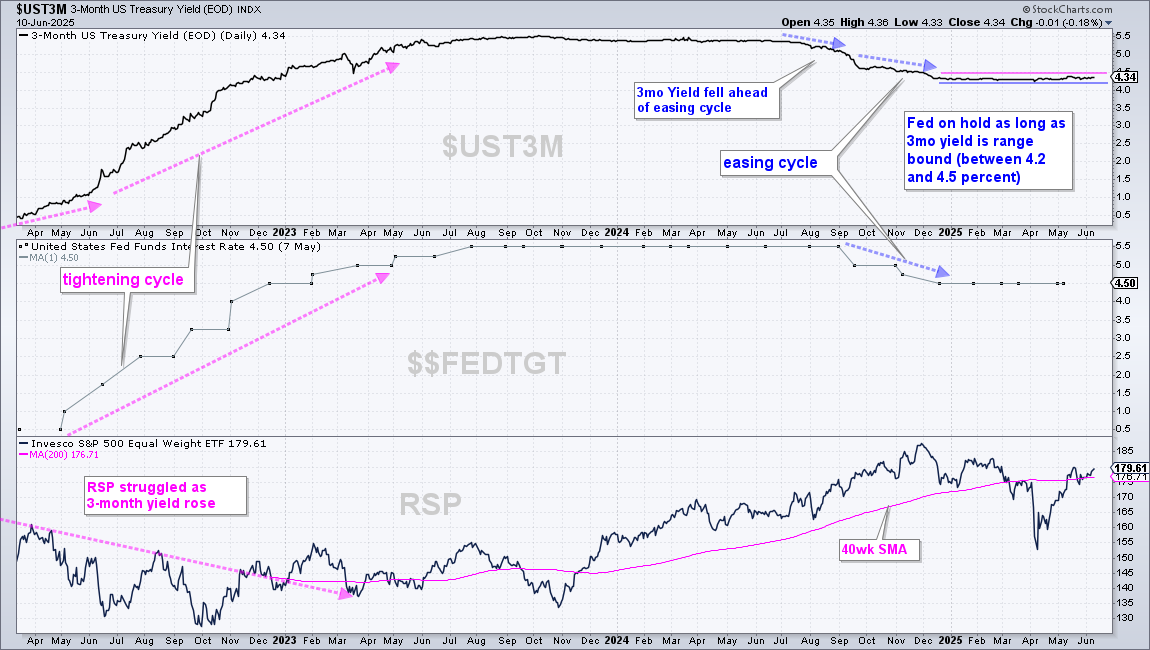
The middle window shows the Fed Funds Target Rate ($$FEDTGT) falling from September to December as the Fed cut rates (dovish). This Fed Funds target rate flattened this year, but has yet to turn up, which means the Fed has yet to raise rates (officially change their stance).
Several factors influence short-term Treasury yields, but they are still closely aligned with Fed policy and often lead the Fed. This means the yield often peaks (troughs) and turns down (up) before the Fed starts to lower (raise) rates. We use the 3-month Treasury yield to identify current Fed policy and anticipate the next Fed move
10-yr Yield Breaks Out of Small Wedge
The 10-yr Treasury Yield ($UST10Y) is in a long-term uptrend since the late December breakout. After this breakout, the yield retraced around 61.8% with a correction into March and broke out again in April. Most recently, a small falling wedge formed into early June and $UST10Y broke out with a surge above 4.5% last week. With this breakout surge, I am marking support at 4.30%. A move below this level would break support and negate the April breakout. A bullish stance on the 10yr Yield translates into a bearish stance for the 7-10Yr TBond ETF (IEF).
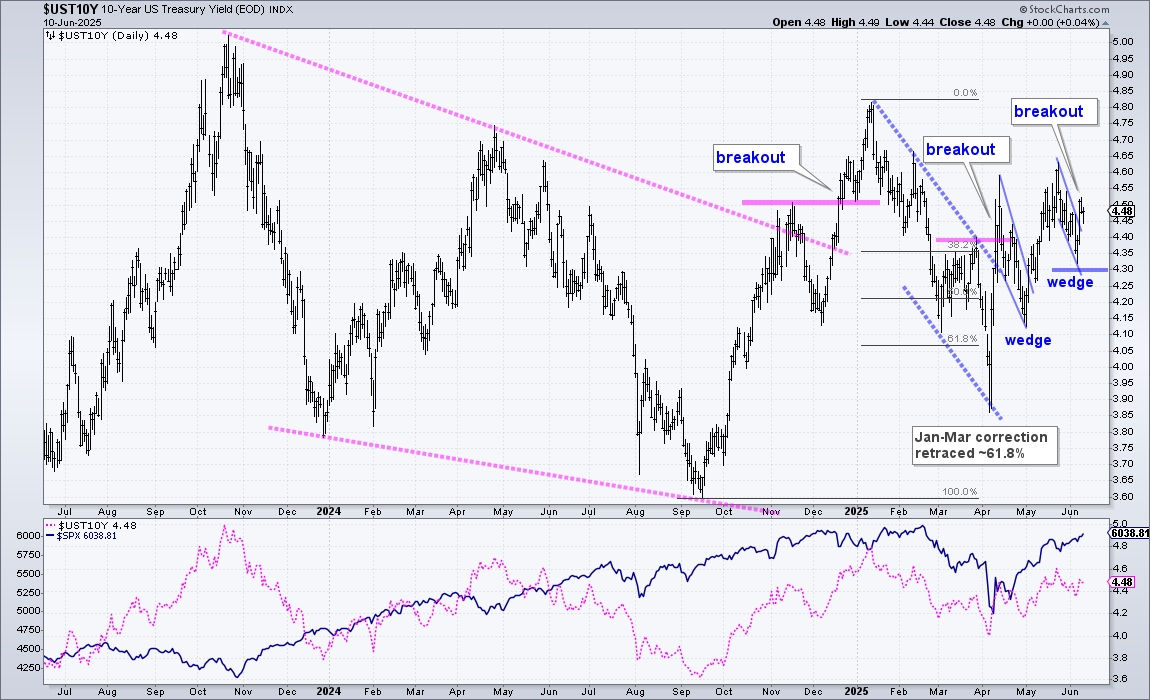
The 10-yr Treasury Yield the most important benchmark for long-term rates and mortgages. Several factors influence long-term Treasury yields: growth expectations, inflation expectations, government debt levels, tariffs and foreign bond holders. The 10-yr Treasury Yield typically falls when the economic outlook dims and/or inflation expectations rise. Conversely, the yield typically rises when the economic outlook is bright and/or inflation expectations fall.