The next report will be on Tuesday, May 27th
Palladium and Platinum Break Out
PGM stands for the platinum group of metals, which includes ruthenium, rhodium, palladium, osmium, iridium and platinum. These metals have similar properties and are usually found together when mining. Palladium is a key metal for catalytic converters, and is also used in electronics and dental alloys. Platinum is mostly used for jewelry, and also for catalytic converters.
Note that we covered the Gold SPDR (GLD), Silver ETF (SLV), Gold Miners ETF (GDX), Silver Miners ETF (SIL) and Copper ETF (CPER) in Thursday’s report. [1]
The Palladium ETF (PALL) and Platinum ETF (PLTM) caught my eye because both surged and broke out this week. PLTM hit a 52-week high and PALL hit a new high for 2025. Before looking at the charts, note that these ETFs are not the most liquid, but daily volume averaged over 200,000 for each this week. Second, note that these ETFs have above average volatility (risk).
The first chart shows PALL with a large base forming since February 2024. The ETF bottomed in the 77-80 area in February-August 2024, and then broke out in September-October. This breakout did not last long as the ETF plunged into November and broke its 200-day SMA. Despite this breakout failure, PALL held above its 2024 lows this year and consolidated with support in the 82.5 area (blue shading). It surged above the March high this week for a breakout.
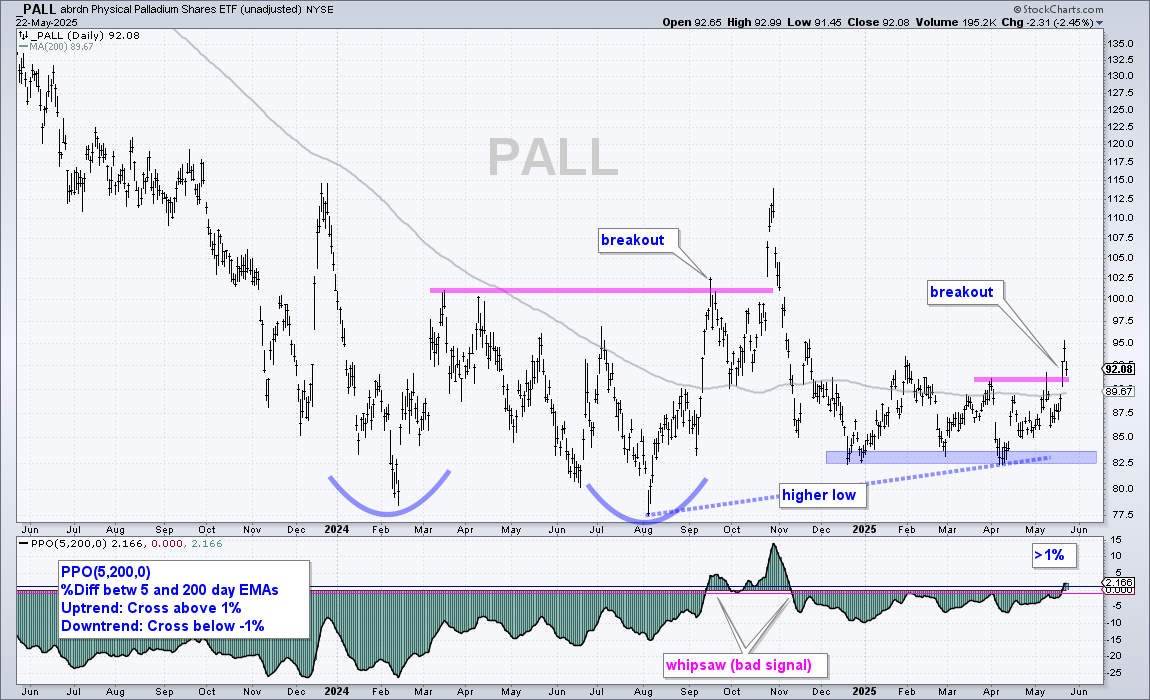
The indicator window shows the PPO(5,200,0), which is the percentage difference between the 5 and 200 day SMAs. A move above 1% signals an uptrend, while a move below -1% signals a downtrend. There was an ugly whipsaw from September to November with the failed breakout. I estimate that this trade lost around 13%. After laying low for several months, the PPO surged above +1% for a bullish trend signal. This signal remains valid until the PPO moves below -1%.
The next chart shows the Platinum ETF (PLTM) trading between 8.2 and 10.6 for two years. Unsurprisingly, the ETF crossed its 200-day SMA over a dozen times and the PPO(5,200,0) produced a series of whipsaws (bad signals). Trend-following indicators need extended trends to work and PLTM never developed an extended trend. Perhaps that is about to change.
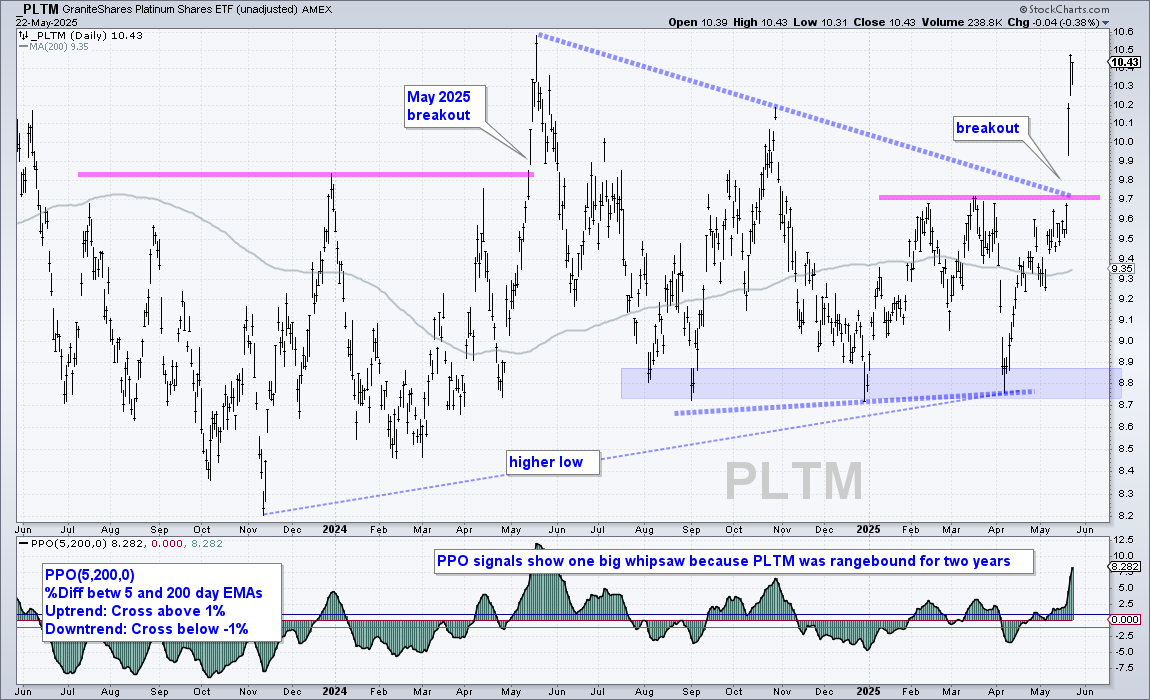
Overall, I see a higher high and breakout in May 2024, a decline into August and lots of support in the 8.8 area (blue shading). The 2025 low is above the 2024 low for a higher low. Thus, we have higher highs and higher lows working since November 2023. Most recently, PLTM broke out at 9.7 with 9+ percent surge this week. Of course, the May 2024 surge was also strong – and it failed. This is the risk. The breakout zone in the 9.7-9.8 area turns first support should we get a pullback. This area could offer a second chance to partake in the breakout.
Send feedback to support(at)trendinvestorpro.com or use the contact form. [2]