Market-ETF Report – Large-caps Lead – New Highs in XLI and ITA – Utes Extend on Breakout
Posted By
Arthur Hill, CMT
On
In
Archive |
No Comments
The next report will be on Wednesday, May 21th
Report Headlines
Thrust Signals and 5/200 Cross Active
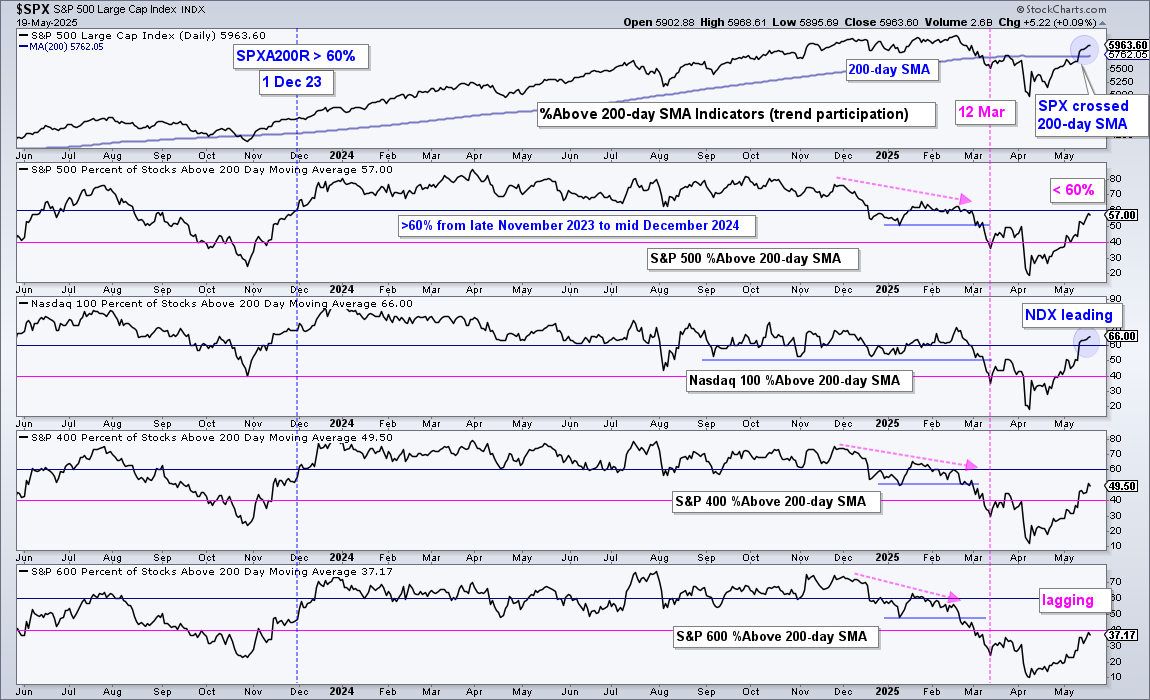
%Above 200-day SMA Indicators Still Short
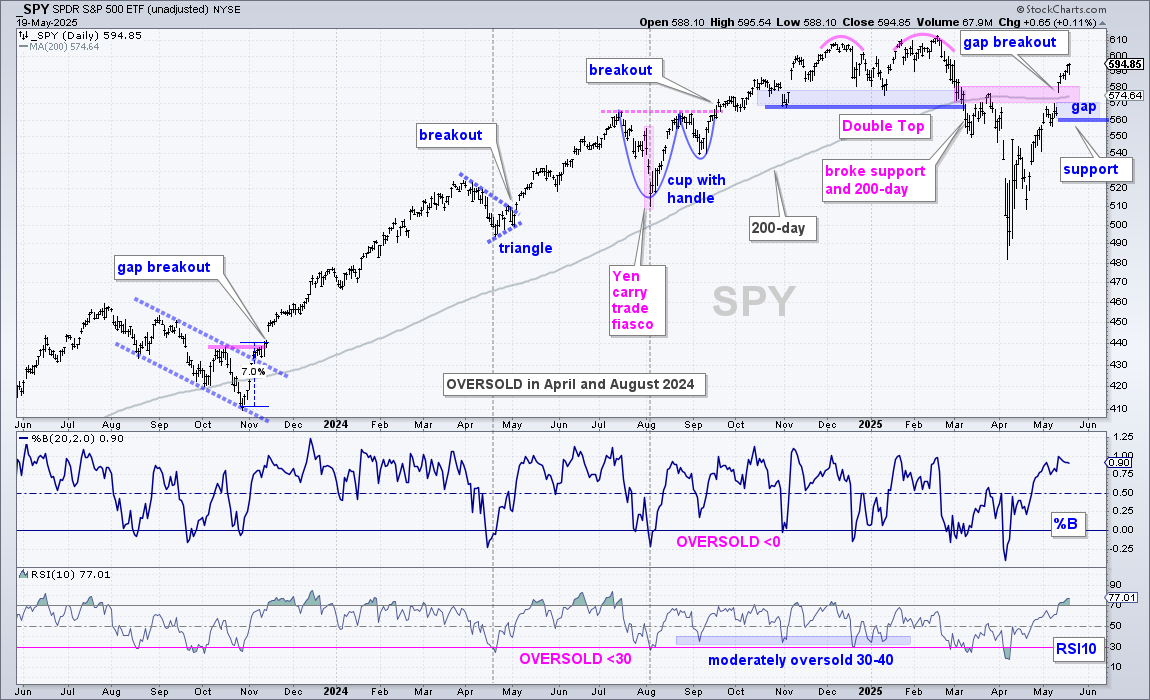
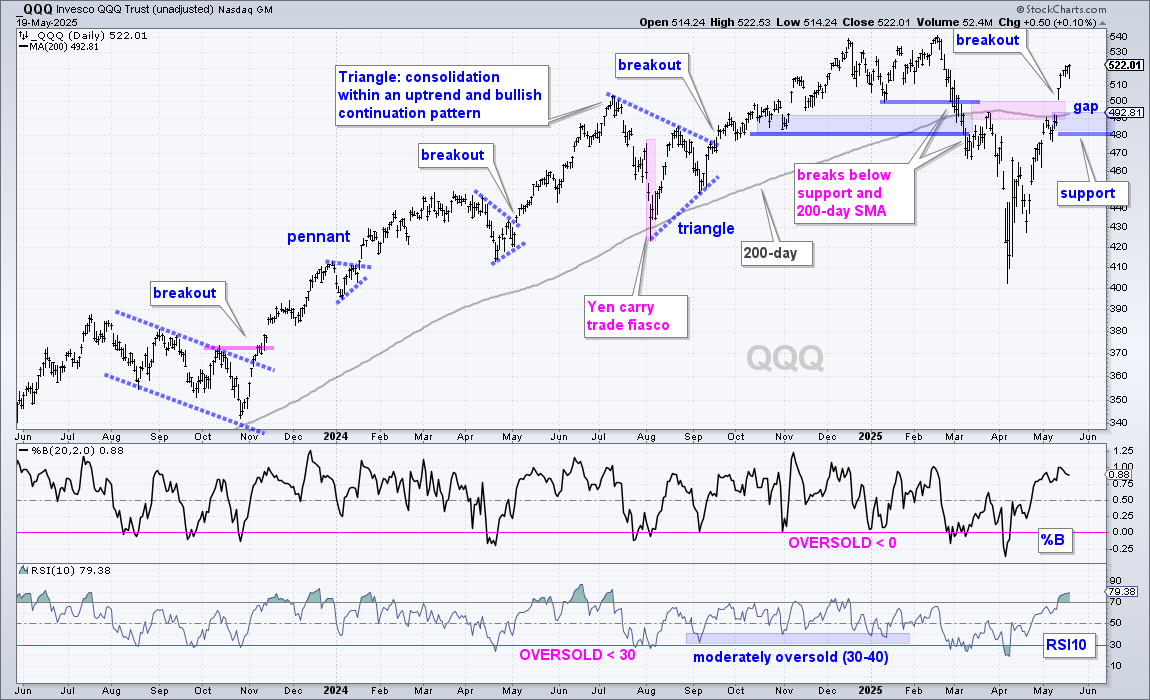
SPY, QQQ and XLK Hold Gap Breakouts
ETFs at or within 5% of a 52-week High
Aerospace & Defense Powers XLI Higher
Cybersecurity and AI ETFs Lead within Technology
Fintech and Software Extend on Breakouts
Semiconductor ETF Holds Above 200-day SMA
Utilities SPDR Extends on Breakout
Medical Devices ETF Extends after Recovering
Telecom ETF: Old Support Becomes New Support
Stocks Extend on Thrust Signals
The bullish evidence continues to build, but the long-term breadth indicators have yet to turn net bullish. SPY and QQQ showed signs of capitulation in early April and rebounded into mid April. A Zweig Breadth Thrust triggered on April 24th and several other thrust indicators turned bullish in May. We also saw SPY, QQQ and RSP break their 200-day SMAs.
These are bullish indications for large-caps and, perhaps, stocks in the S&P 500. However, I will not call it a “bull” market until the long-term breadth indicators turn net bullish. For starters, the percentage of stocks above their 200-day SMA needs to clear 60%. Nasdaq 100 stocks are doing their part as $NDXA200R is at 66%. $SPXA200R is at 57% and getting close. A move above 60% means the vast majority of stocks are in long-term uptrends, and this signals a bull market.
Tactically, stocks are short-term overbought after big moves the last six weeks. It is difficult to time a pullback, but the odds for a short-term pullback or trading range are above average. In general, I will be watching the gaps from Monday, May 12th. Short-term pull backs into these gap zones could provide an opportunity. An opportunity would turn into a threat should the pullback extend and fill these gaps.
The chart below shows SPY over the last two years for more perspective. First, note that the 2024 bull run started with a 7% surge off the late October 2023 low and a gap-breakout on November 14th. There was also a Zweig Breadth Thrust on November 3rd and the Market Regime indicators turned net bullish on December 1st. Currently, we have Zweig Breadth Thrust on April 24th and a 5/200-day SMA cross on May 12th, but the Market Regime indicators remain net bearish. Even so, the bullish evidence continues to stack up. Note that the Market Regime indicators are trend-following indicators that lag at market turns.
A strong breakout should hold and I am setting support at 560. A close below 560 would fill the 12-May gap and break the 200-day SMA. Pullbacks are viewed as opportunities after breakouts. The first support zone is around 570, which is an area to watch on any pullback. Short-term, SPY is overbought, but the ETF was also overbought in mid November 2023. And never looked back. The November breakout is an example of a thrust, overbought conditions and extended overbought conditions.
The next chart shows QQQ with similar characteristics. The gap and breakout zone turn first support in the 490 area. A pullback to this area could offer an opportunity. A close below 480 would fill the gap and break the 200-day SMA. This would negate the breakout surge and call for a re-evaluation.
The next chart shows the Technology SPDR (XLK) with the gap zone in the 220 area and support marked at 215. As with most ETFs, XLK is short-term overbought after the six week surge. A pullback in the gap zone would alleviate this overbought condition and could provide an opportunity. The middle window shows the price-relative turning up in April and breaking the July trendline in May. XLK is returning to relative strength.
ETFs at or within 5% of a 52-week High
The pecking order for the major index ETFs shows relative strength in large-cap techs and relative weakness in small-caps. QQQ is the strongest, followed by SPY. The S&P 500 EW ETF (RSP) is in the middle with the S&P MidCap 400 SPDR (MDY) in the bottom half and the Russell 2000 ETF (IWM) bringing up the rear.
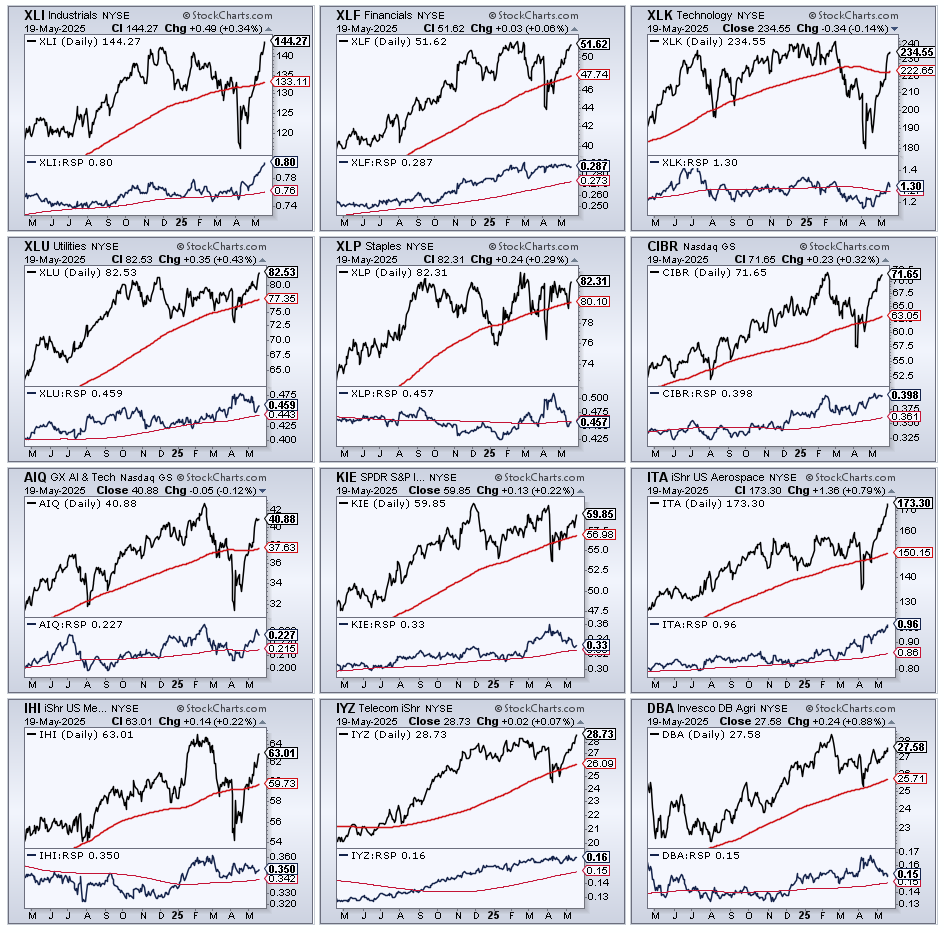
16 of the 72 ETFs in my focus list are within 5% of a 52-week high (255 days). These include QQQ, SPY and the S&P 500 EW ETF (RSP). Among the sectors, we are seeing leadership in Industrials, Finance, Technology, Utilities and Staples. Industry group leaders include CyberSecurity, AI, Insurance, Defense, Medical Devices and Telecom. The DB Agriculture ETF (DBA) and the Bitcoin ETF (IBIT) are leading alternative assets.
Aerospace & Defense Powers XLI Higher
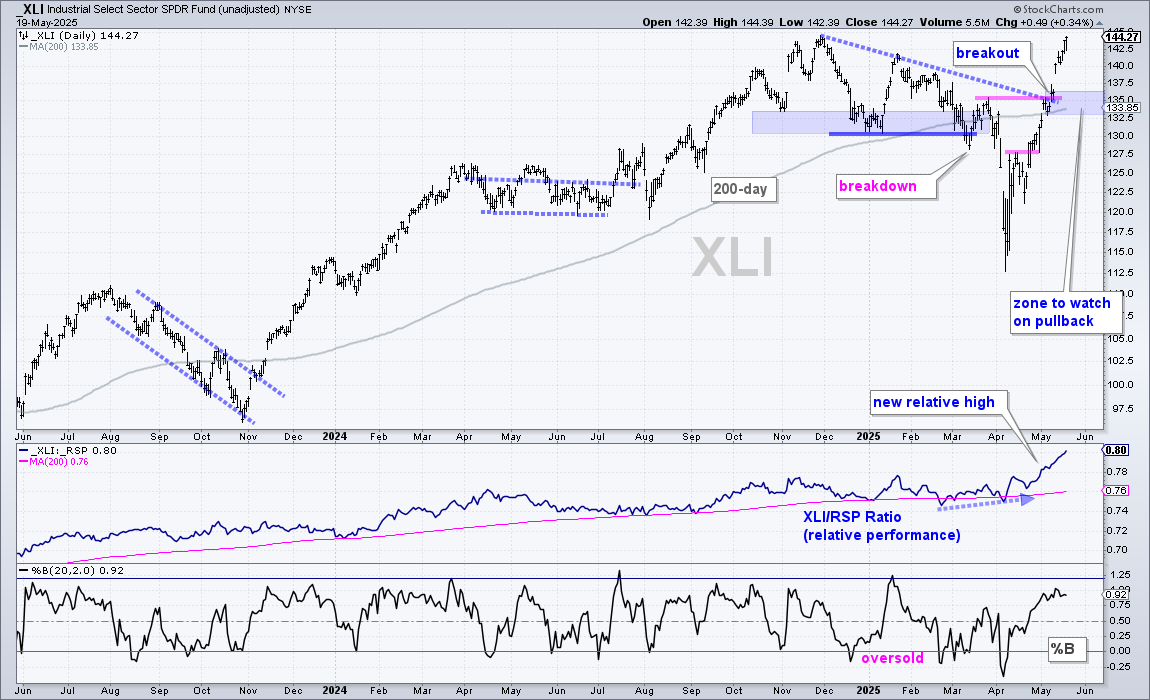
The Industrials SPDR (XLI) is the strongest sector because it is trading near a new high and the price-relative (XLI/RSP ratio) started hitting new highs in early May. On the price chart, XLI broke down with the rest of the market in early April and then broke out with a surge above 135 in early May. XLI continued higher with a gap-surge last week. The blue shading marks the first support zone to watch should XLI pull back (135).
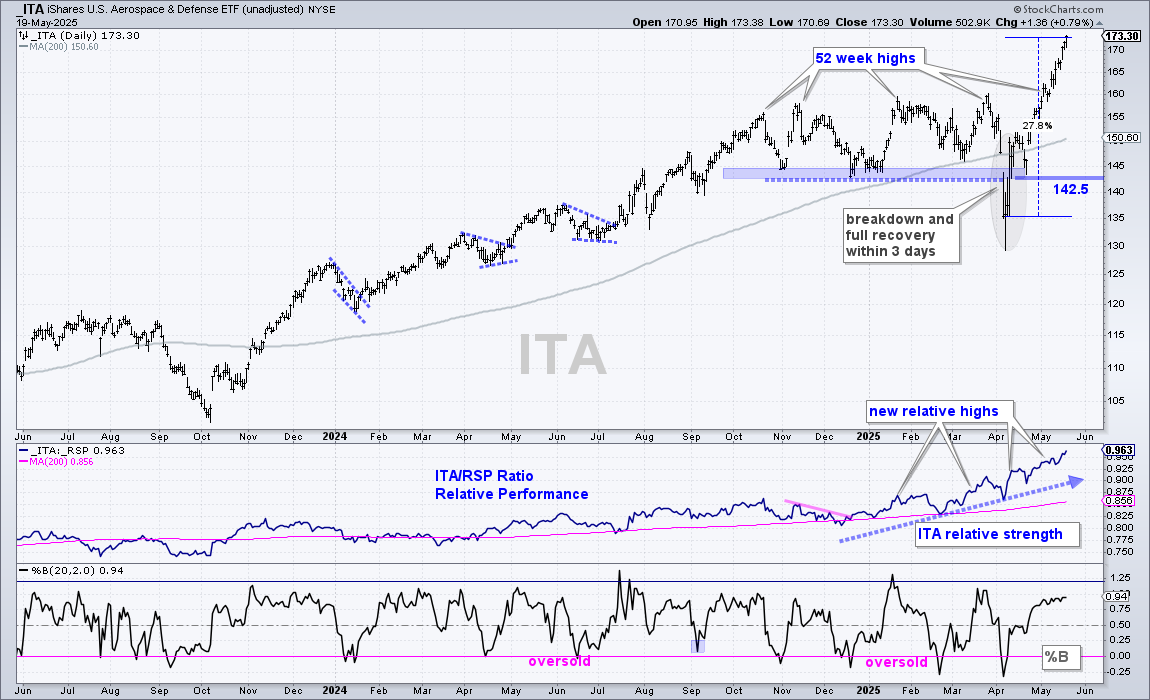
The next chart shows the Aerospace & Defense ETF (ITA) with a breakout and full recovery within a three day window. This was one of the quickest recoveries. ITA surged to a new high in early May and extended further with a move above 170. The move is pretty much straight up and short-term overbought after a 28% gain in six weeks. The middle window shows the price-relative (ITA/RSP ratio) hitting new highs each month this year. This is consistent relative strength.
Cybersecurity and AI ETFs Lead within Technology
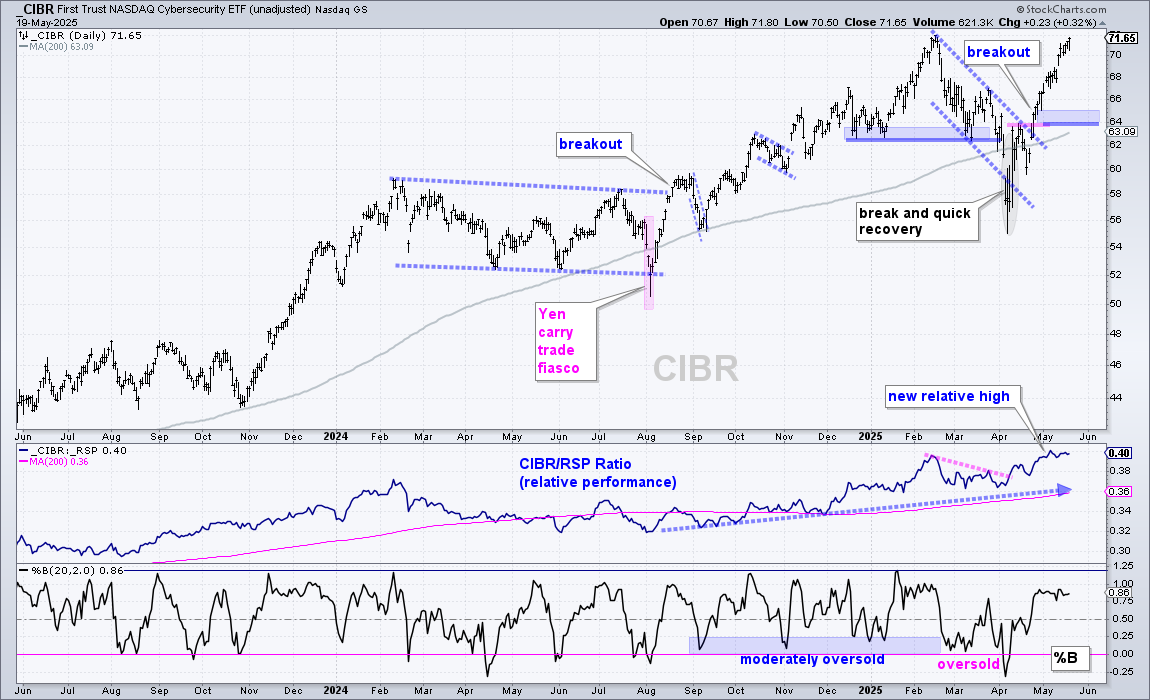
The Cybersecurity ETF (CIBR) is the strongest group with the Technology sector because it is already trading near its February high, which was a 52-week high. CIBR broke out in late April and extended higher throughout May. CIBR is up over 18% since April 21st and short-term overbought. Sometimes ETFs become overbought and remain overbought when in strong uptrends. At this stage, I do not see a trading setup, just a strong and leading uptrend. A pullback would be viewed as an opportunity. Watch for %B to dip into the 0-.25 area for a modestly oversold condition.
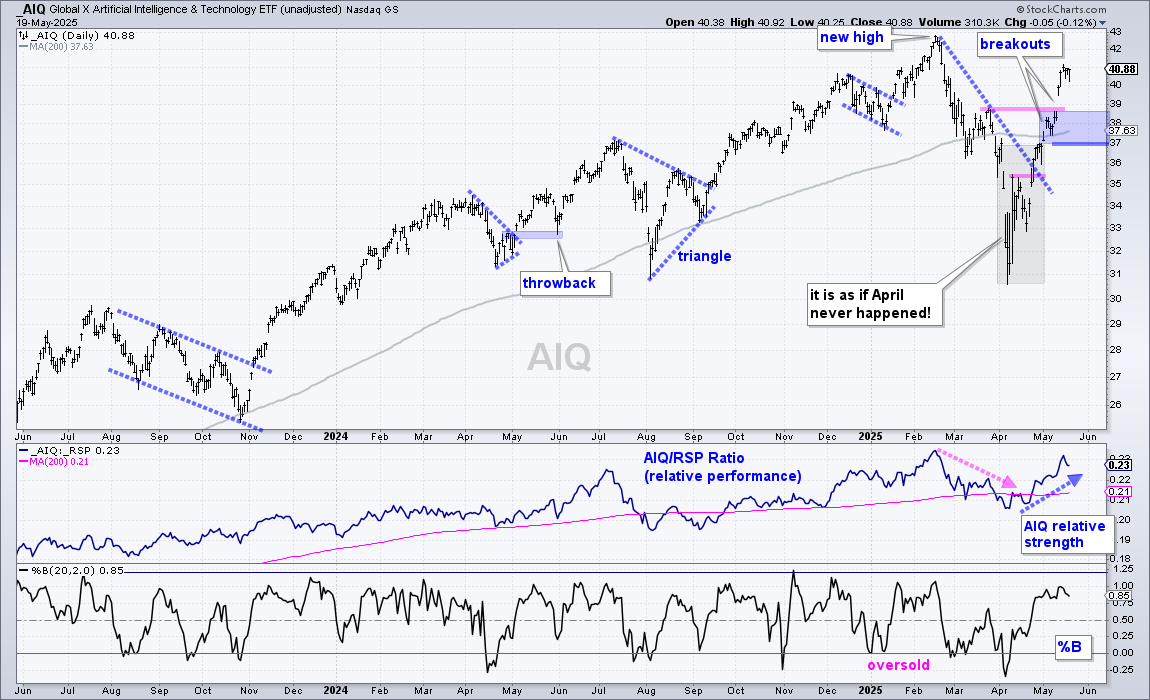
The Global AI & Tech ETF (AIQ) was setting up nicely in mid March as it battled its 200-day SMA. Stocks then plunged in early April and recovered the rest of the month. It is as if April never happened. Like many ETFs, AIQ hit a moment of truth in early May and then broke out with a gap-surge above 39. This gap-surge is bullish and the ETF is less than 5% from a new high. The blue shading marks a support zone in the 37-39 area. A pullback to this zone could provide an opportunity. The middle window shows the AIQ/RSP ratio turning up the last four weeks and nearing its February high as AIQ shows renewed relative strength.
Fintech and Software Extend on Breakouts
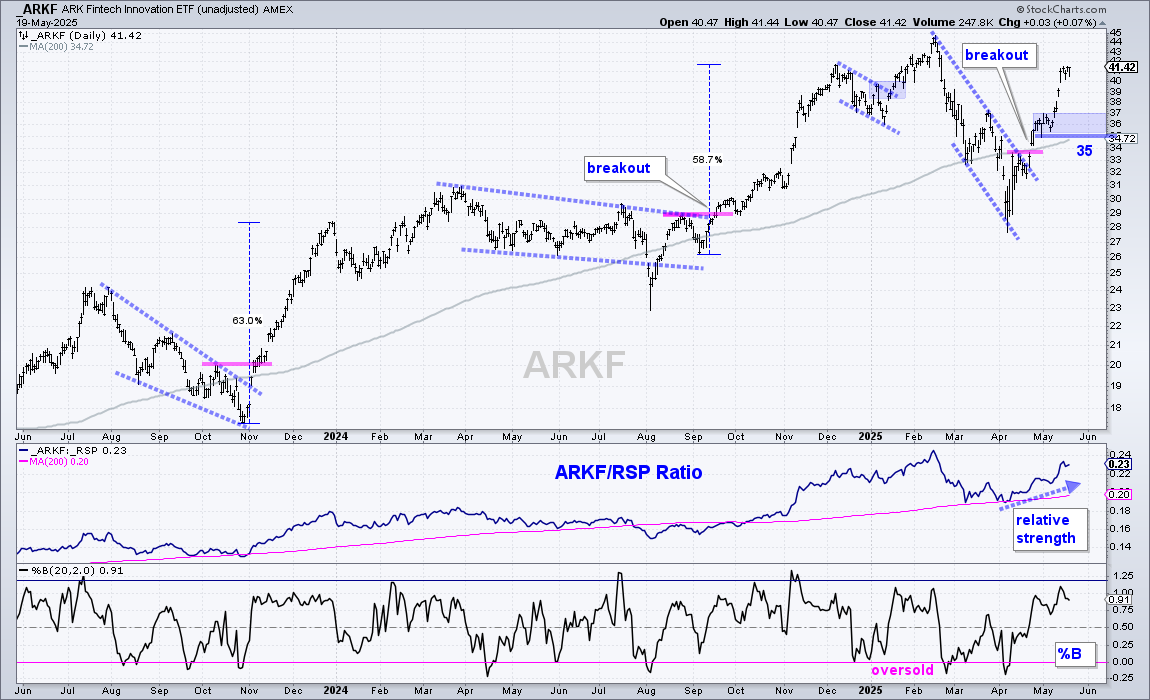
The next chart shows the ARK Fintech Innovation ETF (ARKF) breaking out in late April. We caught this breakout and the breakout in the Cybersecurity ETF (CIBR). I missed the breakouts in AIQ, IGV and MAGS because their relative strength lines were not as strong. The chart shows ARKF breaking out with a gap above 34 in late April and extending above 40. The small consolidation in late April and early May marks the first support zone to watch in the 35-37 area. Notice that ARKF gained around 60% after breakout surges in November 2023 and September 2024. A similar 60% surge off the April low would extend to the upper 40s.
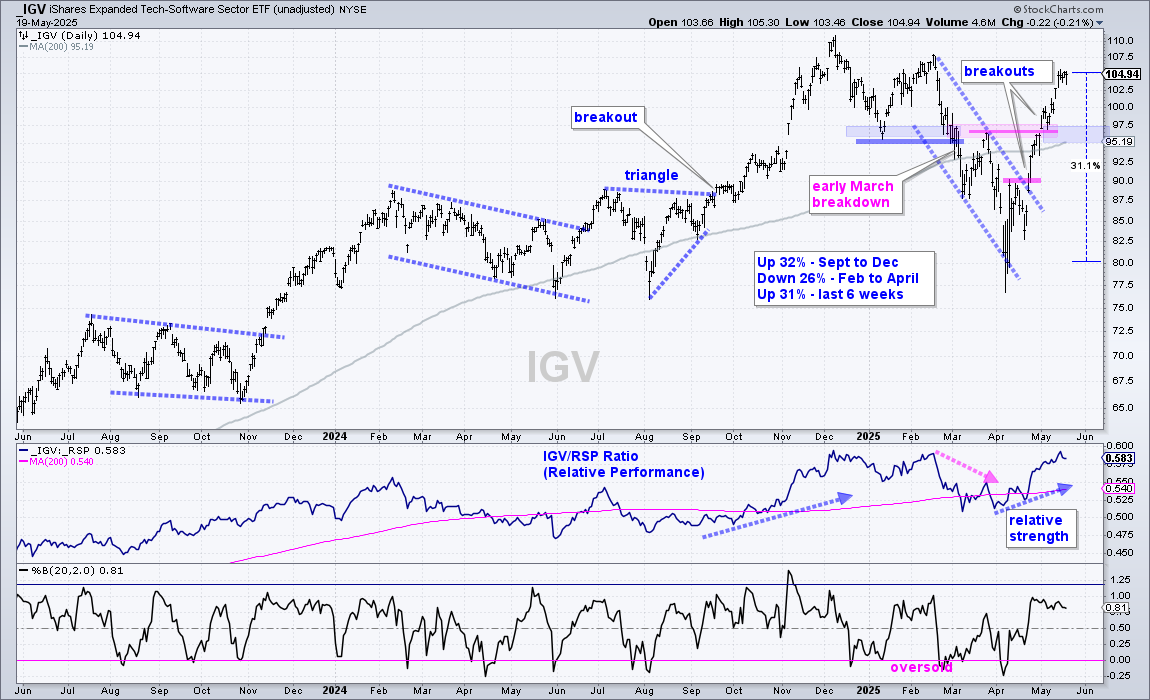
The next chart shows the Software ETF (IGV) peaking in December and showing relative weakness from mid February to early April. IGV was not on my radar because of relative weakness and the early peak. The ETF turned around with a market leading surge the last six weeks and broke two resistance levels. It is up over 30% since early April and short-term overbought. I am marking a support zone in the 95-98 area and a pullback to this area could provide an opportunity. The middle window shows the price-relative turning up in April and surging to its prior highs in May. IGV is back on the relative strength radar.
Semiconductor ETF Holds Above 200-day SMA
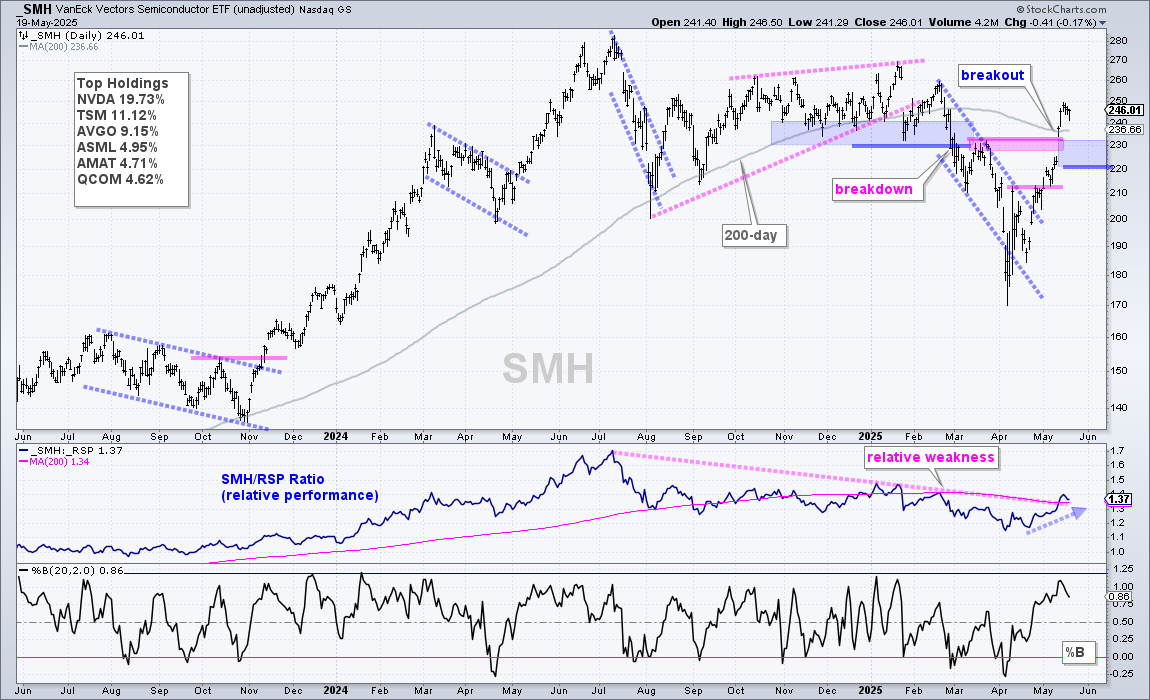
The next chart shows the Semiconductor ETF (SMH) with a similar story. SMH got pummeled after liberation day and was resuscitated with the tariff turnaround. SMH is up 36% since early April, but still below its January-February highs. The ETF negated the March breakdown with a breakout surge above 232. A strong breakout should hold so I am marking support at 220. A break here would erase the breakout gap and argue for a re-evaluation. There is a support zone around 230 (blue shading). A pullback to this area would provide an opportunity.
Utilities SPDR Extends on Breakout
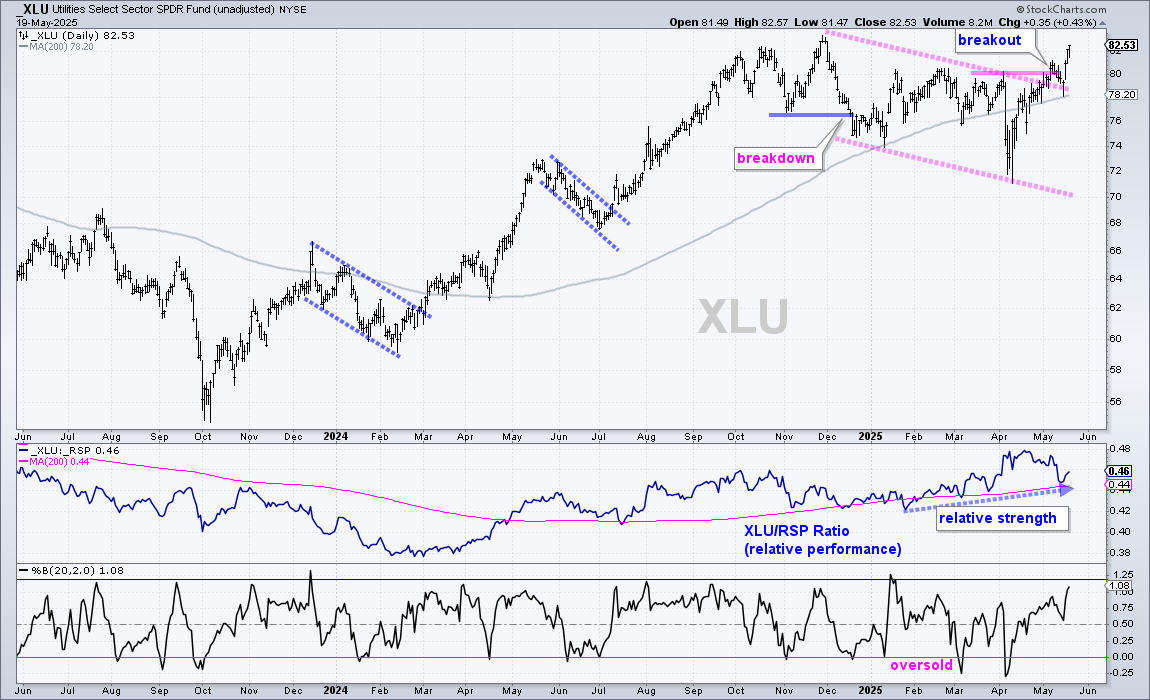
The next chart shows the Utilities SPDR (XLU) taking the lead with a channel breakout in early May and extension higher the last three days. XLU hit a new high in 2025 (94 days) and this shows relative chart strength. Note the SPY and QQQ are not trading at 94 day highs. The middle window shows the price-relative (XLU/RSP ratio) above its rising 200-day SMA as XLU shows relative strength since March.
Medical Devices ETF Extends after Recovering
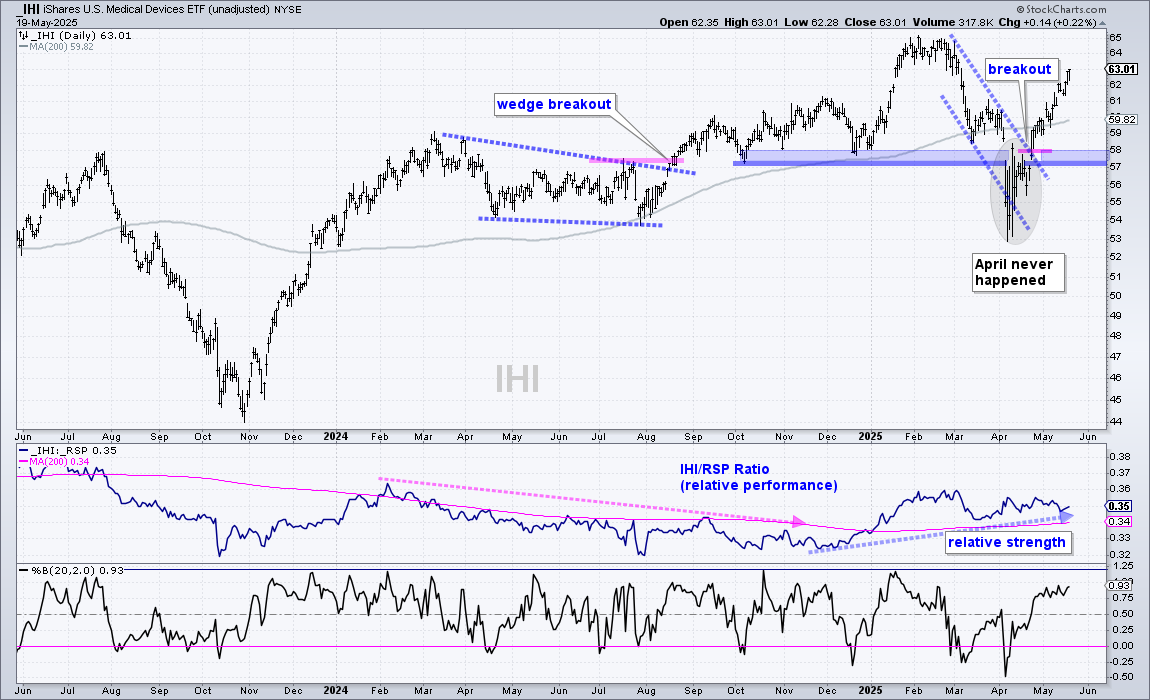
The Medical Devices ETF (IHI) broke support with a sharp decline in April and then recaptured this support break with a surge in late April. The prior support zone in the 57-58 area turns into the current support zone. The middle window shows the price-relative holding above its 200-day SMA since early January. This means IHI is outperforming the S&P 500 EW ETF this year.
Telecom ETF: Old Support Becomes New Support
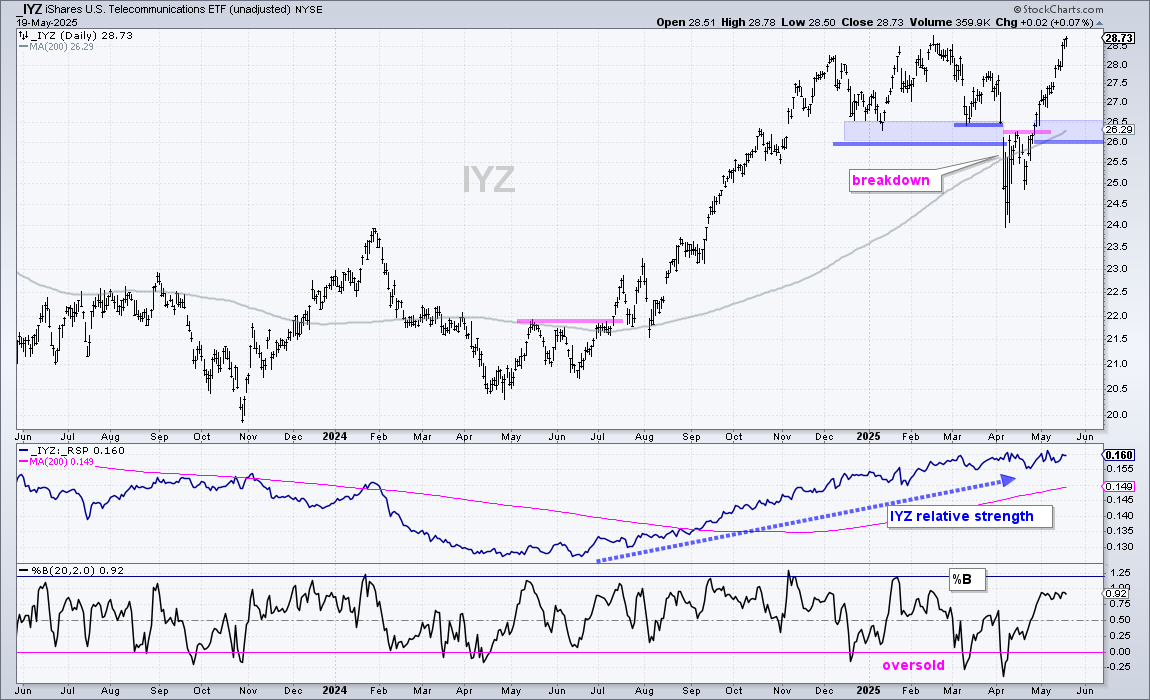
The next chart shows the Telecom ETF (IYZ) breaking support in early April, recapturing this support break in late April and surging to a new closing high on Monday. Again, it is as if April never happened. The old support level at 26 is the new support level. The middle window shows the price-relative (IYZ/RSP ratio) hitting a new high in early May as IYZ shows consistent relative strength.
Send feedback to support(at)trendinvestorpro.com or use the contact form. [4]