Market-ETF Report – Mind the Gap-Surge – Year-to-date Leaders – Four Big Sectors Lead
Posted By
Arthur Hill, CMT
On
In
Archive |
No Comments
The next report will be on Tuesday, May 20th
Report Headlines
SPY Negates March Breakdown with Gap-Surge
QQQ Takes the Lead with 3-day Surge
The Year-to-date Leaders
Risk Assets Up – Bonds and Gold Down
TLT in Long-term Downtrend
GLD Corrects after Blow-Off Top
Four Big Sectors Negate March Breakdowns (XLK, XLC, XLF, XLI)
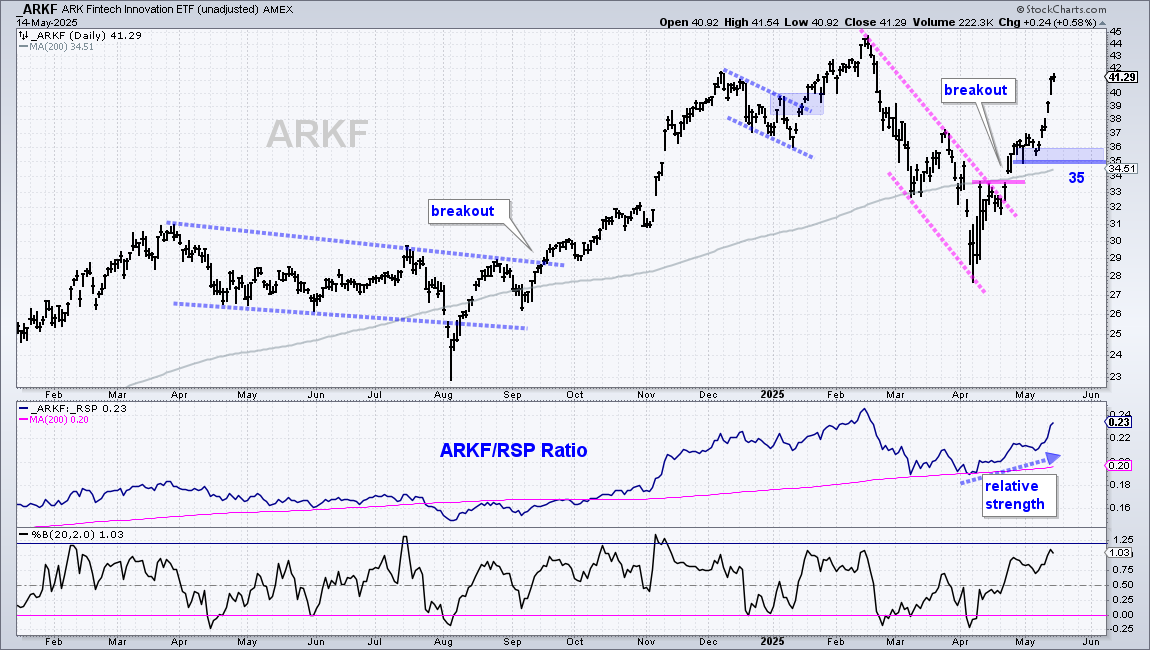
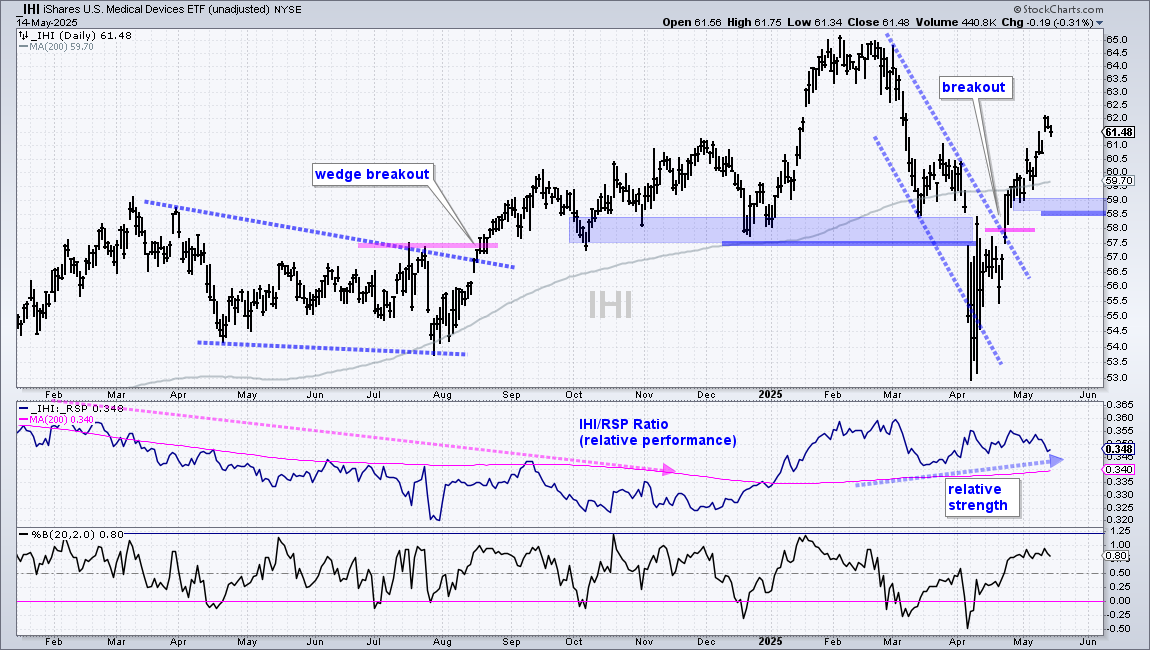
Extending on late April Breakouts (CIBR, ARKF, IHI)
SPY Negates March Breakdown with Gap-Surge
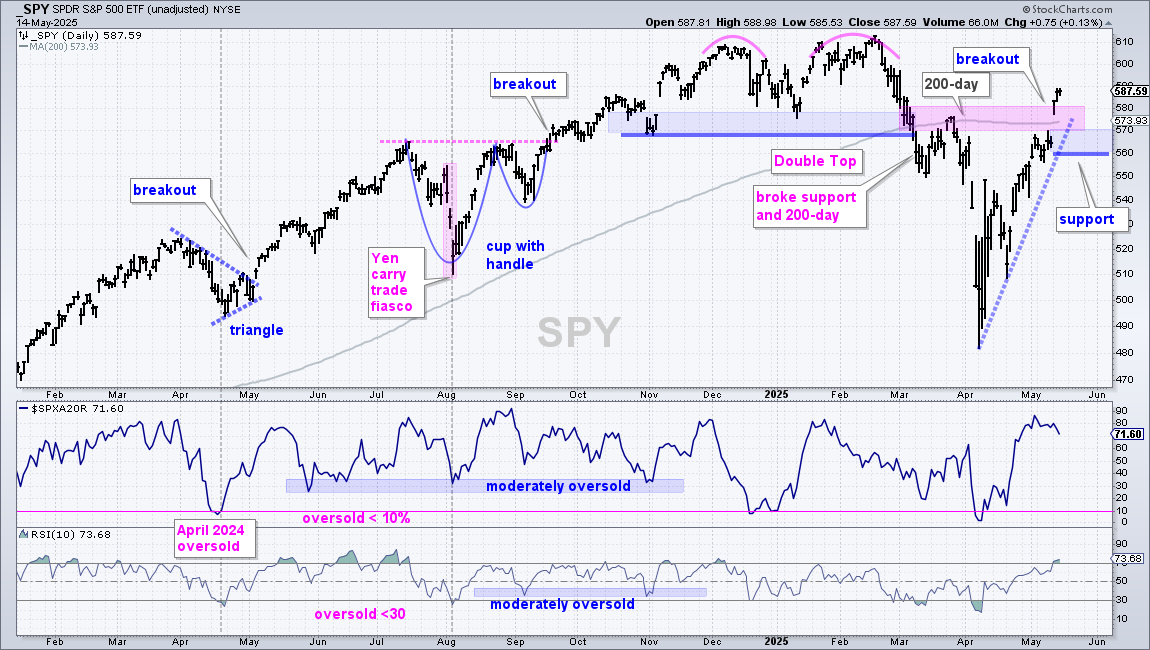
The S&P 500 SPDR (SPY) negated the Double Top support break and exceeded its 200-day SMA with a gap-surge on Monday. It is important that this breakout gap-surge holds. A close below 560 would fill the gap and put SPY back below its 200-day SMA. This would be a negative development. The bulls have the edge as long as the gap zone and 200-day hold.
This V-reversal and thrust signals are long-term bullish, but SPY is quite extended after an 18% surge in five weeks. Note that stocks are usually overextended/overbought after breakout surges. SPY was overbought in mid November 2023 and did not become short-term oversold until April 2024, five months later. The indicator windows shows SPX %Above 20-day SMA ($SPXA20R) dipping below 20% and RSI(10) dipping below 30 on April 2024.
Oversold levels can be tricky because there are different degrees. A move below 30 is clearly oversold. There are also moderately oversold levels to watch, especially in strong uptrends. SPY moved sharply higher from May to November 2024 and RSI(10) became moderately oversold with dips into the 30-40 zone in September and October (blue shading). Similarly, SPX %Above 20-day SMA ($SPXA20R) became moderately oversold in the 30% area in late May, early August and late October (blue shading).
On Friday, I will post a research piece covering oversold indicators.
QQQ Takes the Lead with 3-day Surge
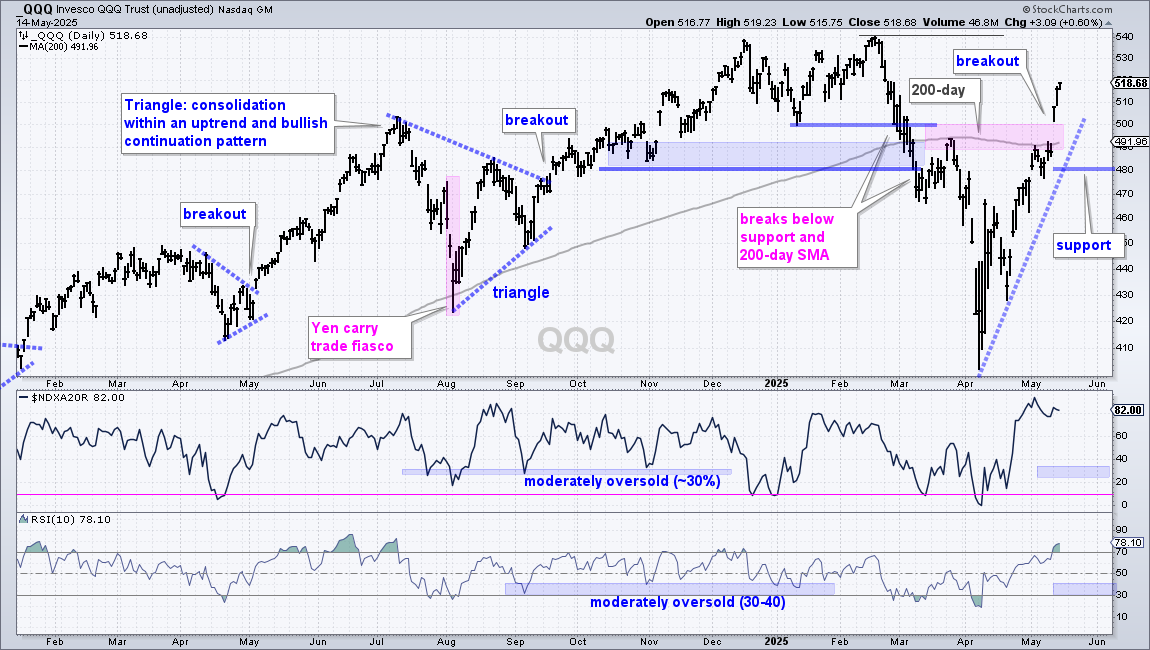
The next chart shows QQQ negating the March breakdown with a gap-surge above 500. It is important that this gap-surge and 200-day SMA hold. A close below 480 would negate this breakout and call for a reassessment. The indicator windows show NDX %Above 20-day SMA ($NDXA20R) and RSI(10). With a breakout surge and thrust signals, I am using these indicators to identify short-term oversold conditions going forward. Watch for an $NDXA20R move into the 30% area and/or an RSI(10) move into the 30-40 zone.
Year-to-Date Leaders
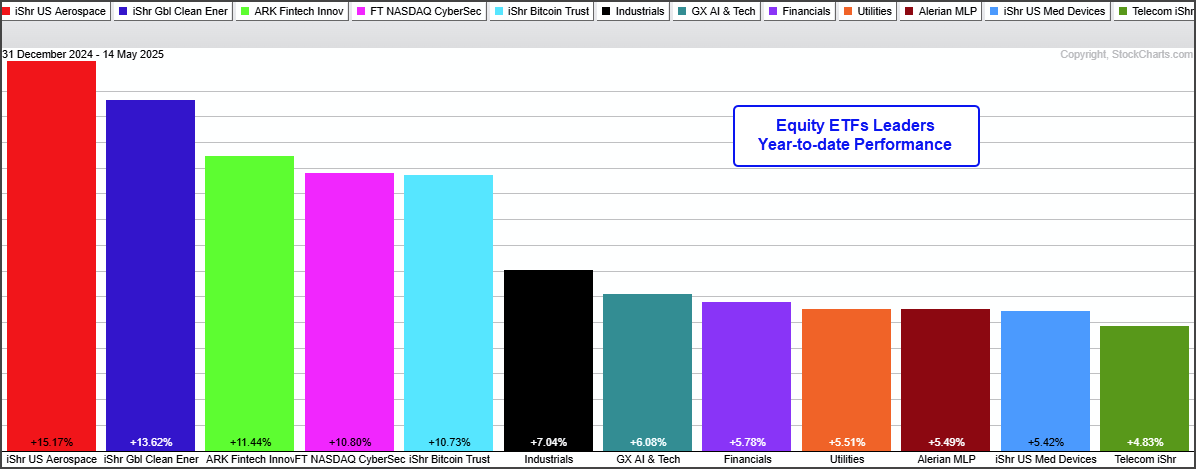
QQQ and tech stocks led the advance off the early April lows. They also led the declines from late February to early April. We can combine the plunge and recovery by looking at year-to-date performance (91 days). QQQ is up 1.61% and XLK is up .87%, which puts them in the middle of the pack. Outside of commodity-related ETFs, the year-to-date leaders are:
Aerospace & Defense ETF (ITA) +15.17%
Global Clean Energy ETF (ICLN) +13.62%
ARK Fintech Innovation ETF (ARKF) +11.44%
Cybersecurity ETF (CIBR) +10.80%
Bitcoin ETF (IBIT) +10.73%
Industrials SPDR (XLI) +7%
Global AI & Tech ETF (AIQ) +6%
Finance SPDR (XLF) +5.78%
Utilities SPDR (XLU) +5.5%
MLP ETF (AMLP) +5.5%
Medical Devices ETF (IHI) +5.4%
Telecom ETF (IYZ) +4.83%
Software ETF (IGV) +4.67%
Risk Assets Up - Bonds and Gold Down
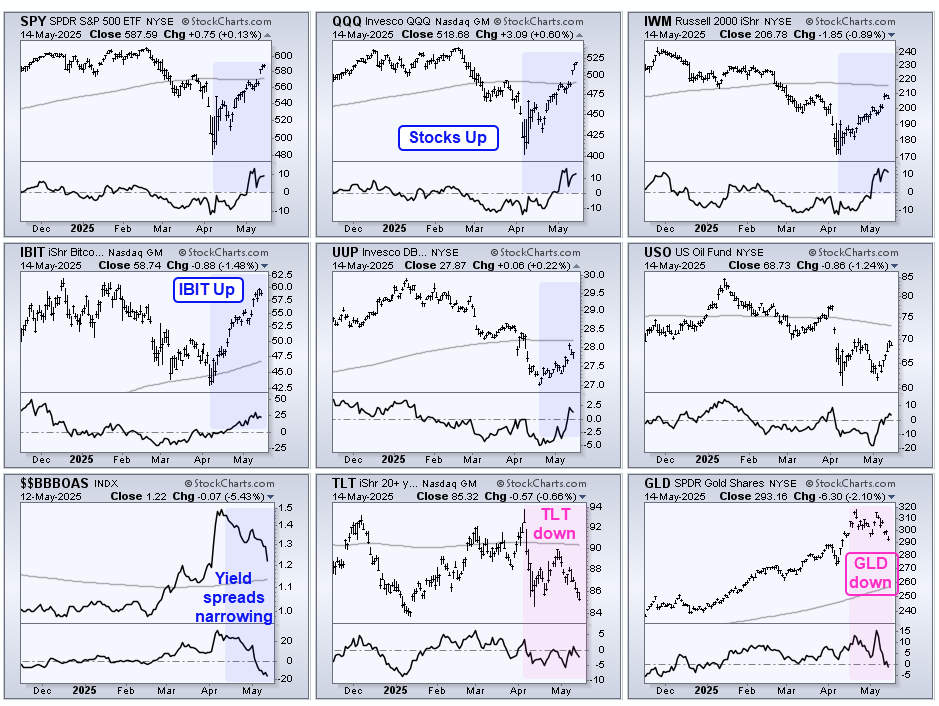
Further strength in stocks could be negative for the 20+ Yr Treasury Bond ETF (TLT) and Gold SPDR (GLD). The CandleGlance charts below show stocks on the top row (SPY, QQQ, IWM). The Bitcoin ETF (IBIT), Dollar Bullish ETF (UUP) and US Oil Fund (USO) are in the middle. The BBB Yield Spread ($$BBBOAS), TLT and GLD are on the bottom row.
The market was in serious risk-off mode from late February to early April. Stocks, IBIT and UUP were down, while TLT and GLD moved higher as safe-haven trades. This situation changed as stocks, IBIT and UUP surged (blue shading), and yield spreads sharply narrowed. TLT and GLD fell as the marked moved to risk-on mode and these two are likely to remain under pressure as long as SPY and QQQ hold their breakouts.
TLT in Long-term Downtrend
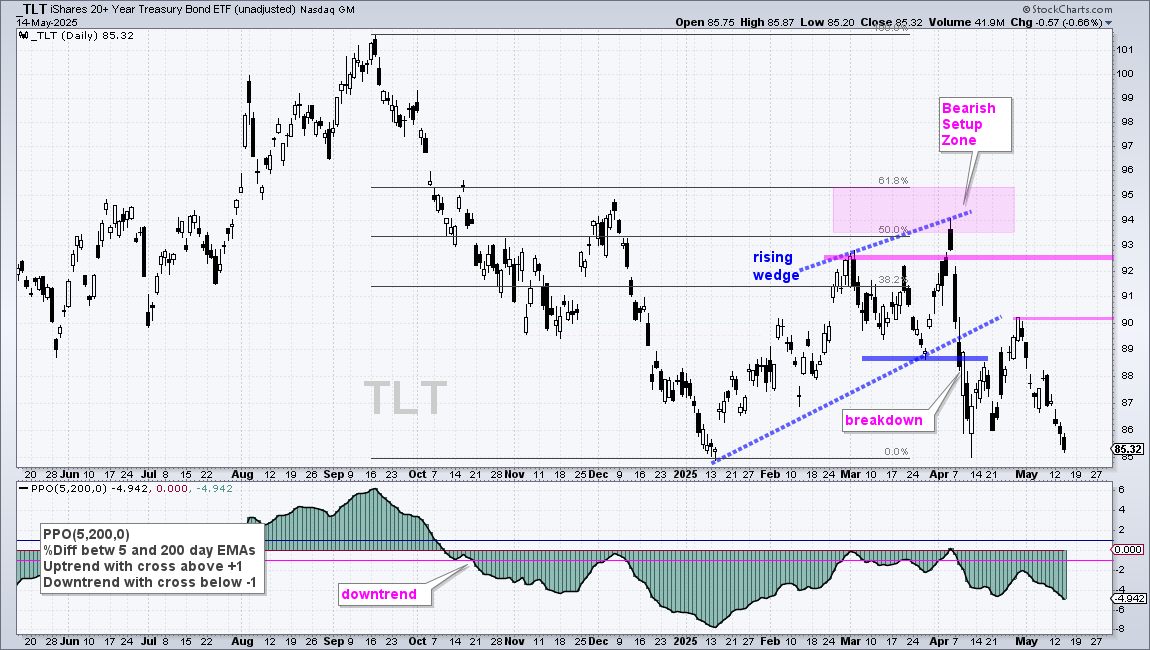
The next chart shows the 20+ Yr Treasury Bond ETF (TLT) with a rising wedge breakdown in early April. TLT surged back to 90 at the end of April, but then fell to the 85 area as stocks surged in May. TLT is in a clear downtrend and new lows are expected. This means the 10-yr Treasury Yield is in a long-term uptrend and higher rates are expected. A break above the late April high would call for a re-evaluation.
GLD Corrects after Blow-Off Top
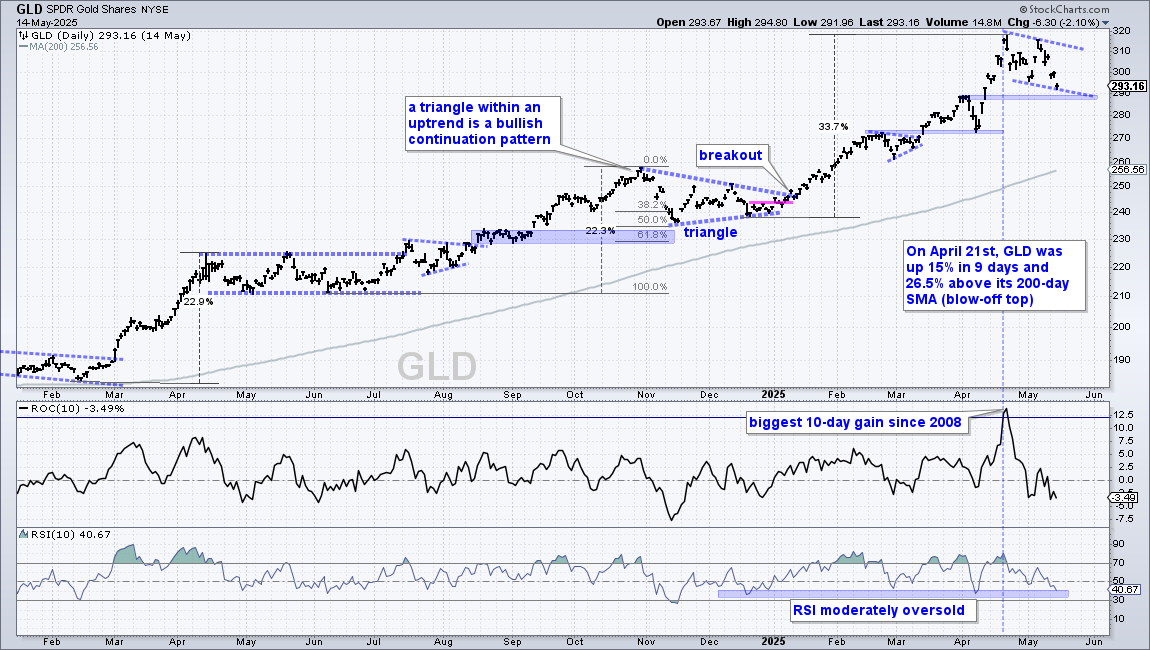
The next chart shows the Gold SPDR (GLD) peaking on April 21st after a 15% surge in nine days. GLD was in blow-off top territory when above 300 and ripe for a correction. A correction is unfolding as GLD fell the last four weeks and RSI(10) dipped to 40.67. A move into the 30-40 zone would be considered moderately oversold. Also note that broken resistance turns support in the 290 area. Gold could be setting up for a bounce in the coming days. Again, a lot depends on stocks and the current risk-on move because gold is a safe-haven alternative in chaotic times.
IBIT Moves with the Risk-On Crowd
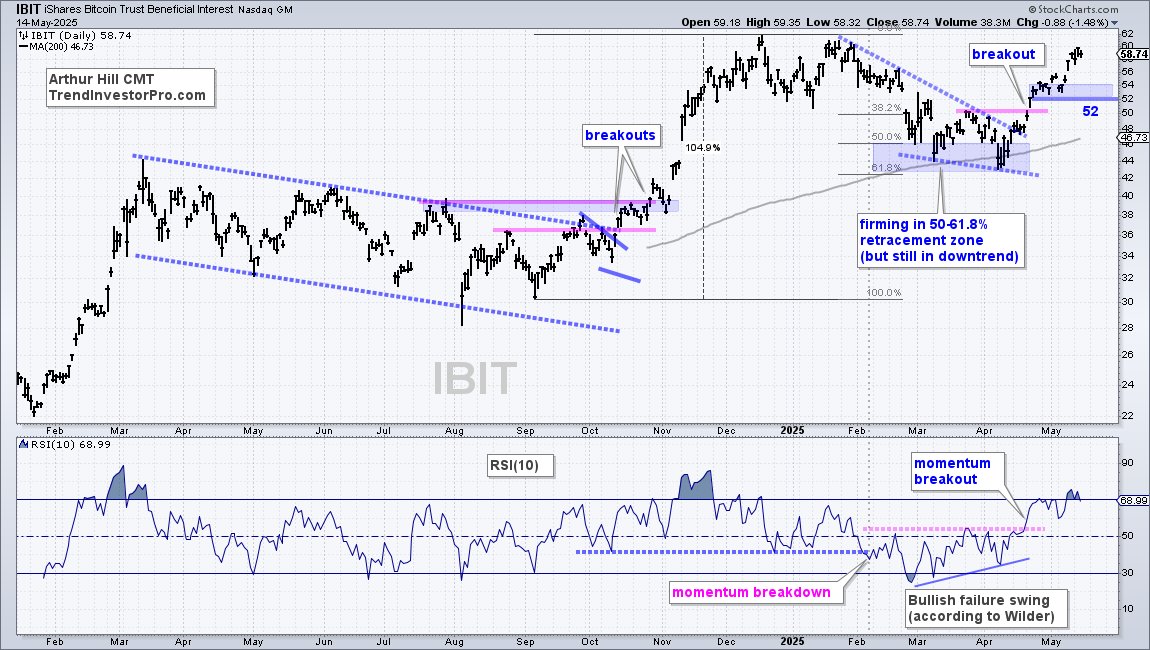
The Bitcoin ETF (IBIT) is also a risk-on asset that would likely benefit from further strength in stocks. We covered the setup in early April and the breakouts in mid-late April. IBIT continued to 60 and remains bullish. The ETF stalled a little in the 52-54 area so I am marking first support at 52. A break here would derail the advance and call for a re-evaluation.
Four Big Sectors Negate March Breakdowns (XLK, XLC, XLF, XLI)
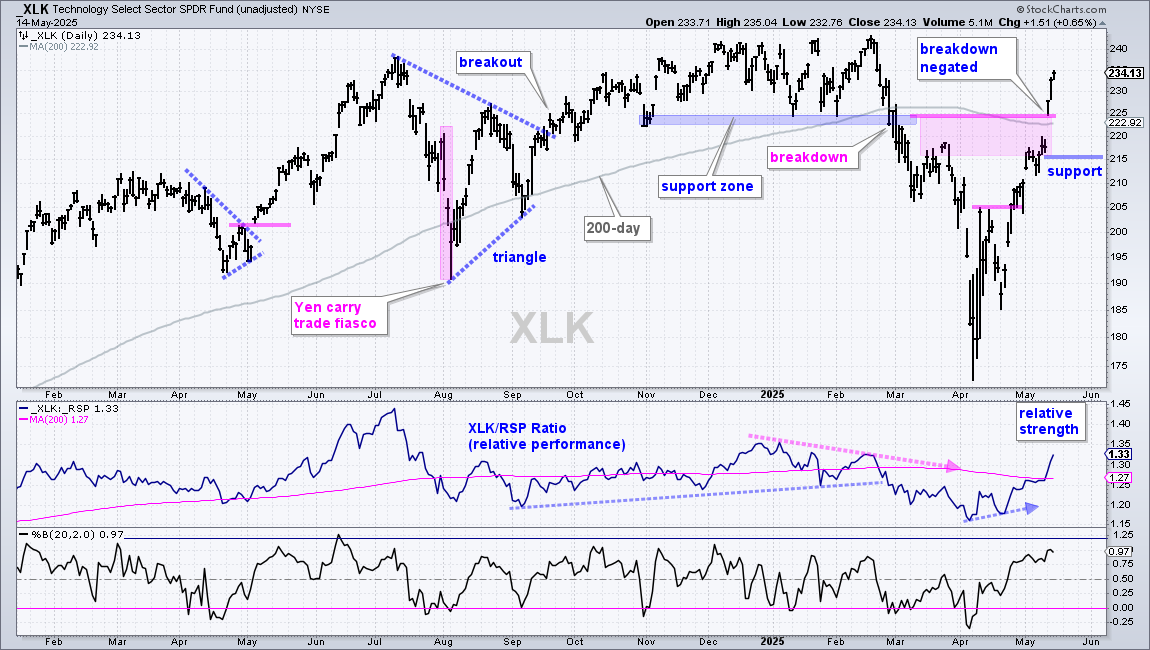
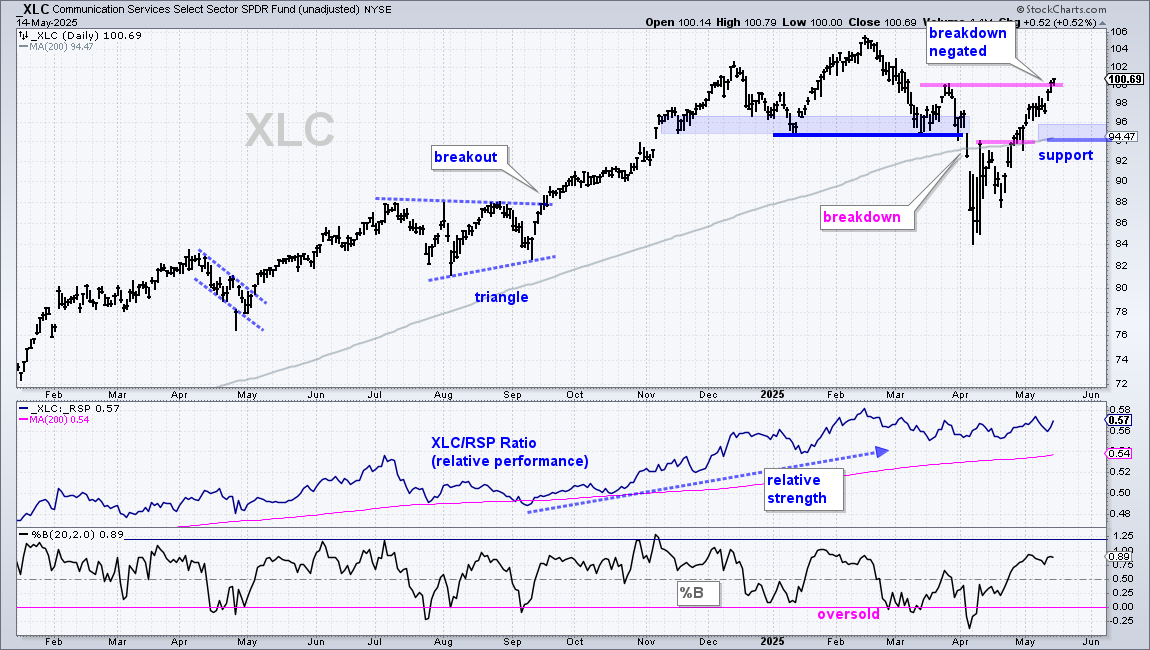
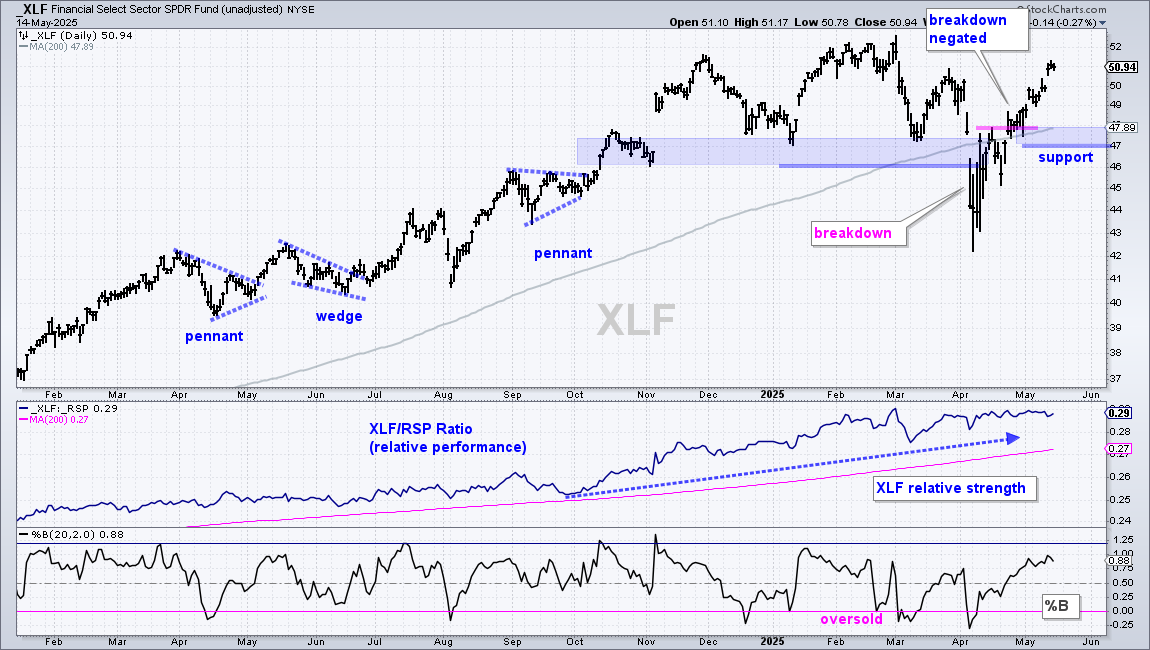
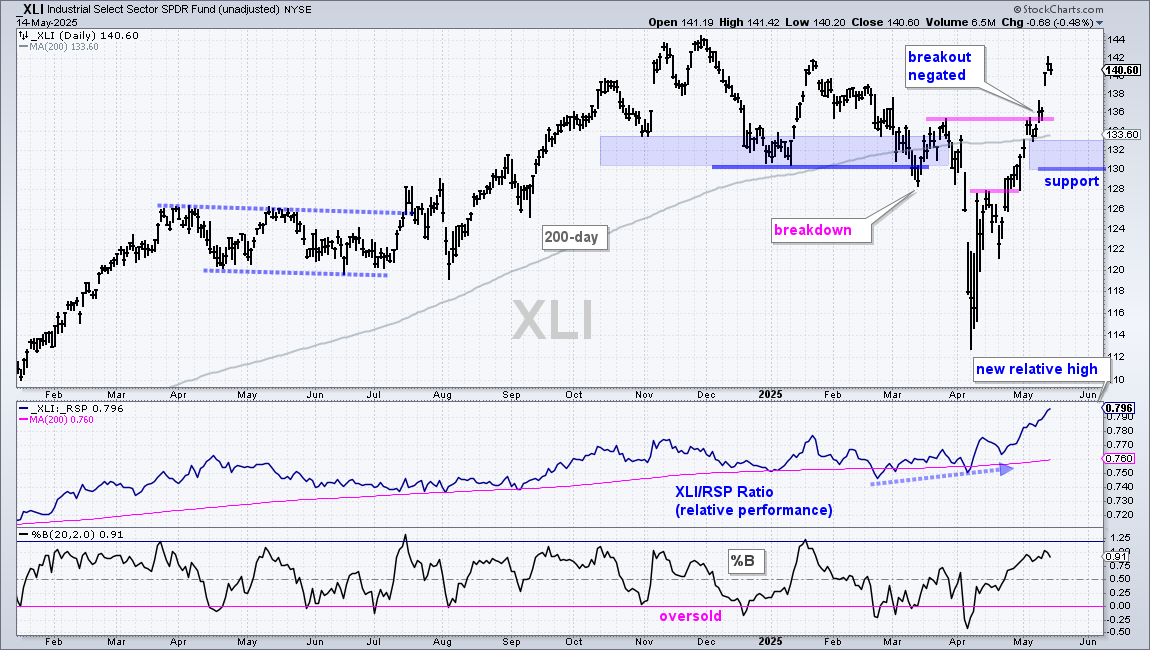
The next four charts show V-Reversals in April and May breakouts that negated the March breakdowns. It is as if April never happened. As with SPY and QQQ, the gap-surges above the 200-day hold the key. A pullback to the 200-day SMA or even a move into the gap zone is ok, but a close below the support level would erase this gap surge and call for a re-evaluation. The first four charts are Technology SPDR (XLK), Communication Services SPDR (XLC), Finance SPDR (XLF) and Industrials SPDR (XLI). Also notice that their price-relatives (XLI/RSP ratio) are rising and they show relative strength.
Extending on late April Breakouts (CIBR, ARKF, IHI)
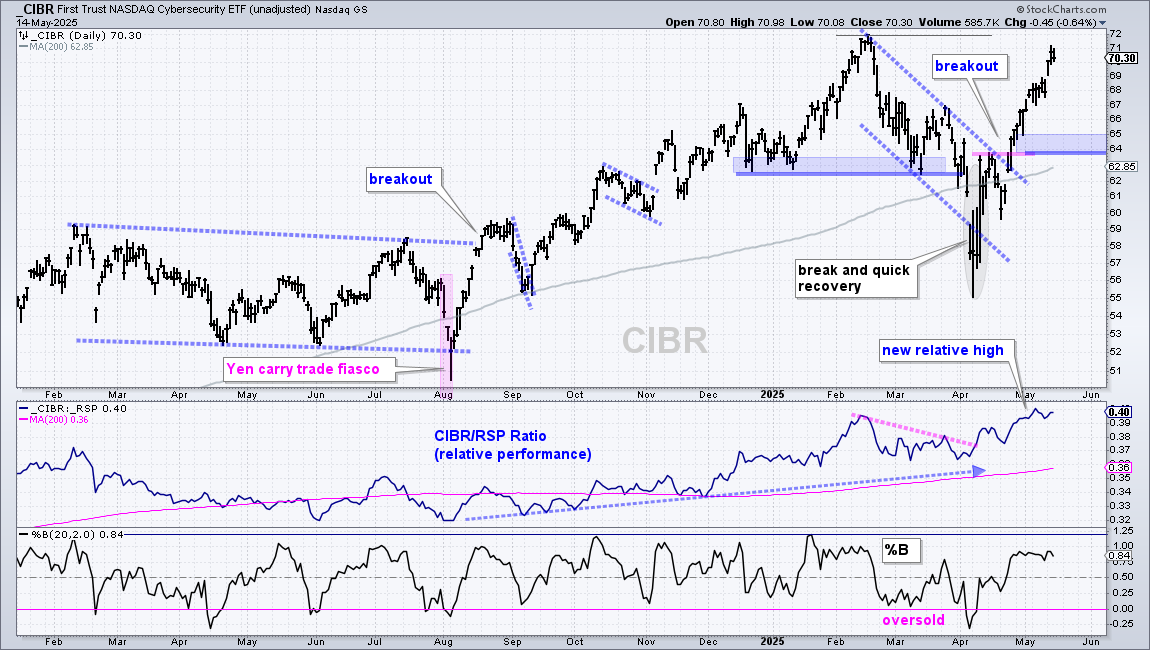
The next charts show ETFs with breakouts in late April and further gains into mid May. The Cybersecurity ETF (CIBR) and ARK Fintech Innovation ETF (ARKF) are up sharply the last five weeks and showing relative strength. As with the broader market, they are also short-term overbought and ripe for a corrective period. Corrections can form as sideways consolidations or pullbacks.
Send feedback to support(at)trendinvestorpro.com or use the contact form. [1]