Market & ETF Report – Thrust Shortfall – SPY Resistance – Defensive Groups Lead
Posted By
Arthur Hill, CMT
On
In
Archive |
No Comments
The next report will be on Tuesday, 29th
Today’s report starts with the Zweig Breadth Thrust, which failed to trigger for the S&P 500, but remains a possibility for the S&P 1500. Follow through in the coming days is needed to trigger. We then turn to detailed analysis of SPY, which is below its falling 200-day SMA and near short-term resistance. Stocks are still broadly out of favor with eight of the eleven sectors trading below their 200-day SMAs. Alternatives are hard to find with TLT in breakdown mode and GLD looking extended. We finish with charts for nine equity ETFs holding up the best in this bear market environment.
Report Headlines
Zweig Breadth Thrust Did Not Trigger
SPY is below Downward Slopping 200-day SMA
Defensive Sectors Hold Up
Intraday Charts Capture the Volatility
TLT Remains with Breakdown and Downtrend
Gold Goes Parabolic
Nine Equity ETFs Holding Up the Best
Zweig Breadth Thrust Did Not Trigger
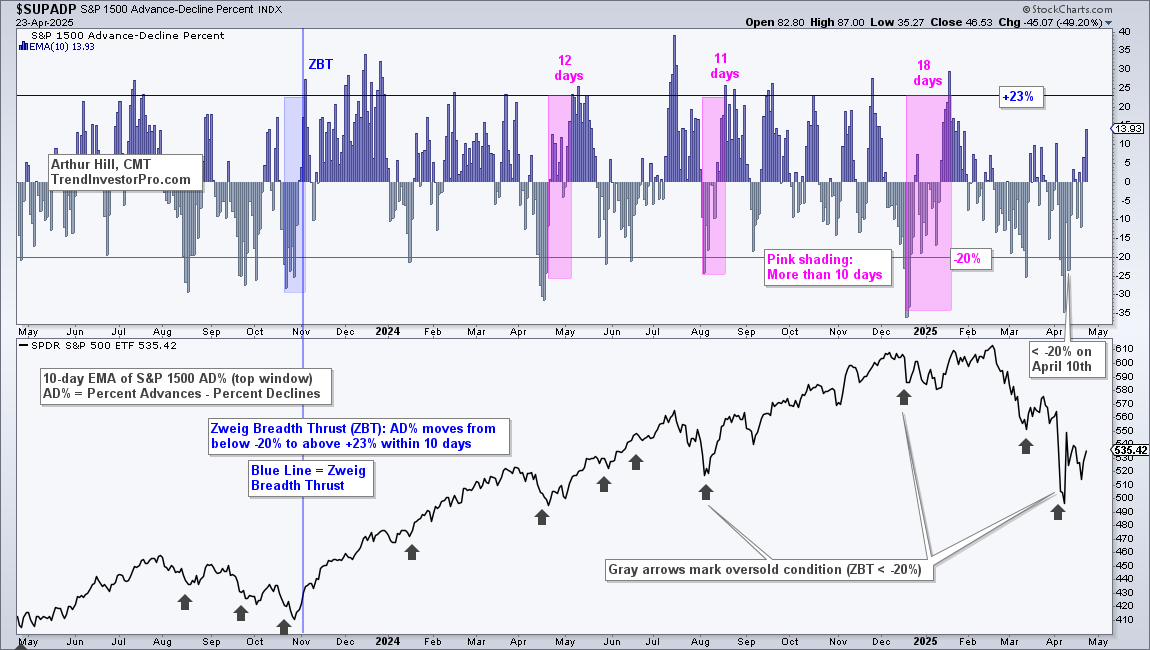
Zweig Breadth Thrust indicators based on NYSE and S&P 500 data did not trigger a bullish thrust within the 10-day window, which ended on Wednesday. The S&P 1500 Zweig Breadth Thrust indicator, however, has two days remaining for a bullish thrust signal. A setup starts when the 10-day EMA of S&P 1500 AD Percent ($SUPADP) moves below -20% and a thrust signal triggers when the indicator crosses above +23% within ten days.
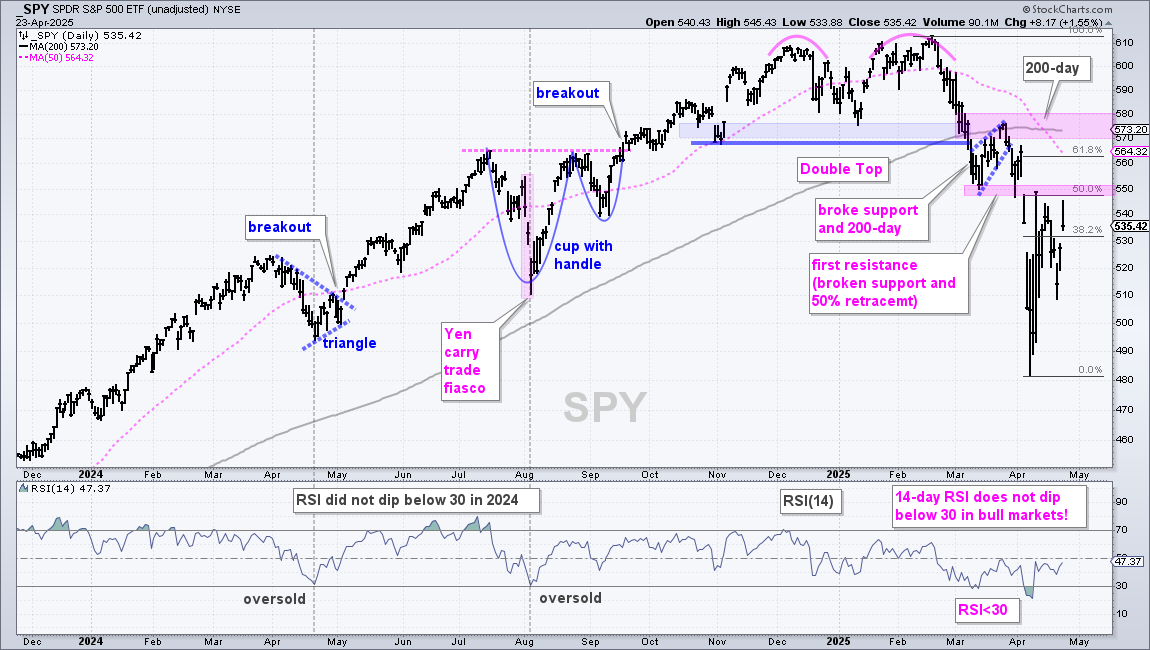
Trading is all about probabilities and the chances of trading success are diminished when the S&P 500 SPDR (SPY) is trading below its 200-day SMA. Negative outcomes are more likely when below, and positive outcomes are more likely when above. Bullish setups and trades are fighting against a long-term downtrend. Bearish setups and trades must reckon with above average volatility and bear market bounces. SPY broke its 200-day SMA in early March and this key moving average turned down in April (gray line). What happens between 500 and 570 is anyone’s guess because volatility is high. Broken support and the 50% retracement mark first resistance in the 550 area. The 200-day SMA and late March high mark key resistance in the 570-580 area.
Defensive Sectors Hold Up
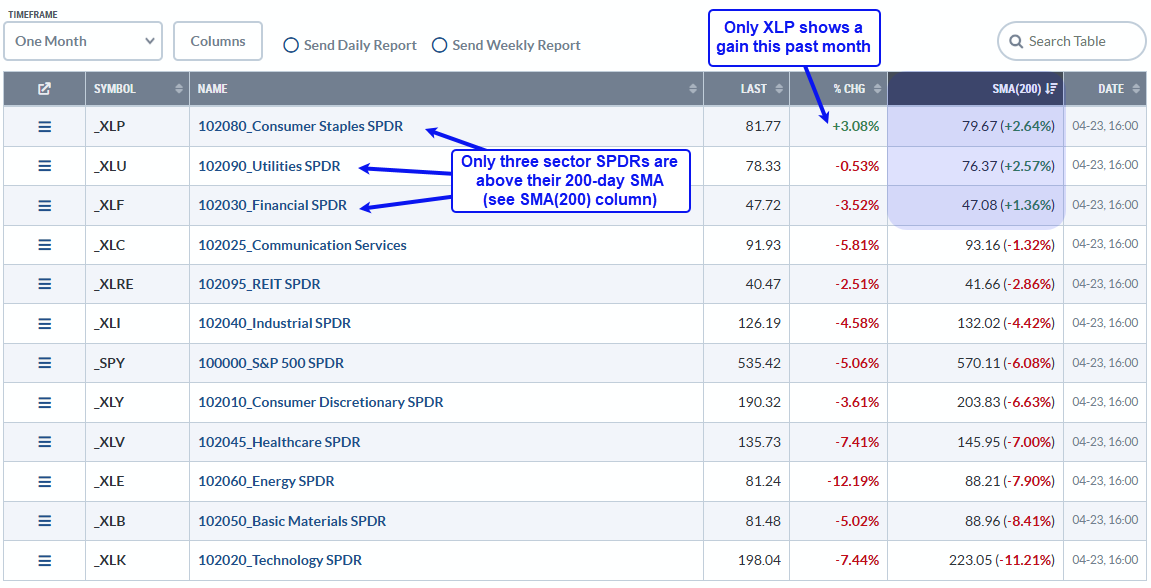
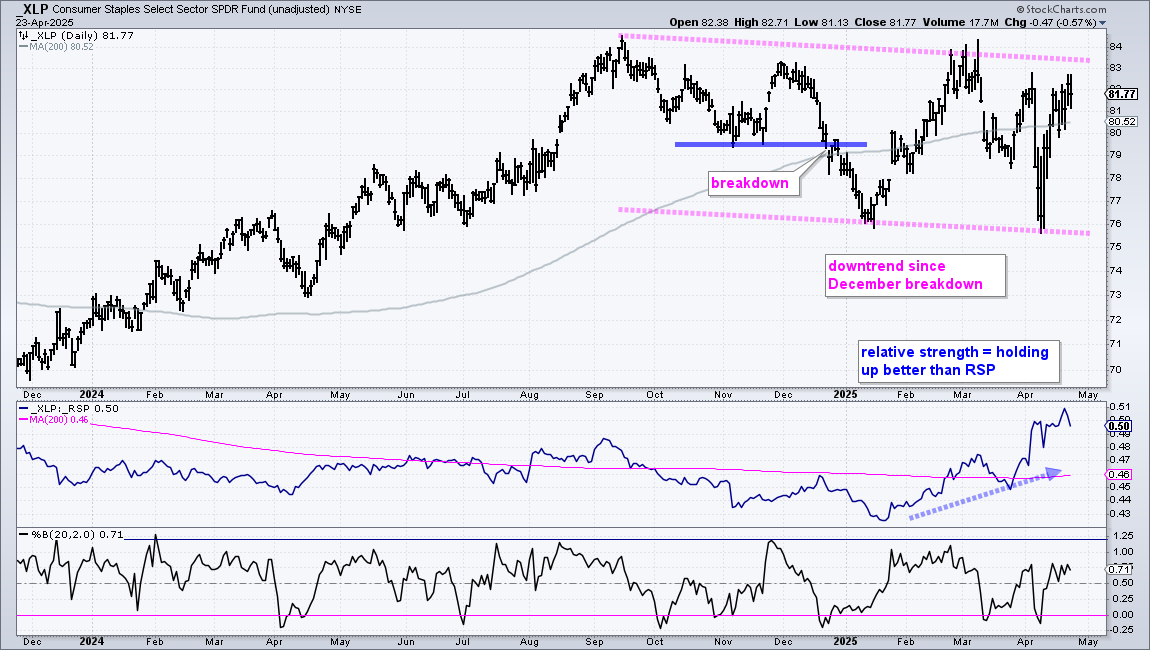
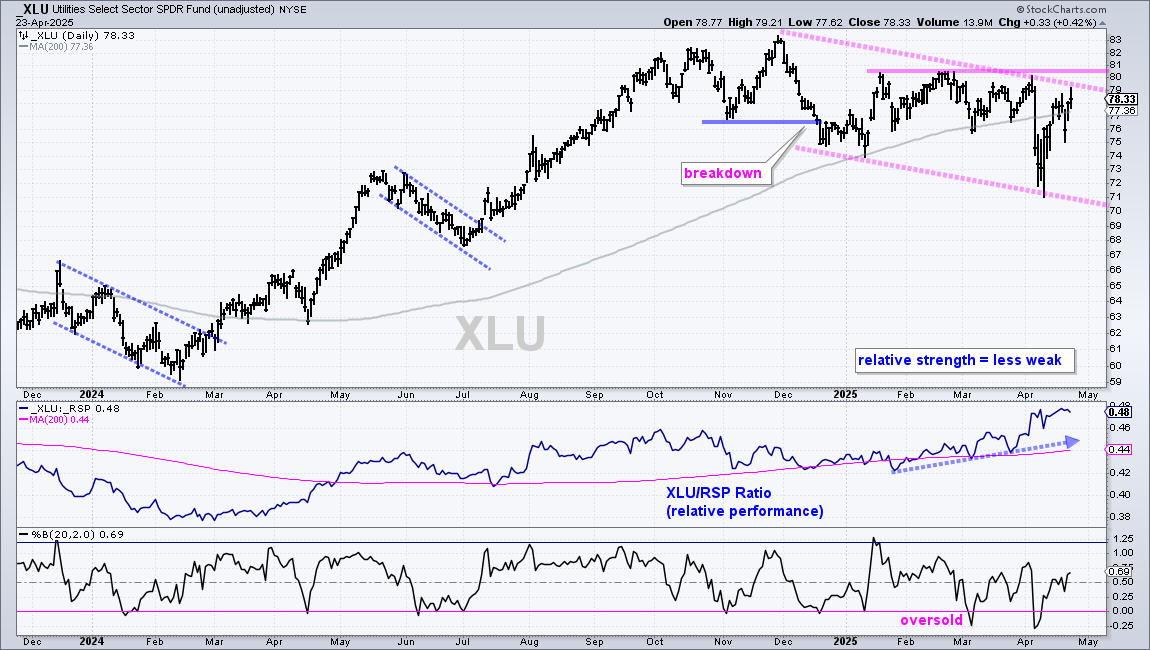
Note that eight of the eleven sectors SPDRs are below their 200-day SMAs. The Consumer Staples SPDR (XLP), Utilities SPDR (XLU) and Finance SPDR (XLF) are the only three that recaptured their 200-day SMAs with the recent bounce. Staples and Utilities are defensive sectors that often hold up better than others during a bear market. Relative strength in the Finance sector is encouraging because it suggests the absence of a financial crisis (2008). Regardless, the weight of the sector evidence is bearish and three of the four offensive sectors are trading below their 200-day SMAs (Technology SPDR (XLK), Industrials SPDR (XLI) and Consumer Discretionary SPDR (XLY)).
Intraday Charts Capture the Volatility
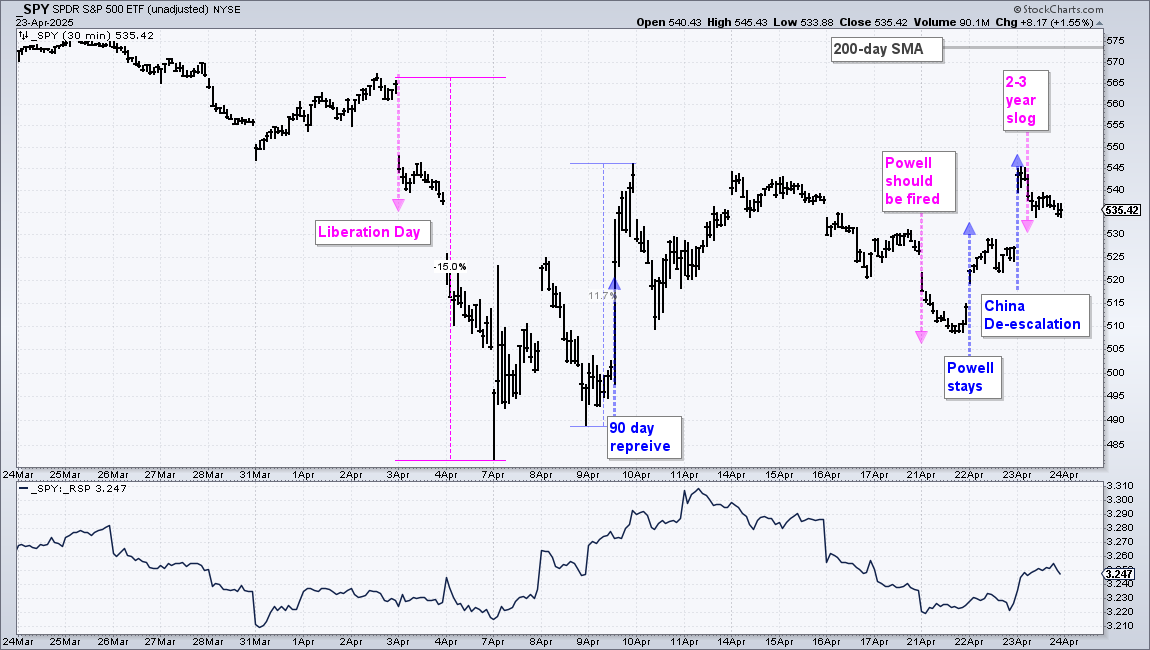
The first chart shows 30 minute bars over the past month. SPY fell sharply after the Liberation day announcement and then surged on news of a 90 day reprieve. I am sure there were some other news events from April 10th to 17th, but I am skipping ahead to Fed Chairman Powell. A firing suggestion led to steep losses, and a softer tone led to a sharp advance on April 22. This is also when Bessent held the closed-door meeting on China de-escalation, which led to an opening surge on April 23rd. Stocks then retreated as Bessent then talked of a 2-3 year slog for negotiations. SPY is all over the place with this wild price action is occurring well below the 200-day SMA (gray line at 573).
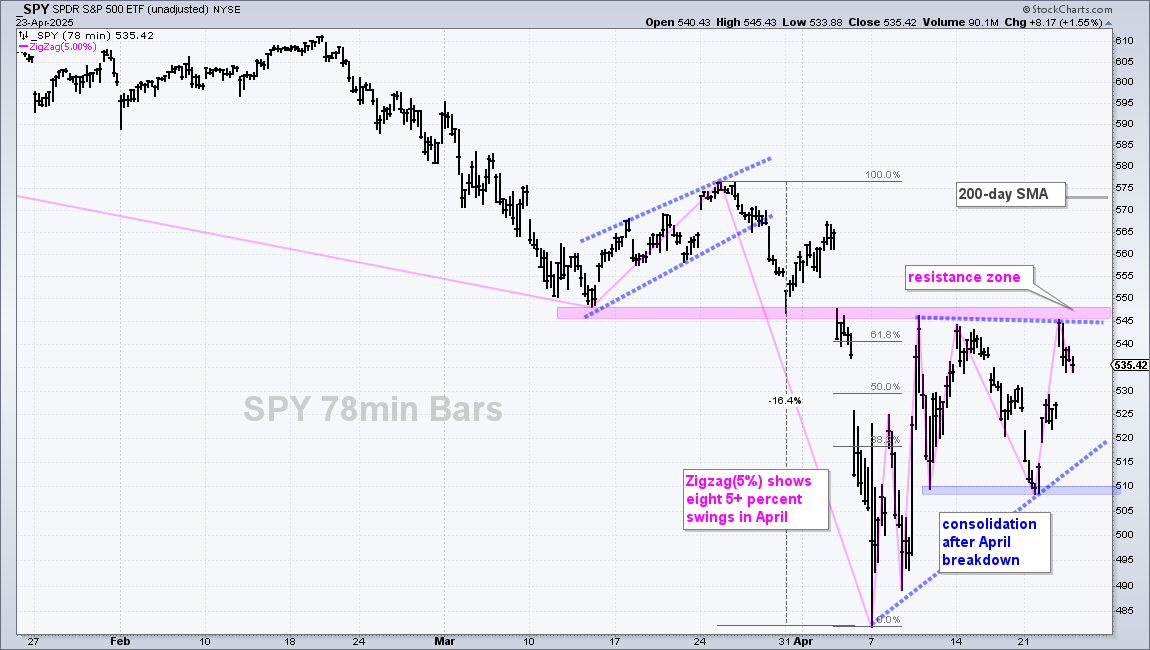
The next chart shows 78 minute bars (5 per day) with the 5% Zigzag (pink line). After a 16.4% decline into early April, SPY produced seven swings that were greater than 5%. In total, there are eight 5+ percent swings in April. Crazy. Most, if not all, are driving by news out of Washington. Most recently, SPY surged 7% with a move from 510 to 545. This put the ETF close to short-term resistance from broken support and mid April highs (pink shading). Overall, SPY is in the midst of an upswing, but this is still a bear market bounce. I would NOT view a breakout at 545 as bullish. Instead, I would expect stiffer resistance in the 550 to 570 area. The blue dashed lines mark a possible consolidation pattern since April 7th (wedge). A consolidation is typically a continuation pattern and the prior move was down (-16.4%). A break below this week’s low would then signal a continuation lower.
TLT Remains with Breakdown and Downtrend
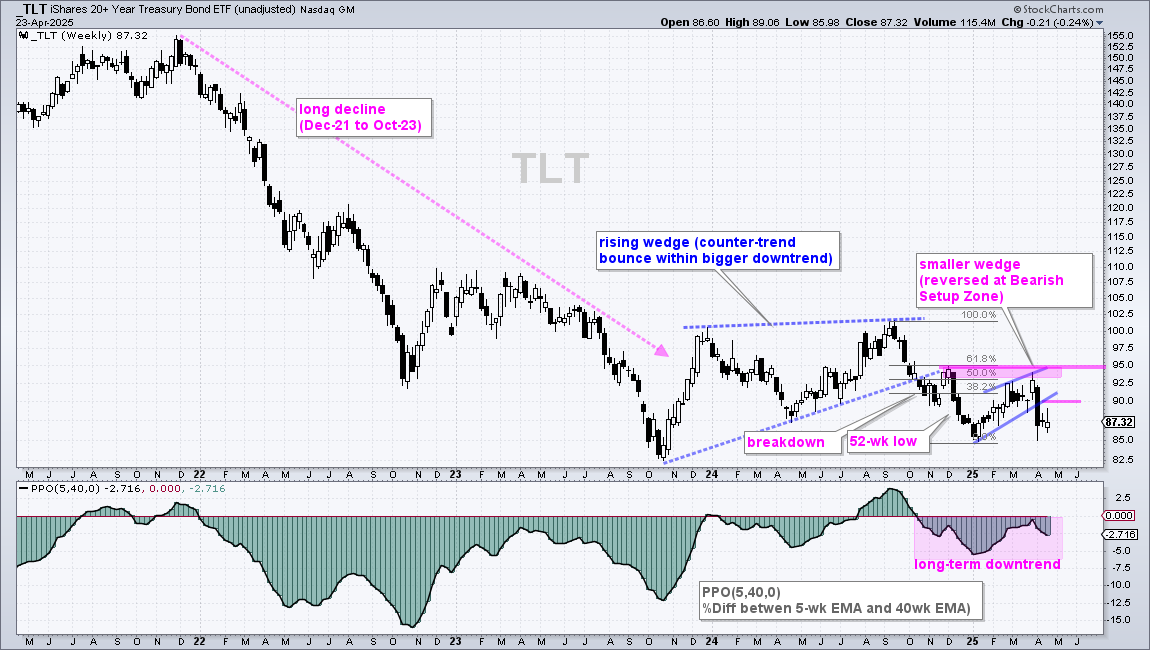
The 20+ Yr Treasury Bond ETF (TLT) remains in a downtrend with a long-term breakdown in October and a short-term breakdown in early April. Long-term, TLT formed a rising wedge from October 2023 to October 2024, broke the wedge line and hit a 52-week low in December. This wedge break signaled a continuation of the prior decline (Dec-2021 to Oct-2023). Short-term, TLT bounced the first three months of 2025 with a smaller rising wedge that retraced 50-61.8% of the prior decline. This is also a bearish continuation pattern and the breakdown signals a continuation of the October-December 2024 decline. TLT firmed the last two weeks, but I have yet to see a bounce strong enough to negate it. A close above 90 would negate the breakdown, while a breakout at 95 would be longer-term bullish.
Gold Goes Parabolic
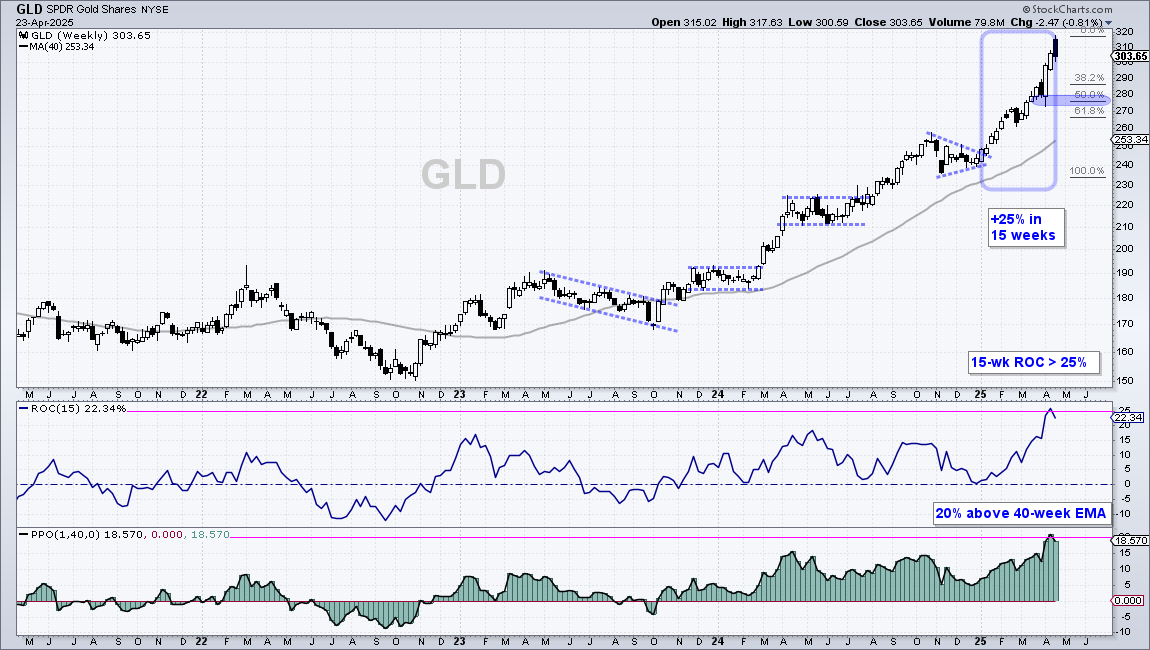
The uptrend in the Gold SPDR (GLD) was getting extreme in March with a 9.5% gain. GLD then tacked on another 10% with the move to 317 earlier this week. The ETF backed off this level, but the uptrend remains extremely overbought. GLD was up over 25% the last 15 weeks (ROC(15)) and is currently up over 25% year-to-date. Note that GLD was up 26.6% in 2024. There is no denying the uptrend, but the ETF is looking vulnerable to a pullback or consolidation. A 50% retracement of the 2025 advance would extend to the 270-280 area and the early April low marks support at 270 (blue shading). The Gold Miners ETF (GDX), Silver ETF (SLV) and Silver Miners ETF (SIL) are positively correlated to gold. This means they move in the same direction as gold.
Nine Equity ETFs Holding Up the Best
The weight of the evidence remains bearish for stocks. This argues for a defensive posture and high cash levels. Some ETFs are holding up better than others, but most equity ETFs go the way of the broader market.
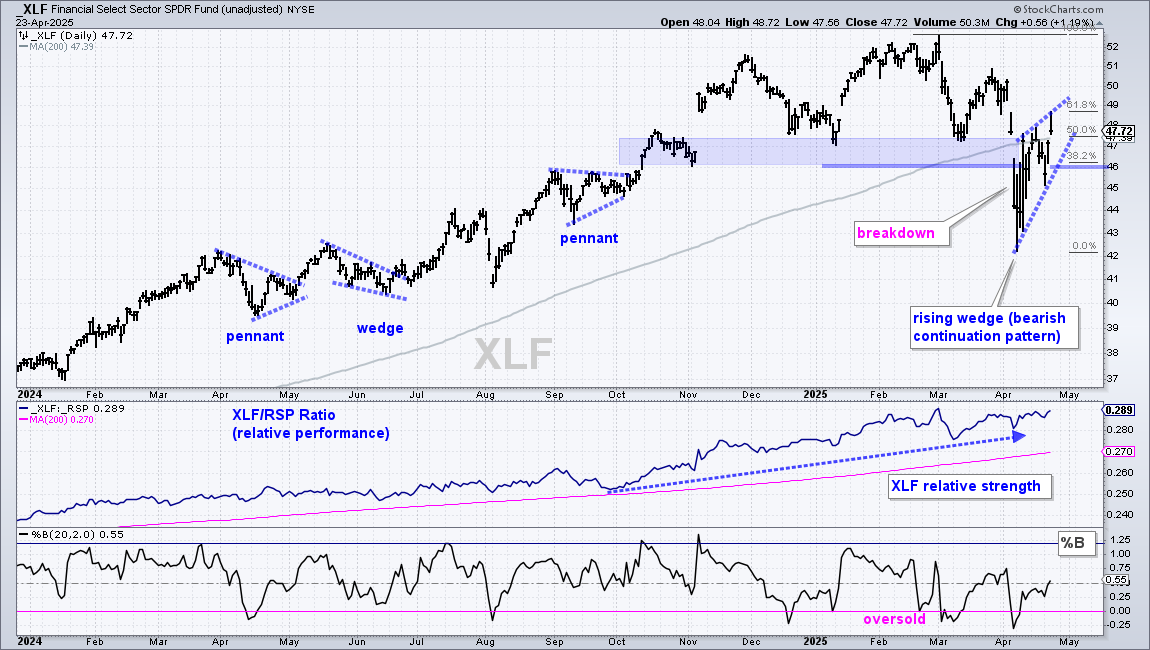
Even though the Finance SPDR (XLF) is holding up relatively well, I still see a breakdown and trend reversal in early April. The current bounce formed a rising wedge that retraced 61.8% of the March-April decline. This looks like a bearish continuation pattern and a support break would trigger a reversal,
The Consumer Staples SPDR (XLP) is above its 200-day SMA and showing relative strength, but the trend is down since the late December breakdown. The pink dashed lines define this downtrend.
The Utilities SPDR (XLU) is above its 200day SMA, but the trend is down with a lower high from November to February and a lower low from January to April.
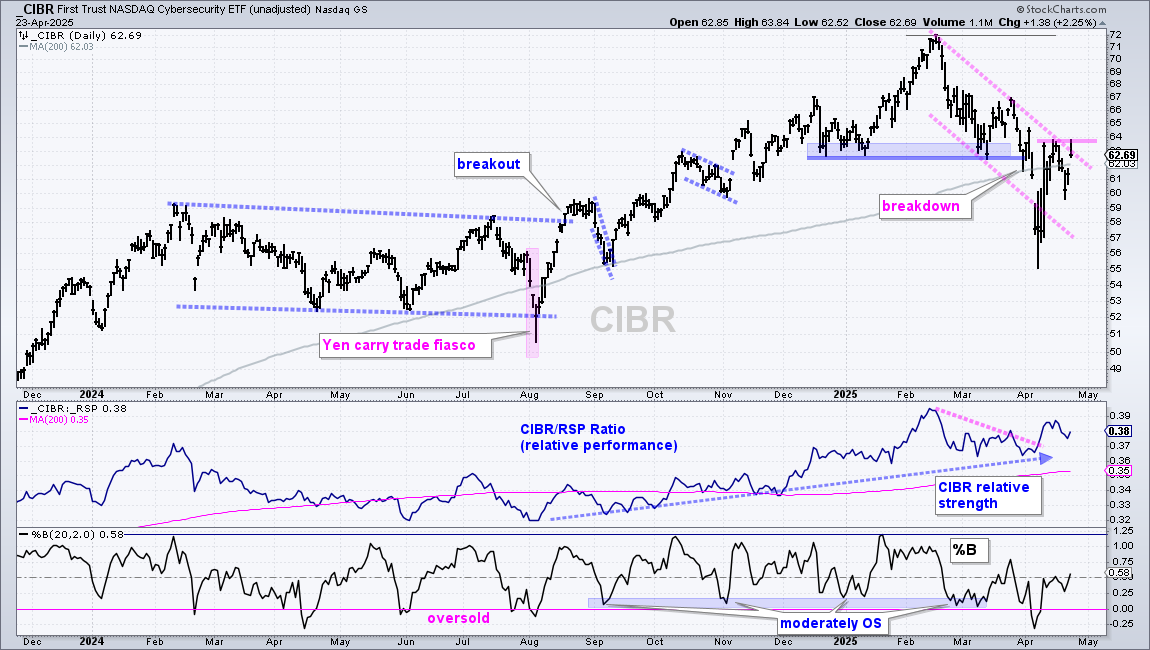
The Cybersecurity ETF (CIBR) is the strongest (least weak) of the tech-related ETFs, but it too broke down with a plunge into early April. The broken support zone turns into a resistance zone in the 62-64 area. CIBR recaptured its 200-day SMA on Wednesday, but remains short of a breakout at 64.
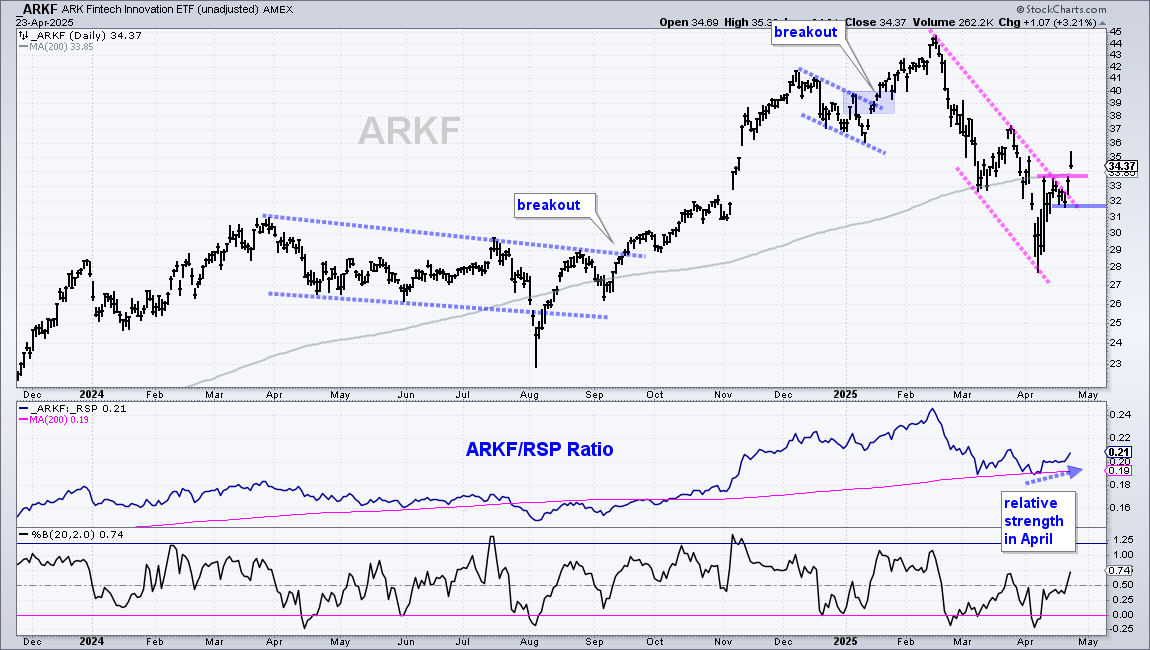
The ARK Fintech Innovation ETF (ARKF) is leading within the tech sector as it broke above its April 9th high. In the process, the ETF broke the 200-day SMA and upper line of the falling channel. A close below this week’s low would negate the breakout.
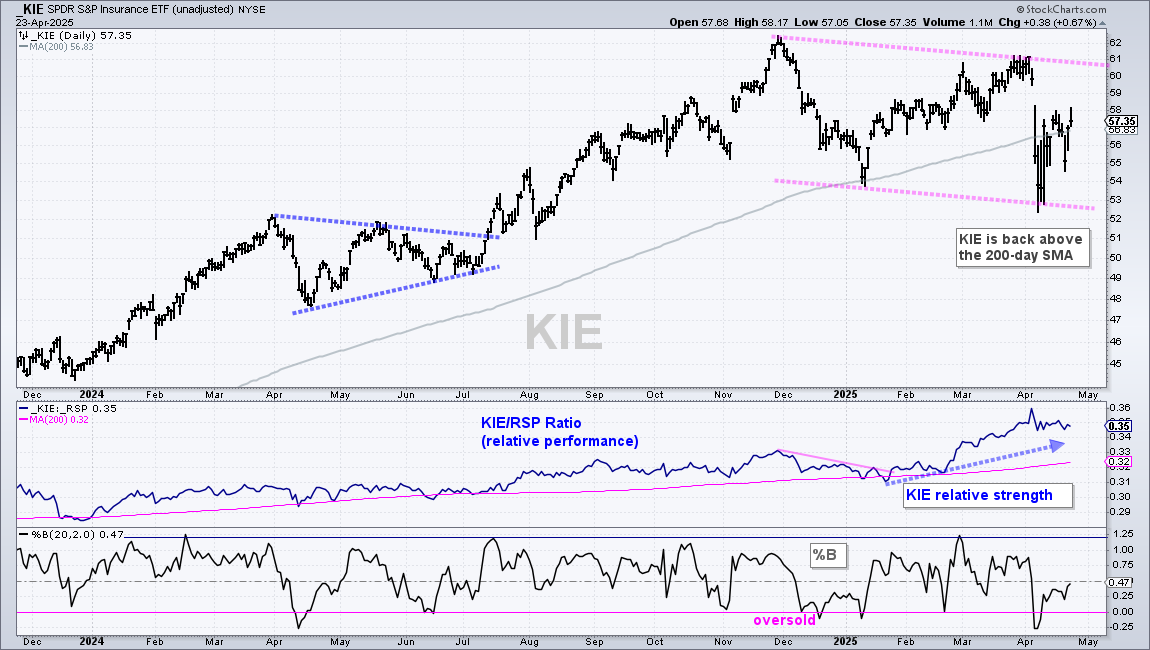
The Insurance ETF (KIE) recaptured its 200-day SMA this week and shows relative strength, but it is also in a downtrend. As the pink lines reflect, KIE formed a lower high from November to April and a lower low from January to April. Thus, we have relative strength within a downtrend, which means KIE is holding up better than the broader market.
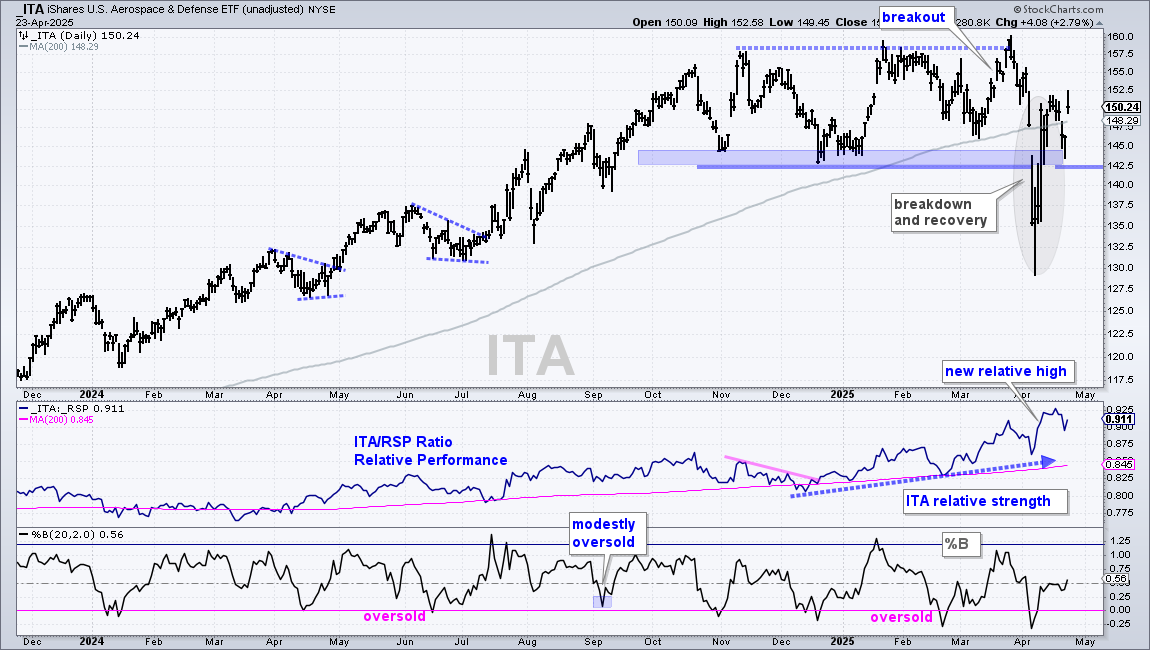
The Aerospace & Defense ETF (ITA) also broke down with the April plunge, but this breakdown is possibly a bear trap (false breakdown). ITA tagged a new high in late March, broke support for three days and then surged back above the support break. Thus, the breakdown did not hold. ITA is above its 200-day SMA and the price-relative (ITA/RSP ratio) hit a new high (relative strength). Support remains at 142.5 and a break here would be bearish.
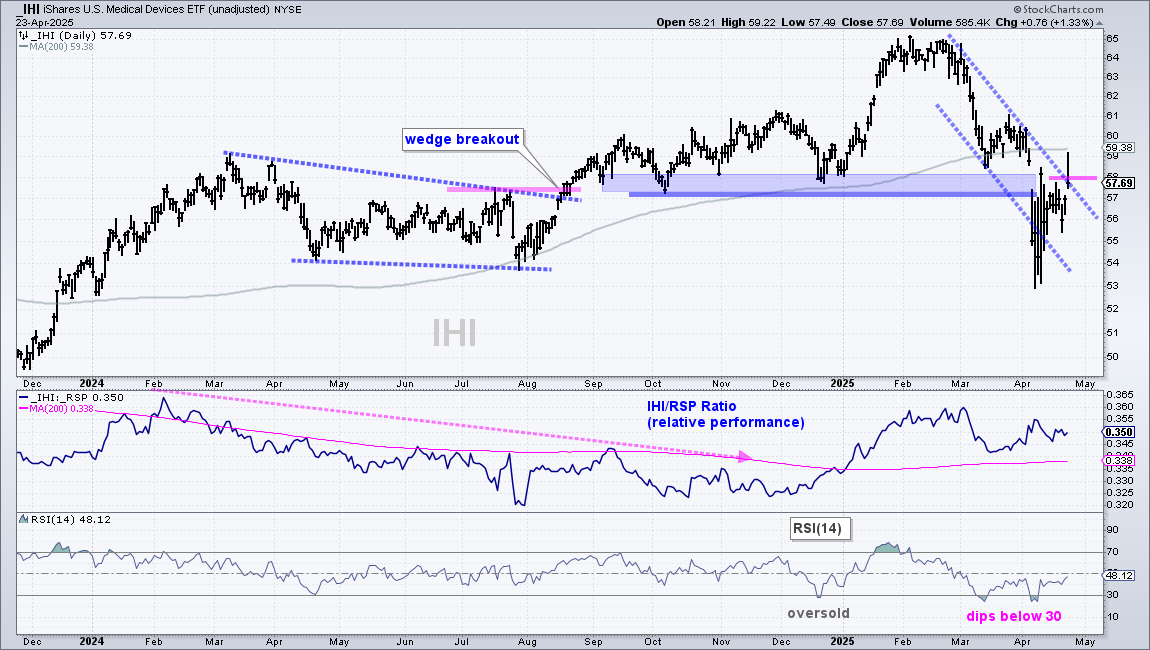
The Medical Devices ETF (IHI) is also trying to recapture its breakdown with a move back above 57. IHI was not immune to broad market weakness as it plunged below support at 57. The ETF recaptured this support break with a surge on April 9th and then consolidated in the 55-58 area. IHI is attempting to break out of a falling channel with this week’s bounce, but remains short and needs to close above 58.
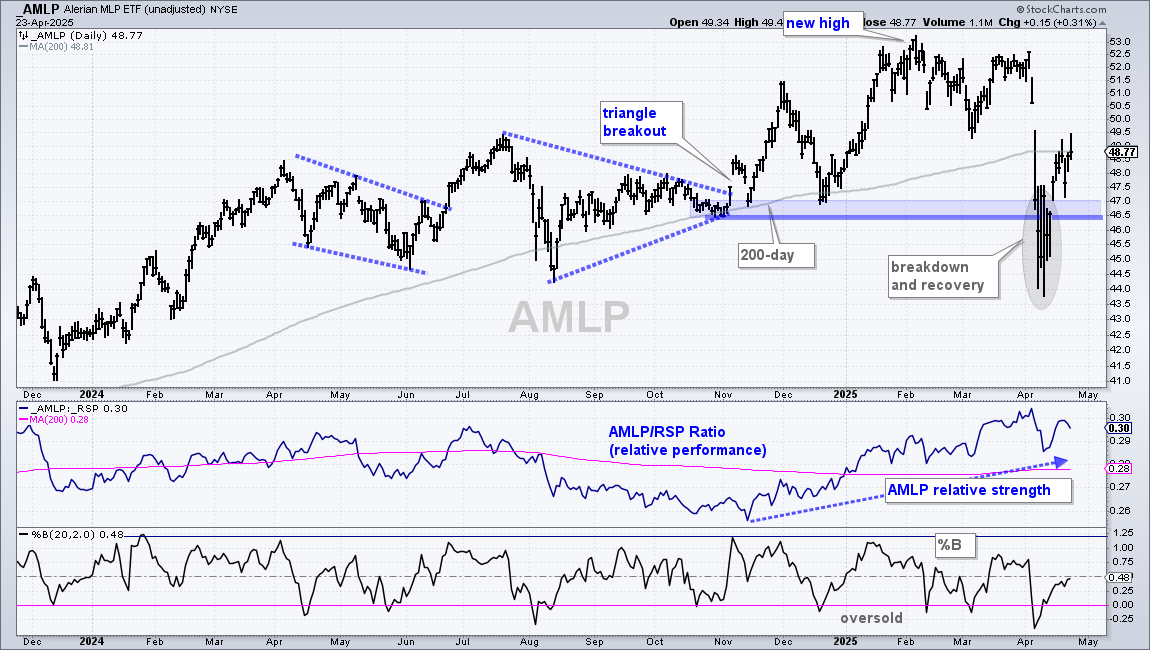
The MLP ETF (AMLP) held up throughout March and then plunged below its 200-day SMA in early April. The ETF recovered with a move back to the 200-day and shows a 1.27% year-to-date. SPY, for reference, is down 8.64% in 2025. Because AMLP held up in March and surged above the April 9th high, I view the support break at 46.5 as a failure (bear trap). There is not much of an uptrend on this chart, but AMLP is holding up relatively well with support reinstated at 46.50.
Send feedback to support(at)trendinvestorpro.com or use the contact form. [2]