Not Many Uptrends – Gold Gets Frothy – Silver Lags – Natty Tests Breakout – Bitcoin Sets Up
Posted By
Arthur Hill, CMT
On
In
Archive |
No Comments
The next report will be on Tuesday, April 22nd.
Today’s report will focus on some commodity-related ETFs for two reasons. First, we are in a bear market for stocks. Second, these ETFs are in uptrends. Despite these uptrends, volatility is increasing in this group as well. There is no escaping volatility these days. We will also cover Bitcoin because it is an alternative asset that is setting up.
We are in a bear market and the vast majority of equity ETFs are in downtrends. For trading equities, I require a bull market and a long-term uptrend. The odds are stacked against us during bear markets or when the ETF is in a downtrend. Negative odds are compounded when both are present (bear market and long-term downtrend). Above average volatility is also a negative.
Thus, there is not much choice for equity ETFs. Only a few are in uptrends and most of these are related to precious metals. My focus list has 70 ETFs and only eight are in uptrends.
Gold SPDR (GLD)
Gold Miners ETF (GDX)
Silver Miners ETF (SIL)
T-Bond TIPS 0-5 Yr (STIP)
T-Bond TIPS 0-20 Yr (TIP)
7-10 Yr Treasury Bond ETF (IEF)
Copper ETF (CPER)
Natural Gas ETF (NGAS)
Report Headlines
Gold Goes Parabolic
GDX Follows Gold with Massive Surge
SLV Bounces within Trading Range
Silver Miners ETF Tags New High
DBA Bounces off Bullish Setup Zone
Copper Continues its Wild Ride
Natural Gas ETFs Returns to Breakout
Bitcoin Hits Make or Break Level
Gold Goes Parabolic
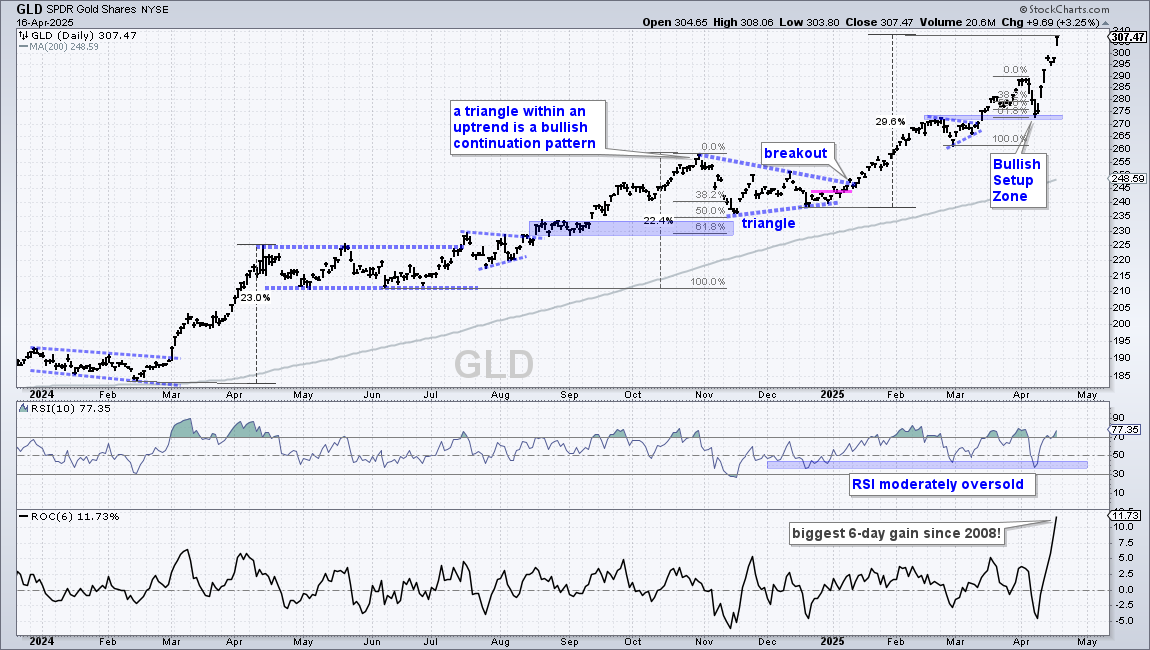
The Gold SPDR (GLD) is going parabolic with a 29% advance since late December and an 11.73% surge the last six days. This is the biggest 6-day gain since, you guessed it, 2008. GLD is still in a long-term uptrend, but big gains after an extended advance can be dangerous. A big 1-2 week surge off a multi-month often ignites an extended uptrend. However, a big 1-2 week surge after an extended advance is often a sign of excess that could foreshadow a pullback or consolidation.
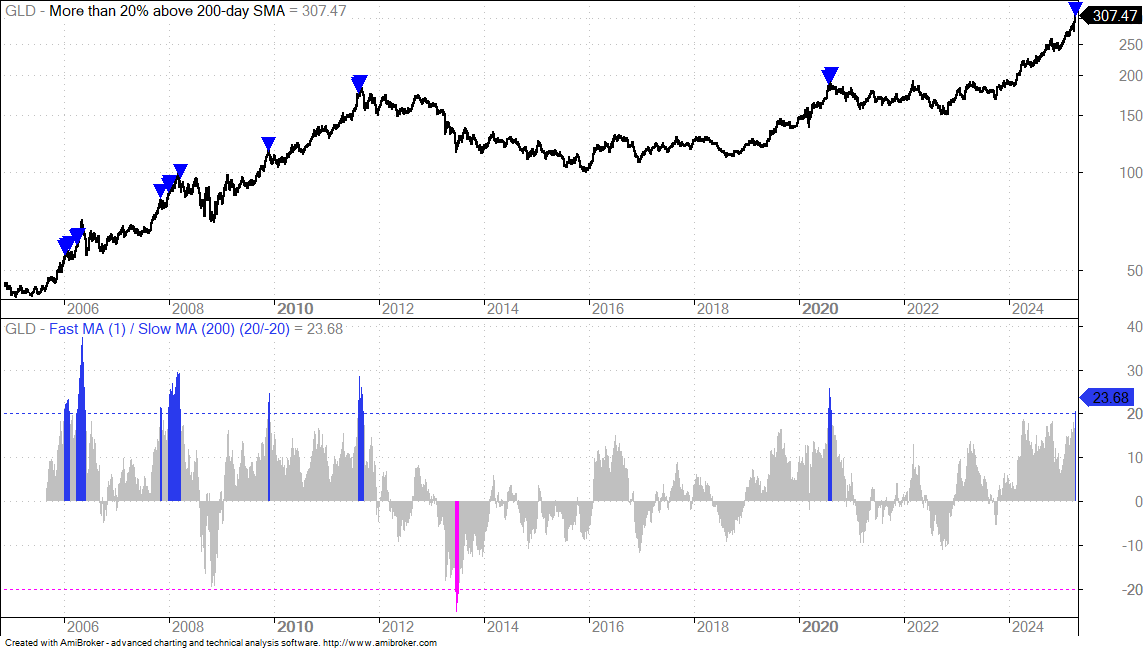
The next chart shows GLD more than 20% above its 200-day SMA for the twentieth time in 20 years (blue triangles). There were clusters in 2006 and 2008 as GLD continued higher. There was a minor peak at the end of 2009, and major peaks in August 2011 and July 2020. GLD is currently 23.68% above its 200-day SMA and looking extended.
GDX Follows Gold with Massive Surge
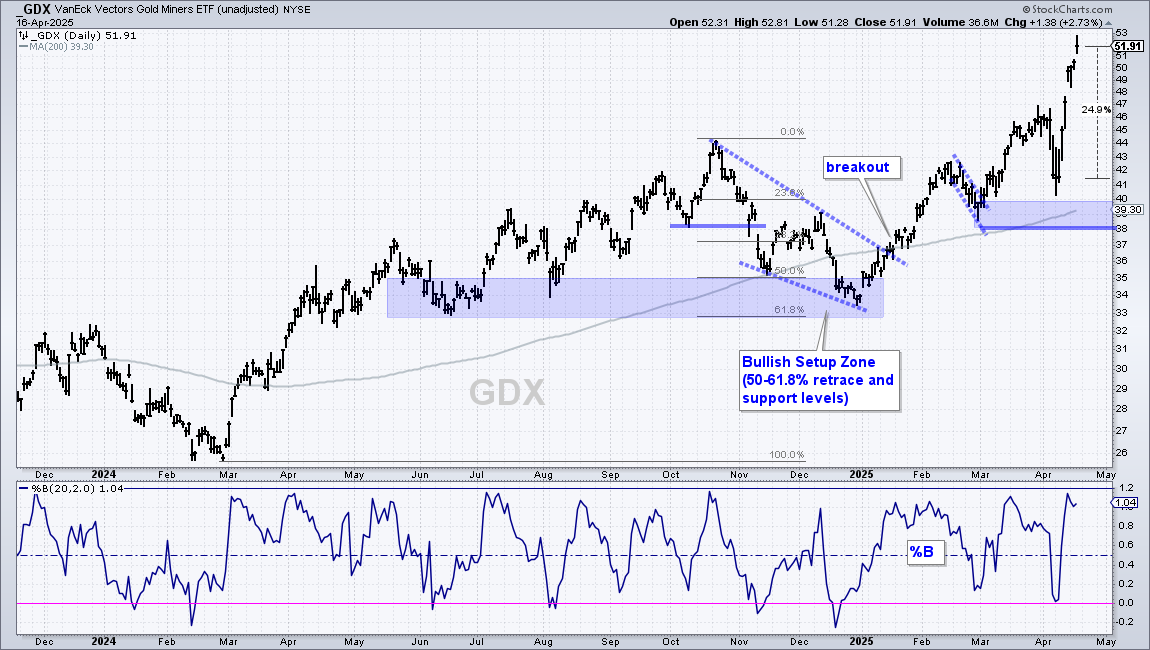
The Gold Miners ETF (GDX) is trading at a 52-week high and keeping pace with gold recently, but lags long-term because it is well below its 2011 high (~63). Note that GDX is up 25% the last six days, which is the biggest 6-day gain since the surge off the March 2020 low. Again, this surge is occurring after an advance since January and the steepness looks excessive. This is not bearish, but it reflects a market that is getting out of control and vulnerable to a corrective period. Corrections can take shape as pullbacks or consolidations.
SLV Bounces within Trading Range
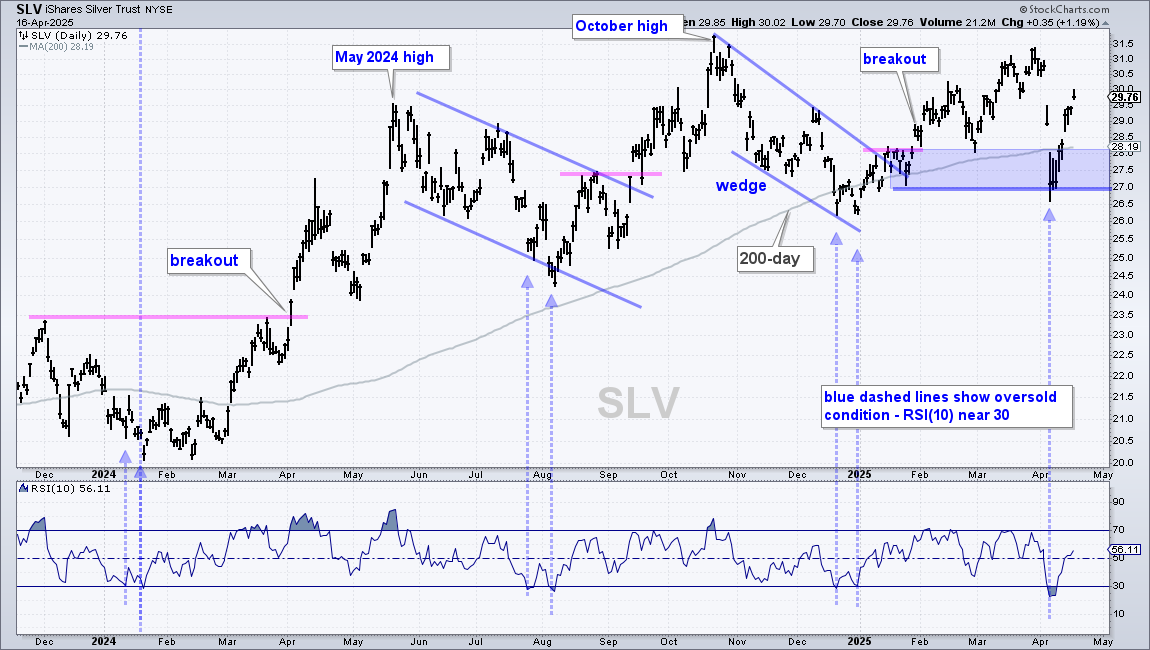
While GLD trades at all time highs, note that the Silver ETF (SLV) remains well below its 2011 high (47), and below its October 2024 and March 2025 highs. SLV plunged in early April, but held the support zone (blue shading) and got an oversold bounce the last six days. This bounce was not as strong as the bounces in GLD and GDX. Even though SLV is back above the rising 200-day SMA, I would be hard pressed to call this an uptrend because SLV is below its October-March highs and essentially flat the last six months.
Silver Miners ETF Tags New High
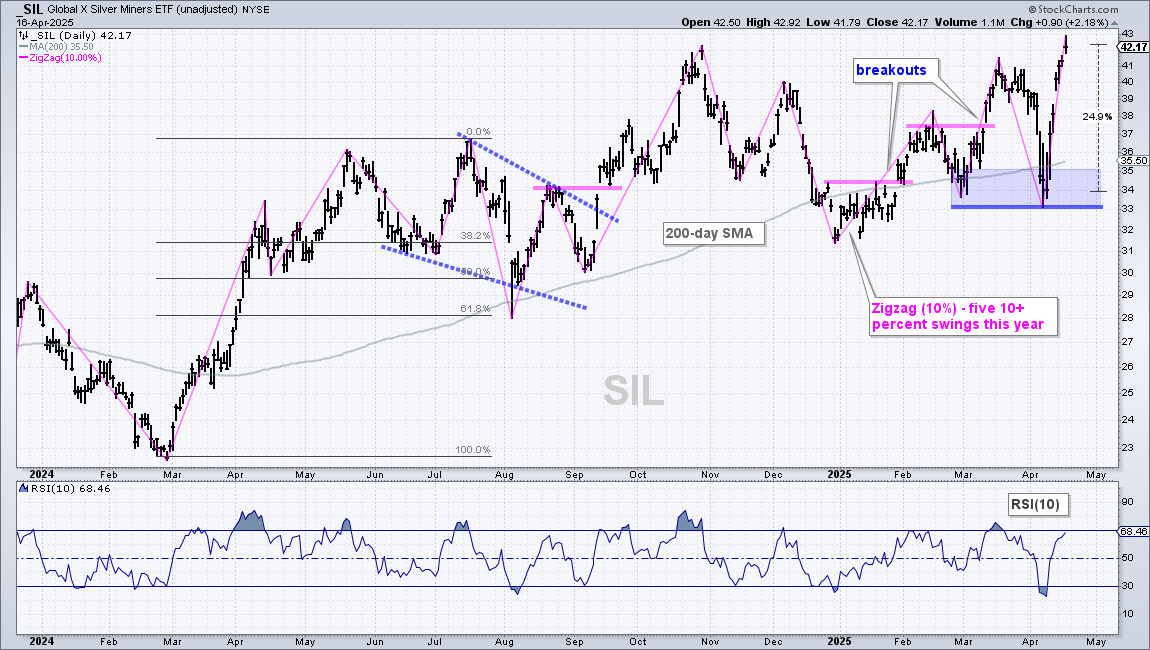
The Silver Miners ETF (SIL) is stronger than SLV because it surged to a new high this week. While I cannot make the case for an uptrend in SLV, I can make the case for SIL. However, this is one choppy uptrend with lots of 10+ percent swings in both directions. The pink line is the Zigzag (10%) indicator, which changes directions when the move is 10% or more (high to low). So far, we have five 10+ percent swings this year with the most recent surge hitting +25% (in six days). This is one volatile uptrend. Buckle up!
DBA Bounces off Bullish Setup Zone
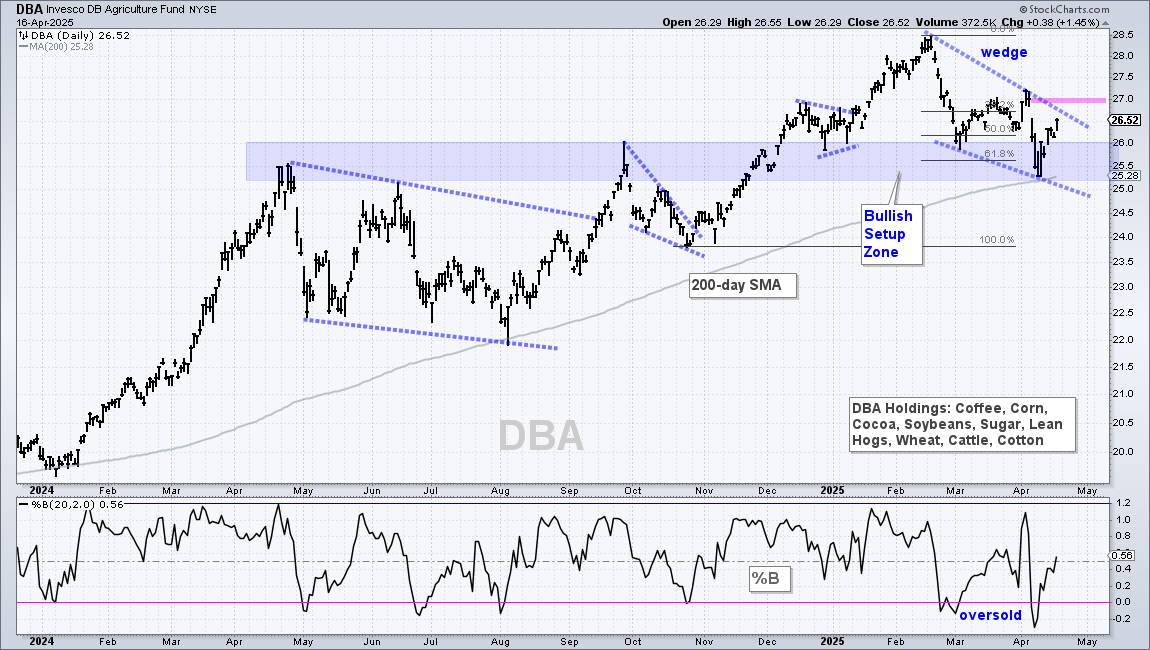
The DB Agriculture ETF (DBA) fell with the rest of the market in early April and broke its January-March lows. Even so, I can still make the case for a long-term uptrend because DBA hit a new high in February and did not break the rising 200-day SMA. In addition, the decline into April formed a falling wedge and hit a Bullish Setup Zone. The 2024 highs (broken resistance), the 61.8% retracement and the rising 200-day SMA mark this zone. DBA surged the last six days and a breakout at 27 would be bullish.
Copper Continues its Wild Ride
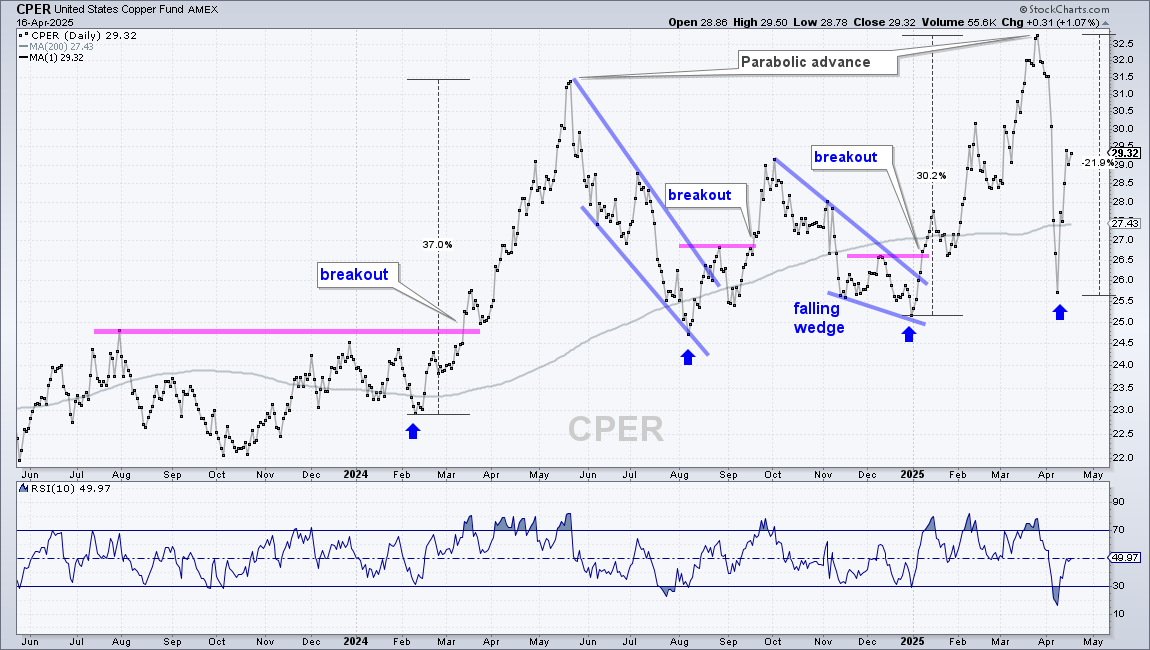
The Copper ETF (CPER) remains in a long-term uptrend, but volatility is through the roof in 2025. Note that the price plot is based on closing prices (black dots) and a 1-day SMA (gray line). First, CPER is in a long-term uptrend. The blue arrows show higher lows since early 2024 and CPER hit a 52-week high in March. For the second time in 13 months, CPER went parabolic with a 30% advance in early 2025. As with the 2024 parabolic move, this one ended ugly as the ETF fell 22% into early April. CPER has since rebounded and is back above the rising 200-day SMA. Even though I can make the case for an uptrend, the extreme volatility means this ETF not worth the risk (IMHO).
Natural Gas ETF Returns to Breakout
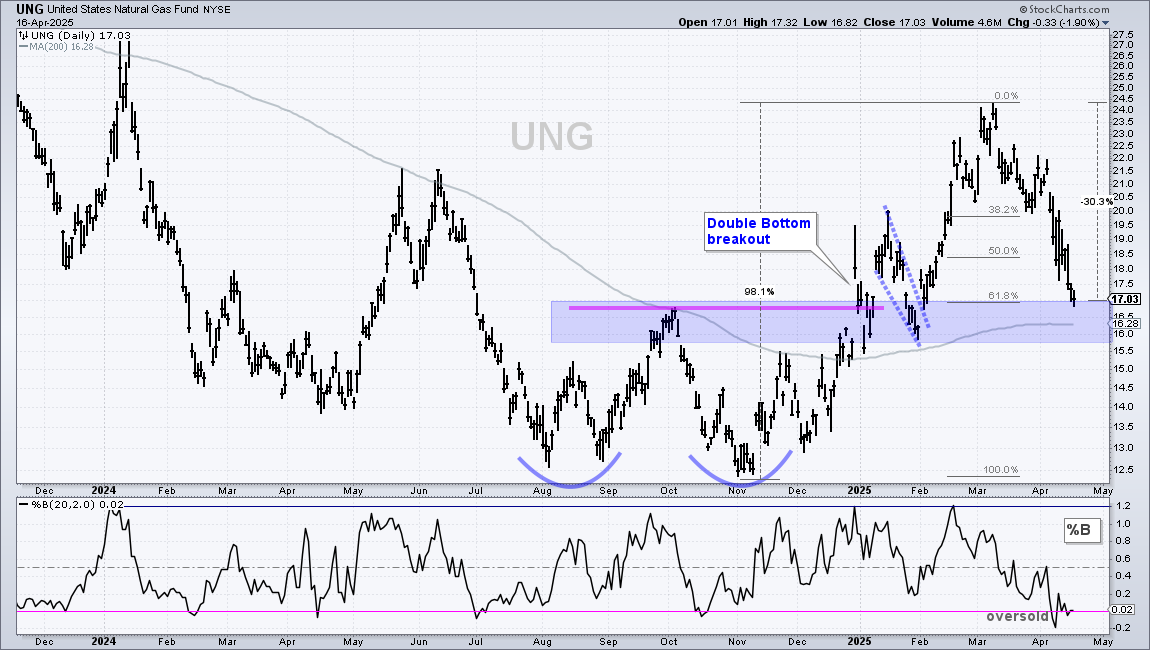
Speaking of volatility, the next chart shows the Natural Gas ETF (UNG) with a 98% gain into early March and a 30% decline into mid April. Because of its volatility, “natty” was called the “widow maker” in the commodity pits. Overall, UNG formed a Double Bottom and confirmed this reversal with a breakout in late December and early January. After a surge to 24, the ETF fell back to the breakout level and I am marking a Bullish Setup Zone in the 16-17 area (blue shading). Here we have the 61.8% retracement, broken resistance (turned support), the late January low and the 200-day SMA. UNG is also oversold as %B dipped below zero. The ETF is setting up for a bounce because it is oversold and trading in a Bullish Setup Zone. Be careful with this one!
Bitcoin Hits Make or Break Level
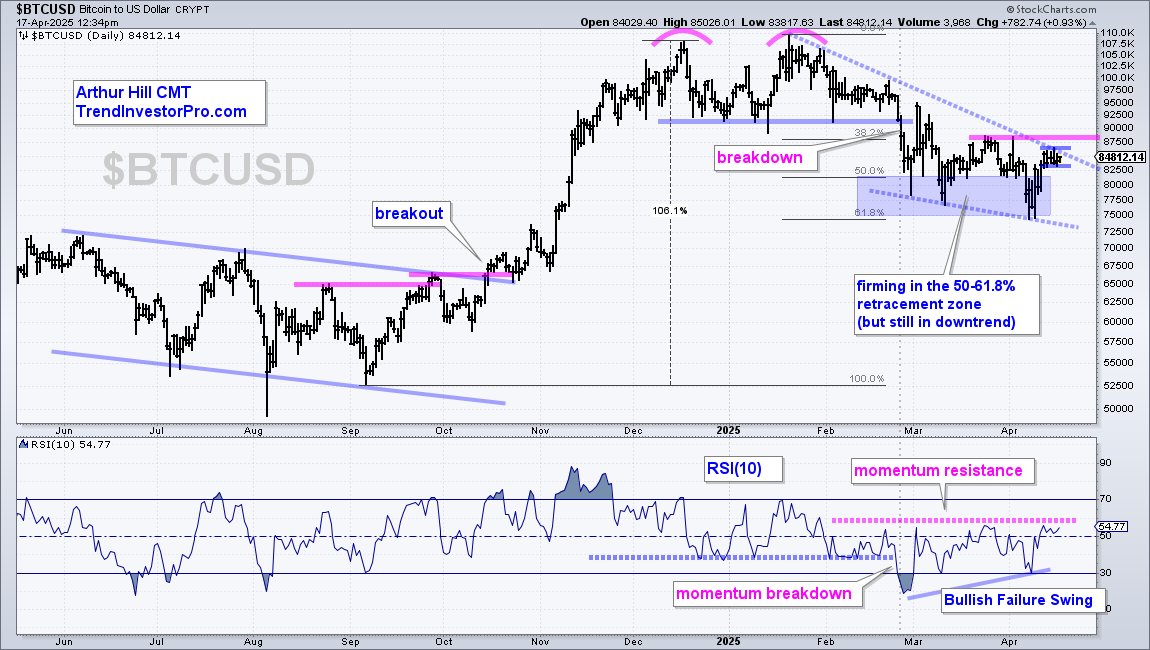
Bitcoin ($BTCUSD) has long-term and short-term bullish setups working. Long-term, Bitcoin is firming in a key retracement zone as a falling wedge takes shape. $BTCUSD surged some 106% and then retraced 50-61.8% with the decline into March-April. These retracements show a possible two steps forward and one step backward sequence. Second, a falling wedge formed. The retracements and pattern are typical for corrections after advances. Bitcoin established support in the 75000-80000 area in March-April. The only thing missing is a breakout at 88000 (pink line). Short-term, there was a surge from April 9th to 12th and then a tight consolidation. This looks like a bull flag and a breakout at 86500 would be bullish.
The bottom window shows RSI(10) with a bullish failure swing taking shape. Welles Wilder, creator of RSI, identified the bullish failure swing in his 1978 classic, New Concepts in Technical Trading Systems. A bullish failure swing forms when RSI falls below 30, bounces, falls back and then fails to go below 30. The ability to hold above 30 on the second dip shows less downside momentum that can foreshadow a reversal. This bullish failure swing is confirmed with a break above the prior highs (call it 60).
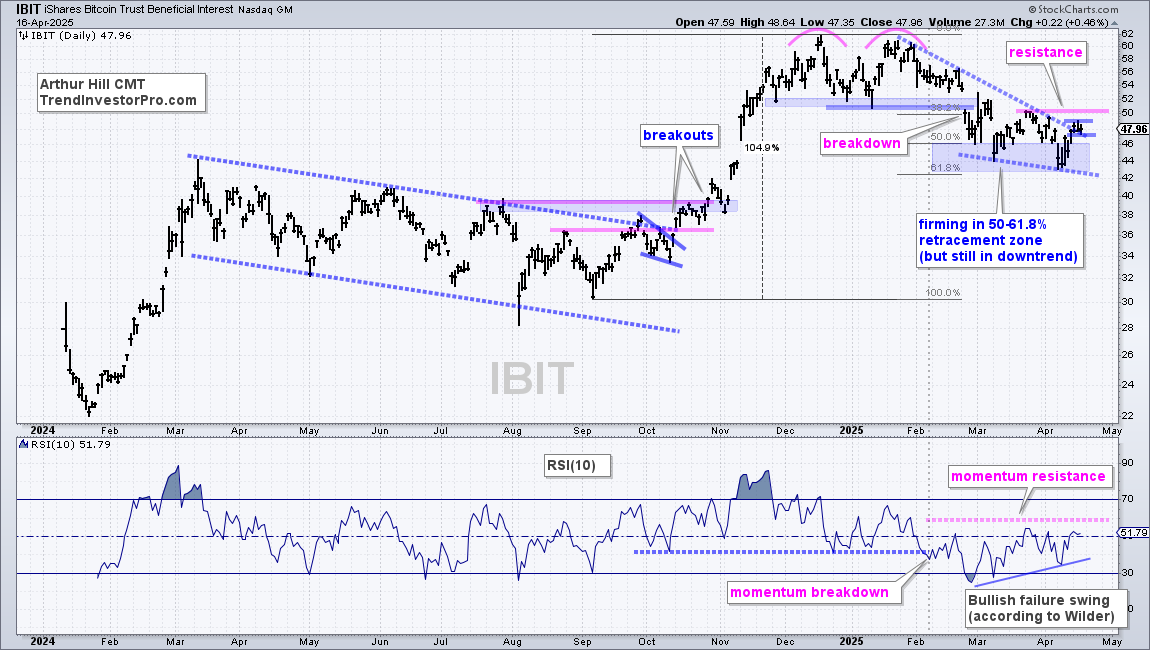
The next chart shows the Bitcoin ETF (IBIT) with similar characteristics.
Send feedback to support(at)trendinvestorpro.com or use the contact form. [1]