Market/ETF Report – Not Oversold – Downtrends Remain – Precious Metals Lead – Bitcoin Failure Swing
Posted By
Arthur Hill, CMT
On
In
Archive |
No Comments
The next report/video will be on Wednesday, April 16th.
The weight of the evidence remains bearish for stocks and the bounce over the last four days is considered an oversold bounce. Our short-term breadth thrust indicators have yet to trigger. Until these indicators trigger, I will consider this a bear market bounce. This means negative outcomes are still more likely than positive outcomes. Resistance zones are more likely to hold and support levels are more likely to be broken. In short, risk in stocks remains above average. See this report[1] for an update on the thrust indicators.
Most equity ETFs broke down and reversed their uptrends in mid March. The remaining holdouts broke down with sharp declines in early April. Stocks came roaring back the last four days, but these bounces did not undo the technical damaged that occurred over the past month. SPY, QQQ and most equity ETFs remain in long-term downtrends. Short-term, they are no longer oversold and ripe for a bounce. In fact, the situation is just the opposite. They are looking short-term overbought within a long-term downtrends, which could limit upside from here.
Report Headlines
Bear Market Bounce
SPY is No Longer Oversold, and Downtrend Remains
QQQ Gets Oversold Bounce within Downtrend
TLT Remains with Breakdown and Downtrend
Dollar and Yields Disconnect
9 Equity ETFs Holding Up the Best
Gold and Gold Miners Lead
Silver and Silver Miners Bounce
Bitcoin ETF Forms Falling Wedge
SPY is No Longer Oversold, and Downtrend Remains
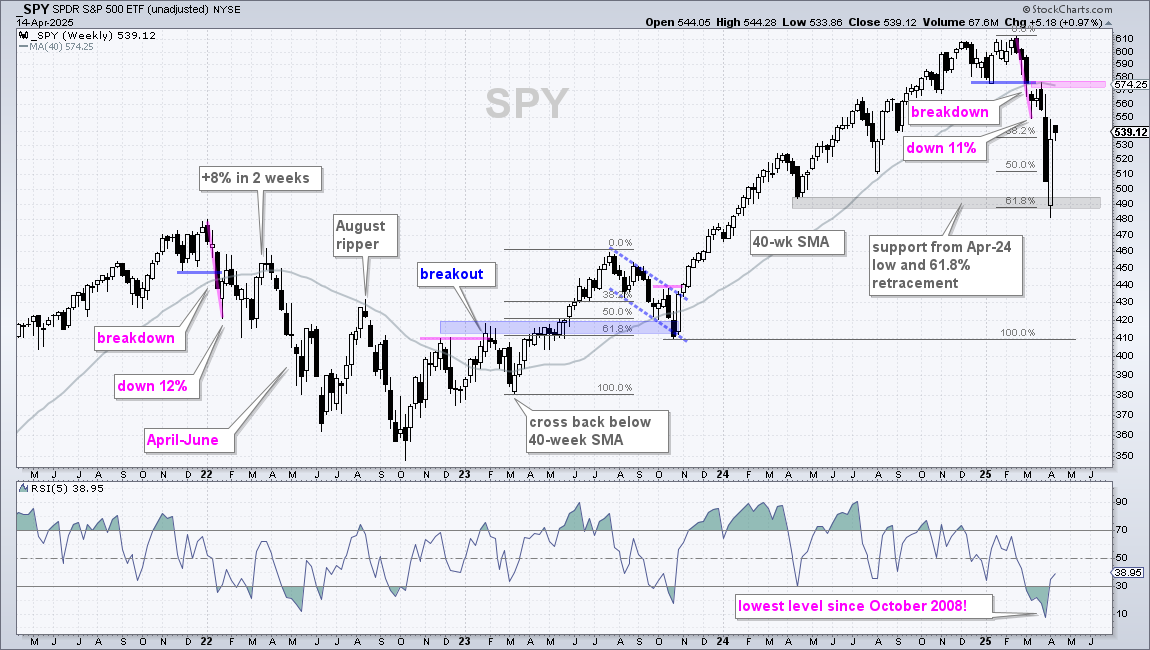
The first chart shows SPY with weekly candlesticks. As with January 2022, SPY broke support and the 200-day SMA with a double-digit decline into March. This is the straw that broke the bull’s back. SPY fell to the 490 area (gray shading), became extremely oversold and rebounded with a move to the 540 area. This is just a bear market bounce. SPY is still below the 40-week SMA and this moving average is turning down.
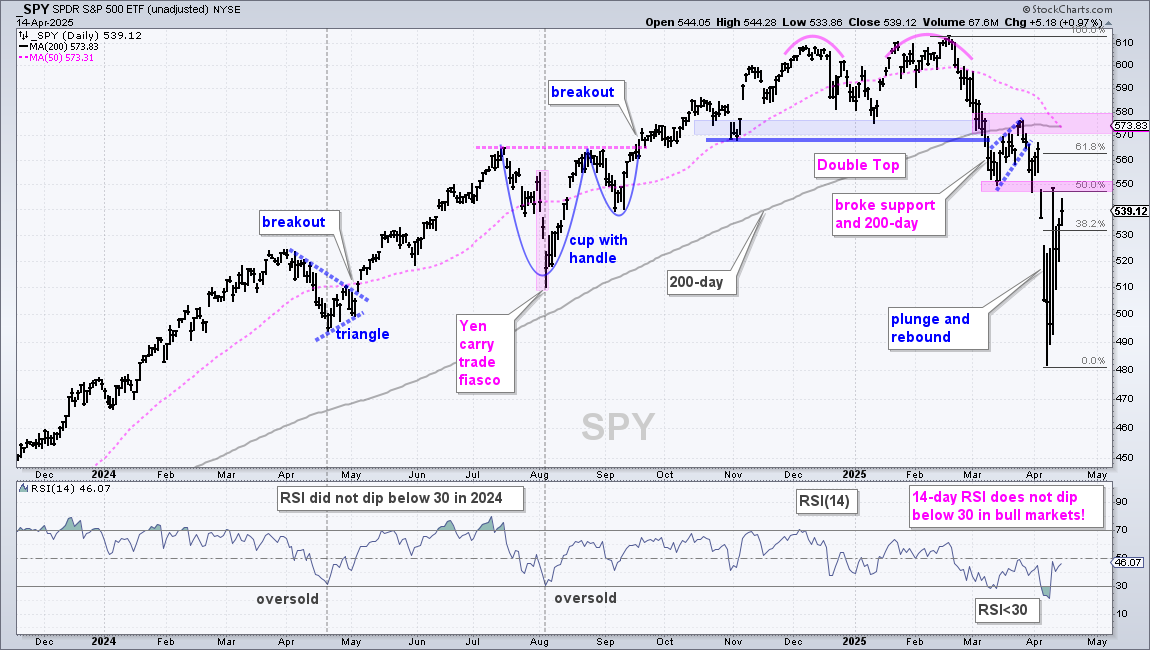
The next chart shows daily bars and the first Bearish Setup Zone coming into play. These zones are the opposite of Bullish Setup Zones. When the long-term trend is down, I use broken supports and prior peaks to define resistance and retracement levels to measure oversold bounces. A Bearish Setup Zone is present when resistance and retracement levels overlap. Broken support turns resistance in the 550 area and we also have the 50% retracement here. The pink shading shows this Bearish Setup Zone, which means upside could be limited.
Keep in mind that conditions are extremely volatile and the news flow is all over the place. This means we could get overshoots on the upside and downside. There is a second Bearish Setup Zone in the 570 area. Here we have the 200-day SMA, 50-day SMA, broken support (January low) and the late March high (resistance).
QQQ Gets Oversold Bounce within Downtrend
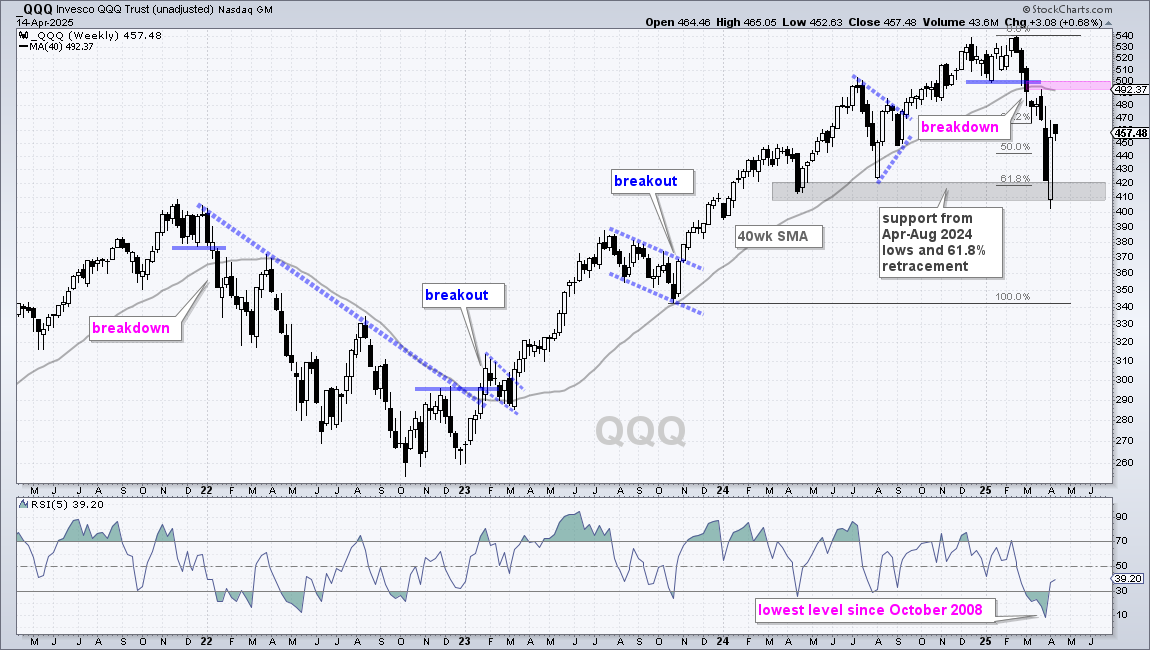
The next chart shows weekly candlesticks for QQQ. As with SPY, QQQ broke down in early March and the long-term trend is down. QQQ remains below this support break and below the 40-week SMA, which turned down this month. After a plunge to 410, QQQ was extremely oversold and got an oversold bounce back to the 460 area. This is considered a bear market bounce.
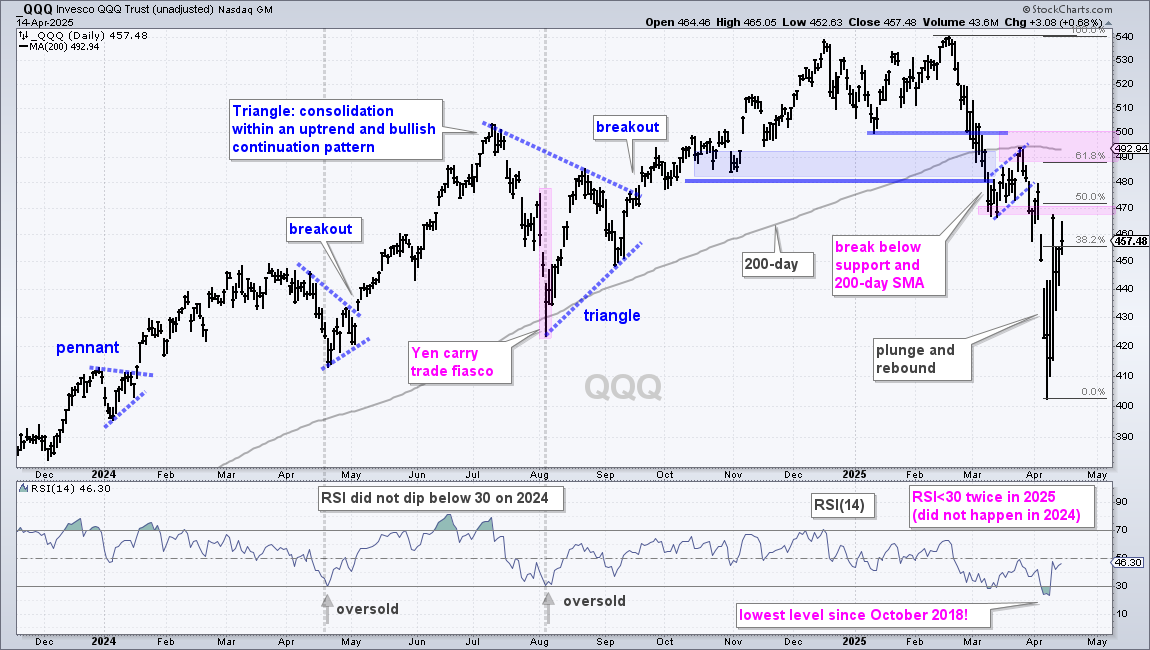
The next chart shows daily bars with two Bearish Setup Zones (pink shading). The first is in the 470 area (50% retracement and broken support). The second is in the 490-500 area (200-day SMA, late March high, January low (broken support) and 61.8% retracement).
TLT Remains with Breakdown and Downtrend
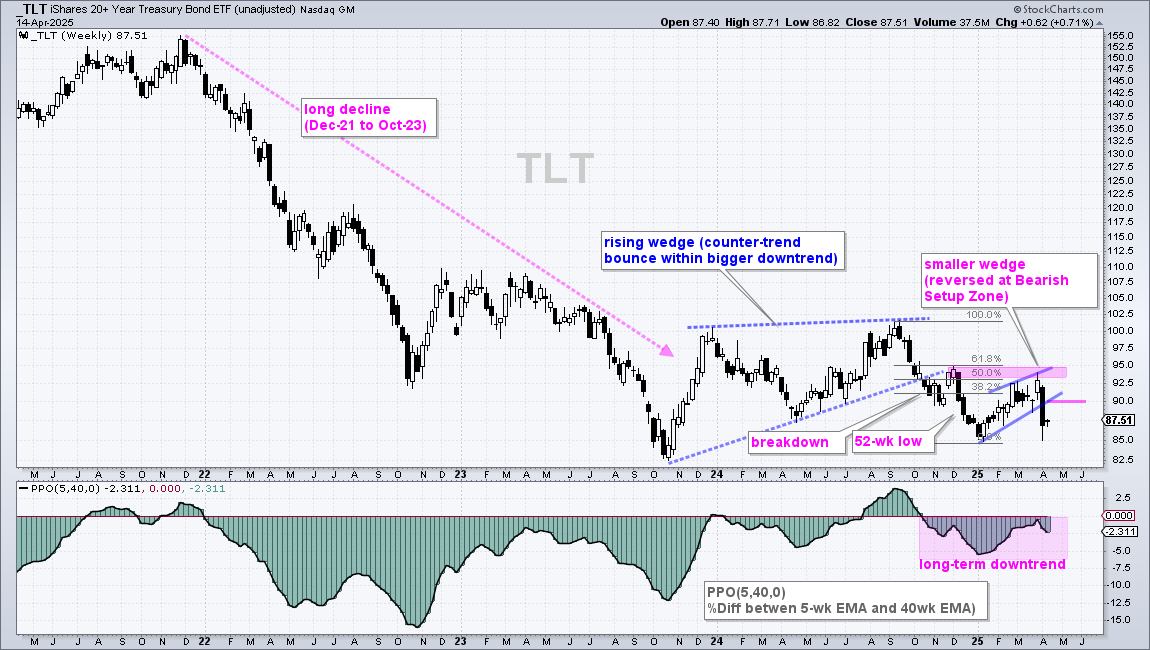
The 20+ Yr Treasury Bond ETF (TLT) is a concern because it plunged last week and reversed its short-term upswing. Bonds are supposed to be safe-havens that attract money when stocks (risk assets) fall. This is another sign that the financial markets are out of whack. First note that TLT is in a long-term downtrend since the wedge break in October 2024 and 52-week low in December. TLT rose the first three months of 2025, but reversed at a Bearish Setup Zone (pink shading) after a sharp decline last week. TLT broke rising wedge support and this signals a continuation of the bigger downtrend. My re-evaluation level is set at 90. A strong recovery back above 90 would be negate the wedge break.
Dollar and Yields Disconnect
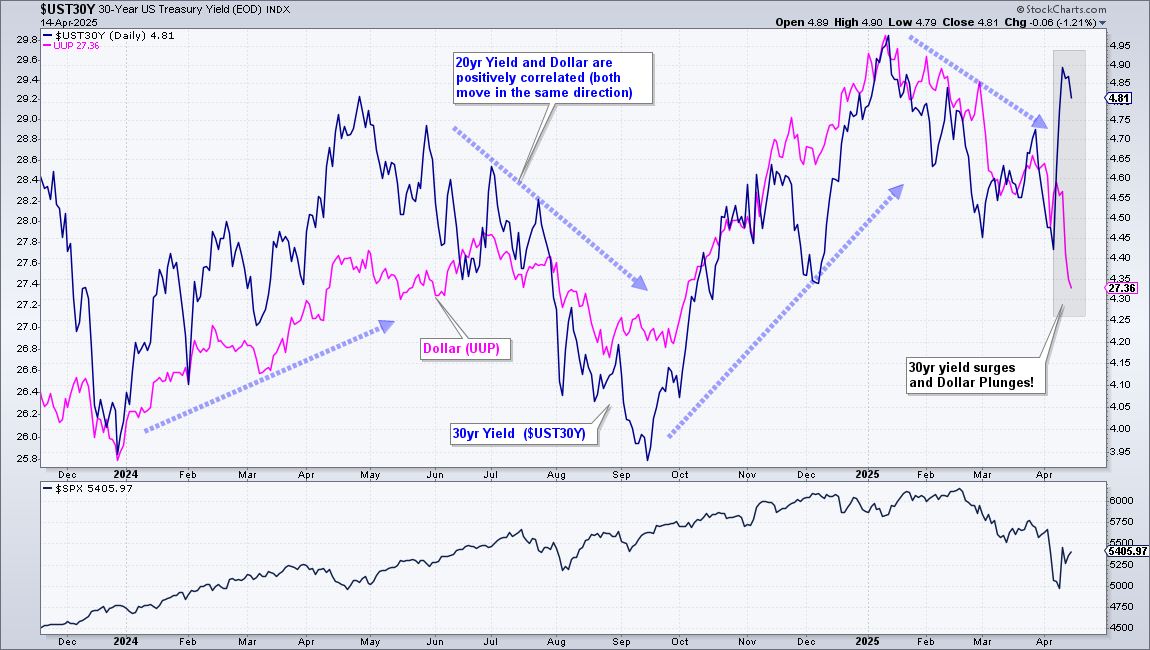
There is also a concerning disconnect between long-term Treasury yields and the Dollar. These two are normally positively correlated, which means they move in the same direction. This positive relationship was upended as the 30-yr Yield ($UST30Y) surged above 4.8% and the Dollar Bullish ETF (UUP) plunged (gray shading). This means money moved out of long-term Treasury bonds and the Dollar. The Dollar is normally a safe-haven currency that goes up in times of uncertainty. This is clearly not the case right now. Something is not right here, and this needs to be resolved for stocks to find their footing.
Equity ETFs Holding Up the Best
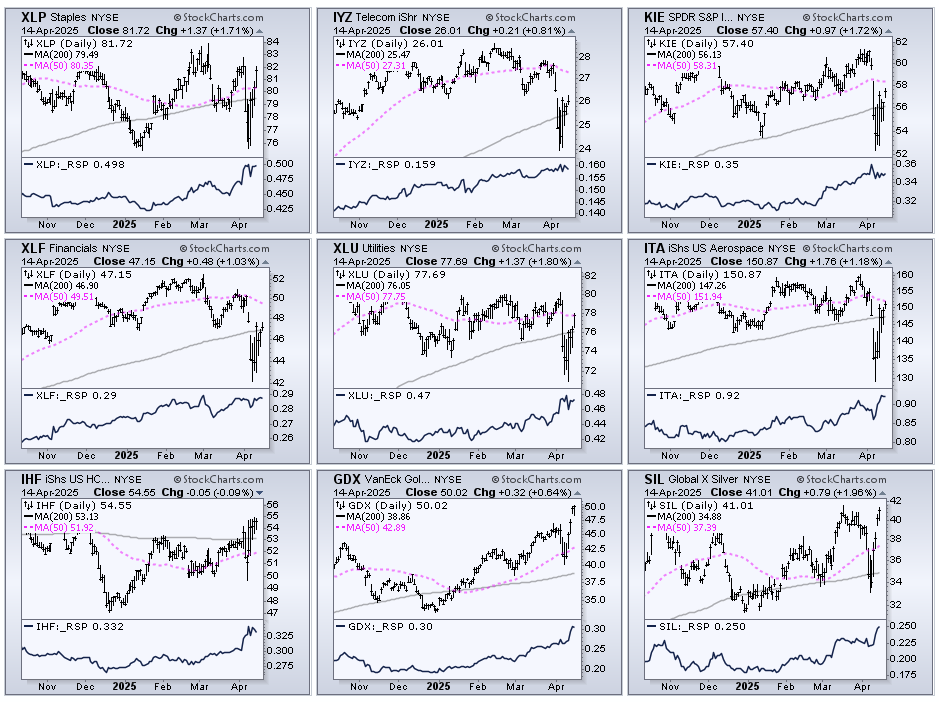
Equity ETFs are off my radar because we are in a bear market. Some are holding up better than the broader market because they are down less. This is the relative performance game. The CandleGlance charts below show nine ETFs with rising price-relatives in the lower windows. The price-relative is the ETF divided by the S&P 500 EW ETF (XLP/RSP ratio). Eight of the nine reclaimed their 200-day SMAs with the surge over the last four days. GDX did not break its 200-day in April and is the strongest of the group.
Consumer Staples SPDR (XLP)
Healthcare Providers ETF (IHF)
Telecom ETF (IYZ)
Insurance ETF (KIE)
Finance SPDR (XLF)
Utilities SPDR (XLU)
Aerospace & Defense ETF (ITA)
Gold Miners ETF (GDX)
Silver Miners ETF (SIL)
Gold and Gold Miners Lead
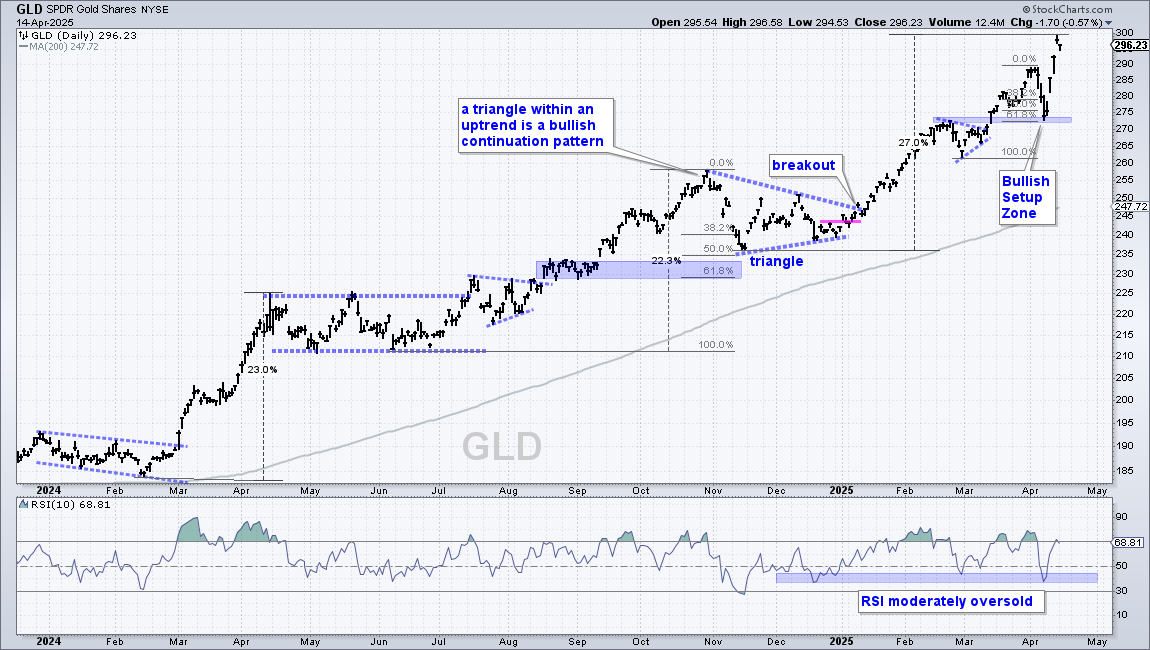
The Gold SPDR (GLD) continues to lead everything with another new high last week. GLD is up 27% since mid November and one of the few assets showing gains since the election. After a short pullback to the Bullish Setup Zone around 272, GLD immediately reversed and shot to new highs last week. There is no setup on this chart, just a leading uptrend.
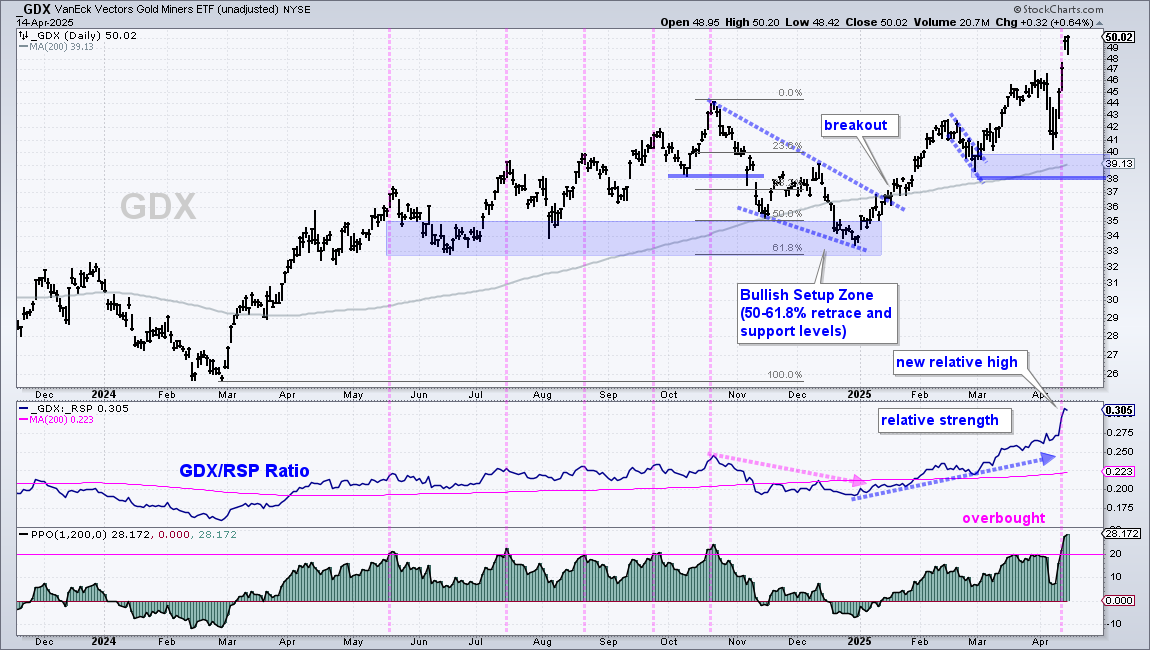
The Gold Miners ETF (GDX) also pulled back in early April and then surged to new highs last week. GDX is getting extended as the PPO(1,200,0) exceeded +20% (pink dashed line). This means the close is more than 20% above the 200-day EMA.
Silver and Silver Miners Bounce
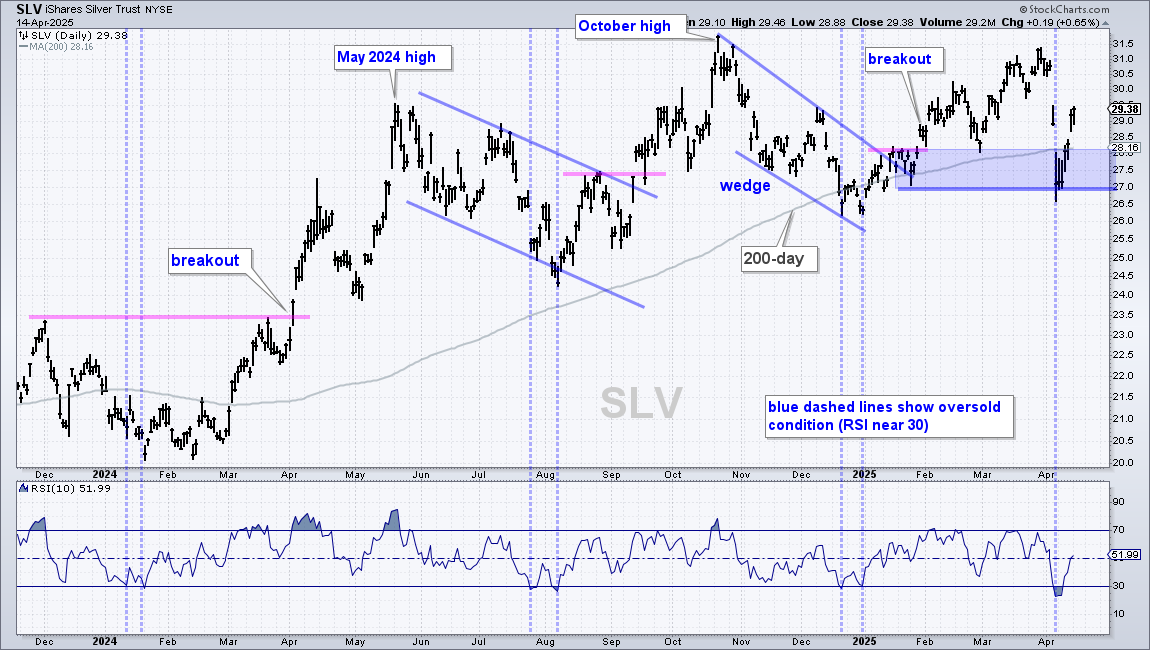
The Silver ETF (SLV) is not nearly as strong as gold, but it managed to hold support and reclaim the 200-day SMA with a strong bounce. SLV plunged in early April, became oversold as RSI dipped below 30 and surged 8.5% in four days. Even though SLV is back above the 200-day SMA, this is not a strong uptrend. SLV is currently trading just below the May 2024 high and the March 2025 high was below the October 2024 high.
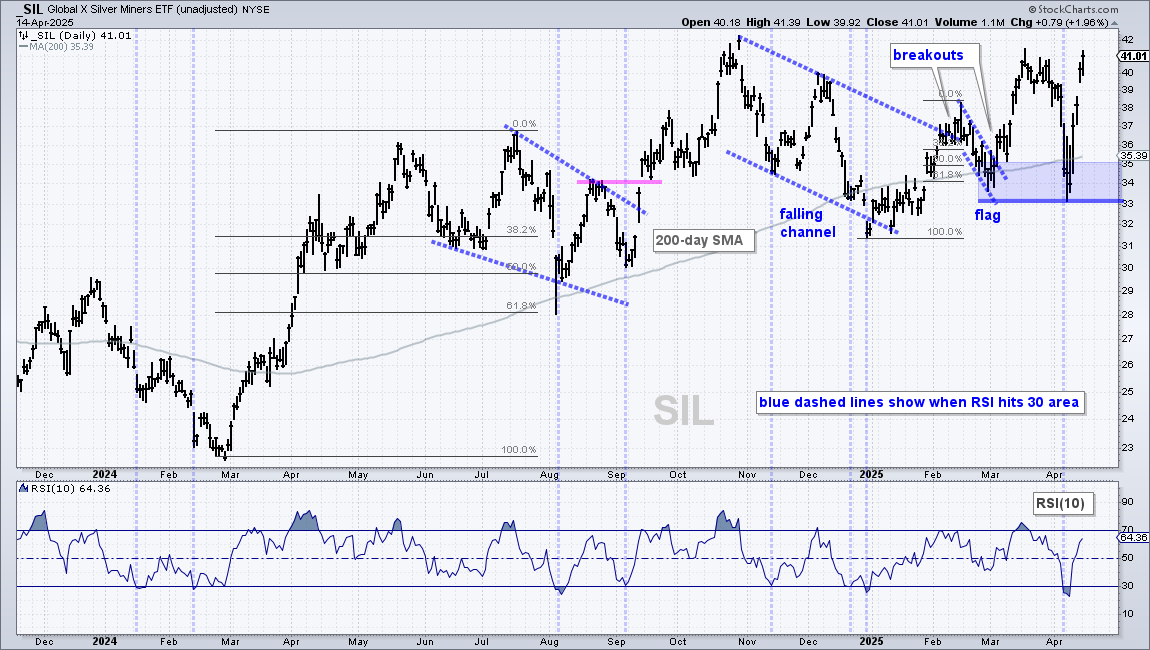
The Silver Miners ETF (SIL) surged off support with a big move the last four days. SIL dipped below the 200-day SMA in early April, but found support near the early March low as RSI(10) dipped below 30 to become oversold (blue dashed lines). The combination of support and oversold led to a strong bounce. The overall uptrend is quite choppy for SIL, but it is still a leading uptrend.
Bitcoin ETF Forms Falling Wedge
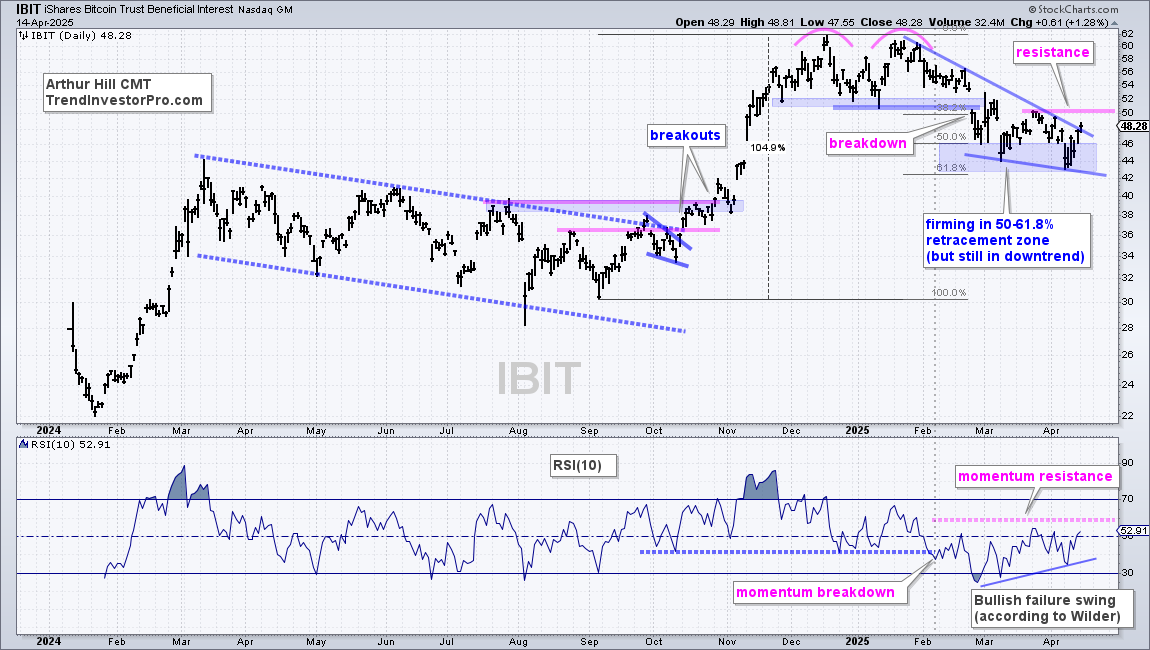
The Bitcoin ETF (IBIT) is setting up bullish as a falling wedge takes shape and the ETF firms in the 50-61.8% retracement zone. Note that the falling wedge is typical for a correction after a big advance, and the prior advance was 105%. The retracement amount (50-61.8%) is also typical for corrections. A reversal/breakout is the only thing missing. IBIT edged above the upper wedge line and a break above the late March high would reverse the downtrend. I am also watching RSI for a breakout as it formed a bullish failure swing[2]. This formed because the April dip did not go back below 30. A breakout at 60 would be bullish for momentum.
Send feedback to support(at)trendinvestorpro.com or use the contact form. [3]