Market Report – Down/Up – Evidence Unchanged – No Thrust, but Watching – SPY – QQQ
Posted By
Arthur Hill, CMT
On
In
Archive |
No Comments
The next report will be on Tuesday, April 15th
The analysis mode remains macro because the weight of the evidence is still bearish for stocks. Moreover, the markets are unhinged with stocks, commodities, currencies and Treasury bonds fluctuating wildly. Chaos makes chart analysis exceptionally difficult. Perhaps there is opportunity in the chaos, but the current market environment is for nimble traders with quick trigger fingers.
The general rule in bear markets is to sell into rallies. This is the opposite of bull markets, where the general rule is to buy the dip or pullback. Yesterday’s rebound was sharp and swift, just like the rebounds in 2008. Nobody knows how long the bear market will last, how far it will extend or what path it will take. It will remain in force until the evidence changes.
These ETFs recaptured their 200-day SMAs and are holding up the best within the equity market: XLF, XLC, CIBR, KIE, ITA, IYZ
These ETFs are above their 200-days SMAs and weathering the storm relatively well: GDX, GDXJ, GLD, DBA
These stocks are above their 200-day SMAs and weathering the storm relatively well: TTWO, TJX, GH, VRTX, NOC
Pretty much everything fell over the four trading days from April 3rd to 8th – and then surged on April 9th with monster gains that recouped most of the losses. The plunge was driven by the tariff announcement on April 3rd and the surge was driven by the tariff announcement on April 9th. Clearly, these announcements carried a different tone. It makes me wonder: what was the point of the last five days?
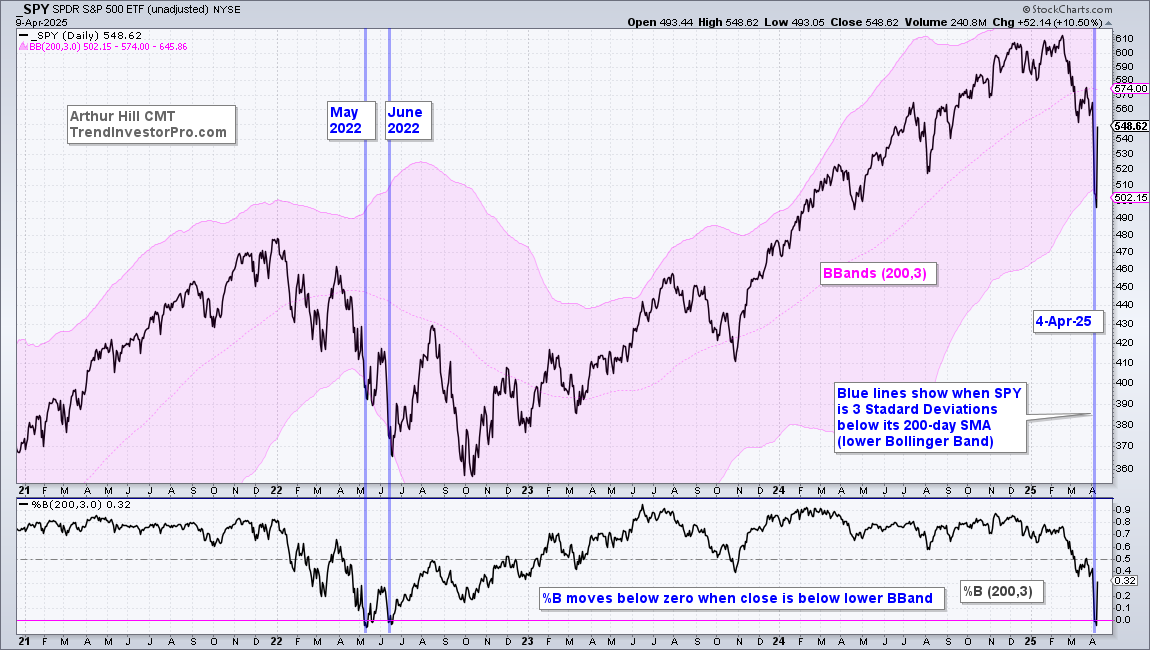
Stocks became extremely stretched when SPY fell over 4% in two days (April 3-4) and then continued lower the next two trading days (April 7-8). SPY moved below the lower Bollinger Band (200,3), which means it was 3 standard deviations below its 200-day SMA. Stocks were ripe for an oversold bounce since the close on April 4th.
Bond Market Scare
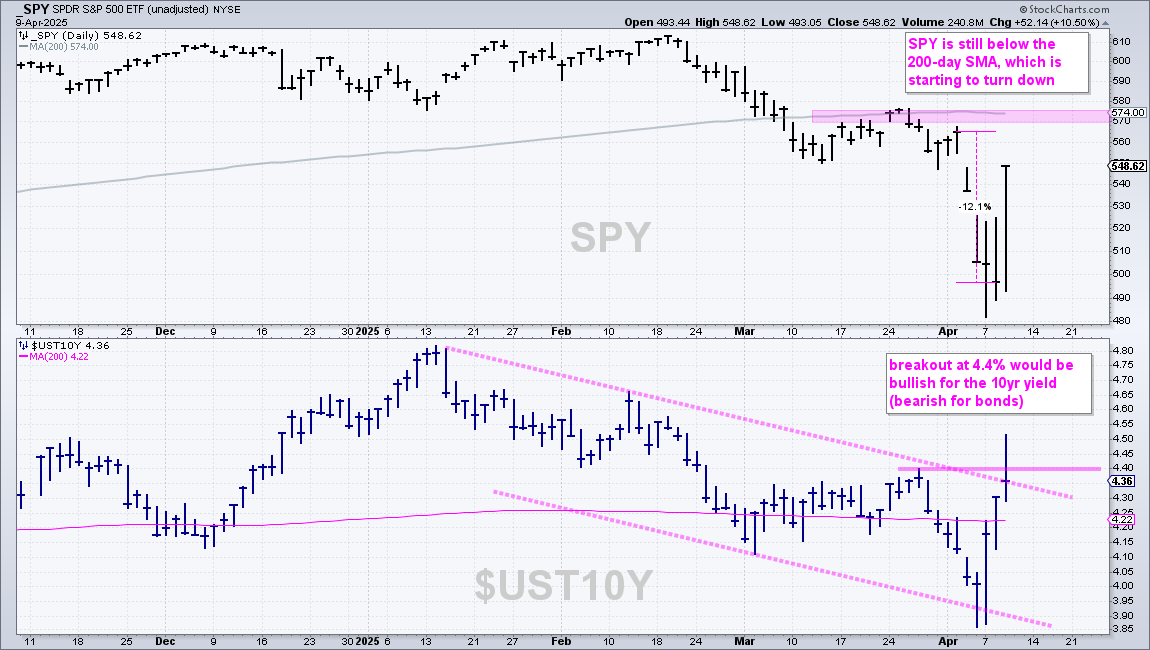
The bond market acted normal as the 10-yr Treasury Yield fell to 4.00% on April 3-4, but then surged to 4.3% on April 7-8 (TLT plunged). Yields falling when stocks plunge is normal, but yields surging when stocks continue lower is not. This disconnect may have triggered a milder tone on tariffs.
Weight of Evidence Still Bearish
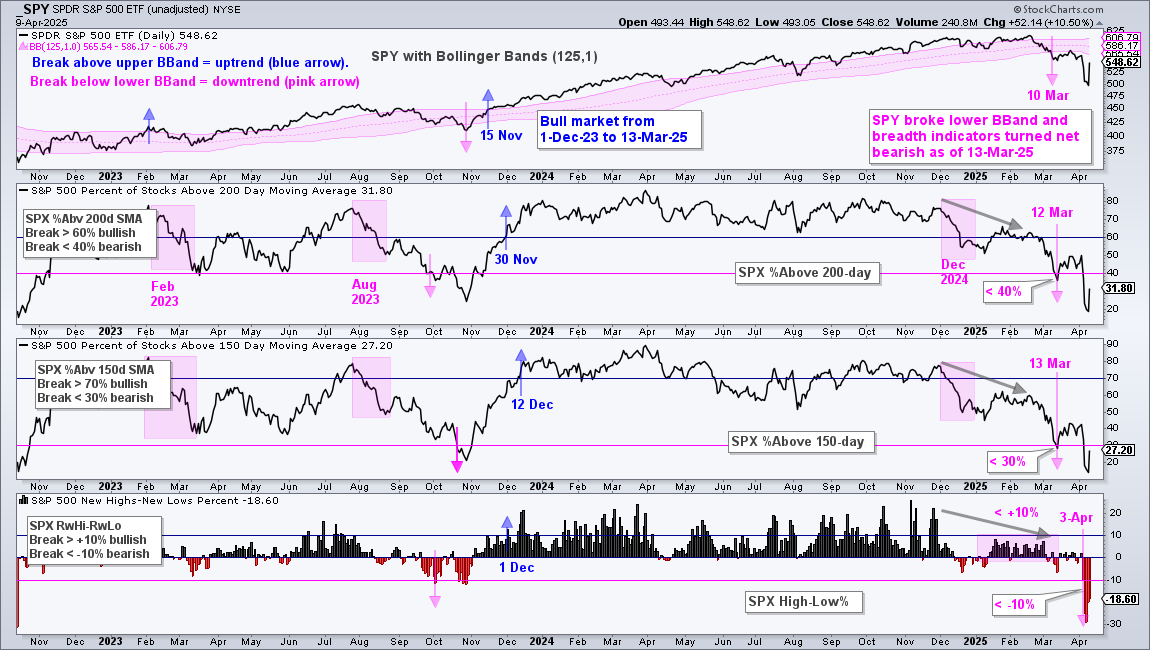
Regardless of the announcements over the last five days, the weight of the evidence turned bearish on March 13th. More importantly, the evidence remains bearish. The major index ETFs are in long-term downtrends, long-term breadth indicators are bearish and yield spreads remain elevated (stress). As an example, 32% of S&P 500 stocks are above their 200-day SMAs (68% below). These are not bull market numbers.
Party like its October 2008
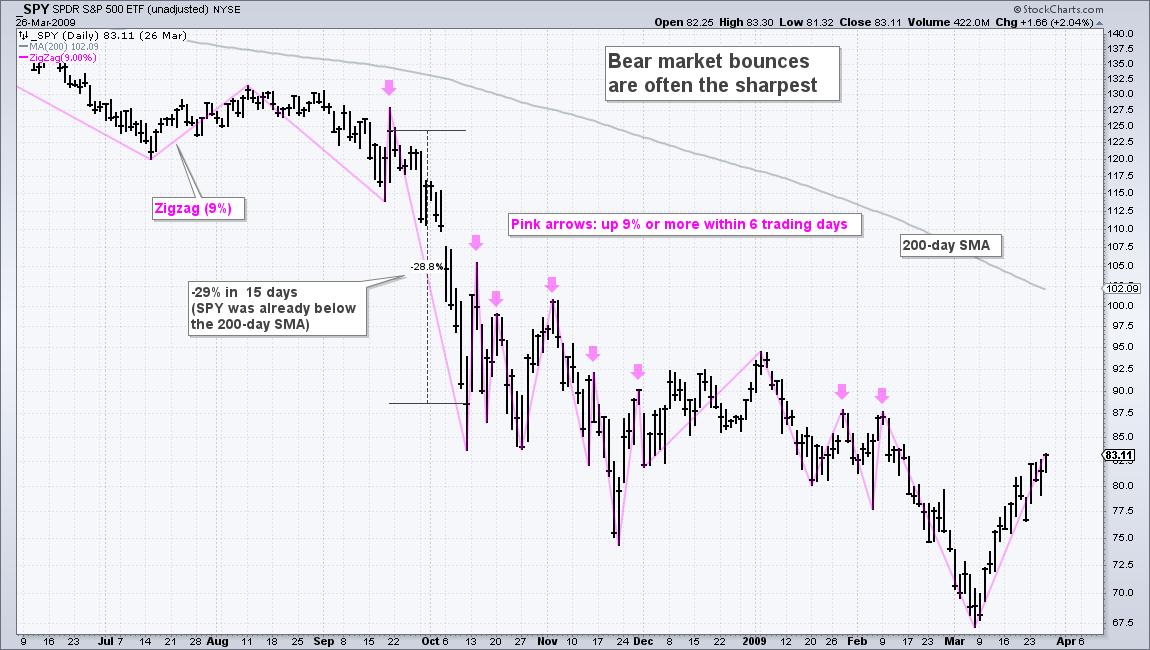
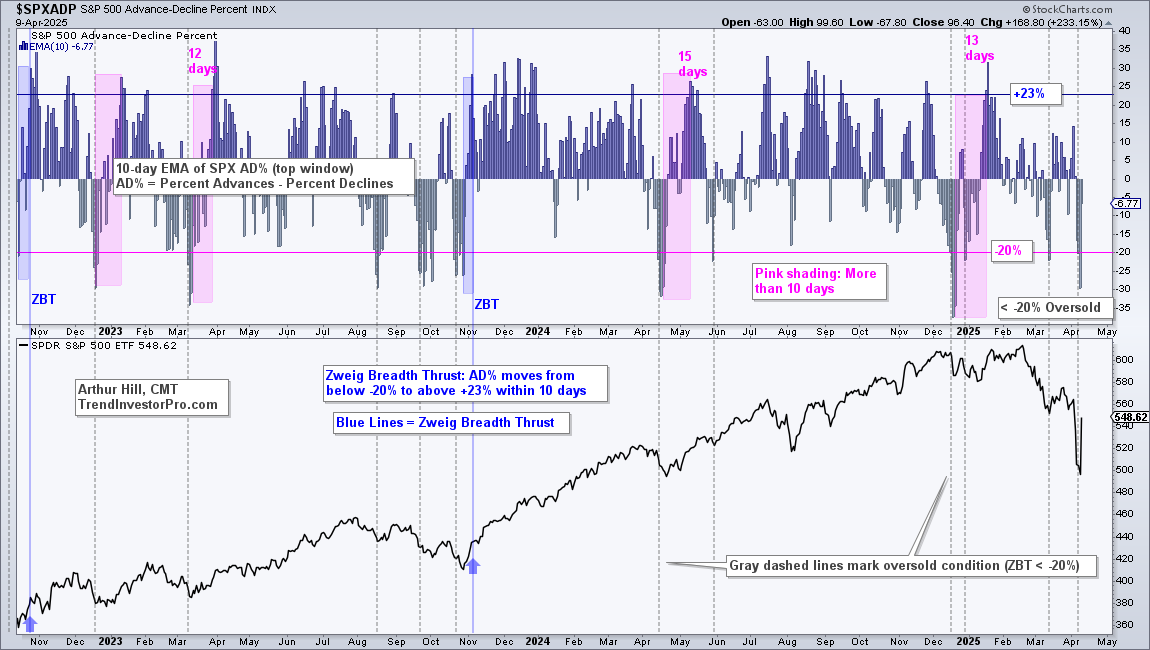
As noted on Monday, price and breadth reached extremes last Friday. SPY was 3 standard deviations below its 200-day SMA, 5-week RSI was at its lowest level since October 2008, breadth indicators were at extremes and the Zweig Breadth Thrust was oversold. Overall, these conditions were similar to those seen on October 10th, 2008. And, like October 2008, SPY surged more than 10% in one day with a 14.5% surge on October 13th.
The chart above shows SPY with Zigzag (9%). This indicator changes direction after moves that are greater than 9%, which means it ignores smaller moves. First, note that SPY is below the 200-day SMA the entire time (bear market). SPY fell 29% in 15 days (19-Sep to 10-Oct) and then surged over 9% three times (13-Oct to 4-Nov). The pink arrows show when SPY surged more than 9 percent in six days. There were eight such occurrences during this bear market. Short sharp bounces are par for the course in bear markets.
Bottom Line: Bear Market
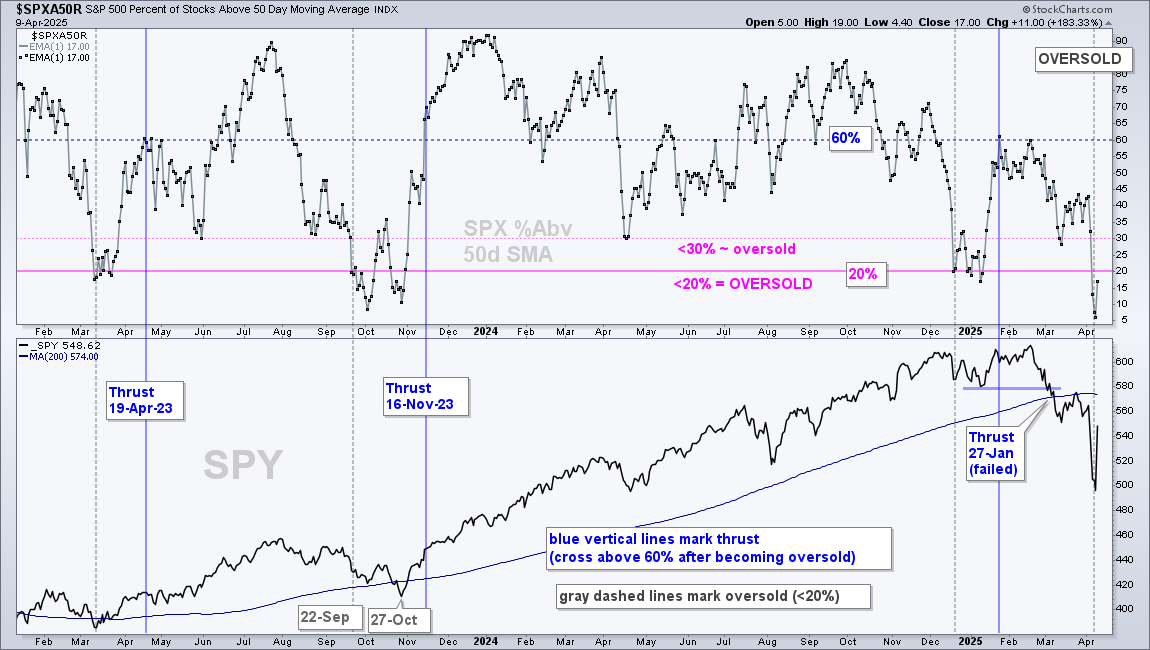
The weight of the evidence remains bearish for stocks. This means the current bounce, while strong, is considered a bear market bounce. Even with a 10% bounce, only 17% of S&P 500 stocks are above their 50-day SMAs. See chart below. The market is not close to a thrust signal, which would require a move above 60%.
Furthermore, one day does not a trend make. Follow through is needed to turn this bounce into something more. This is why Marty Zweig used the 10-day EMA for his thrust indicator. One random day does not move the needle when using a 10-day EMA. Follow through is required with a move above +23% (within 10 days).
SPY Bounces off Support Zone
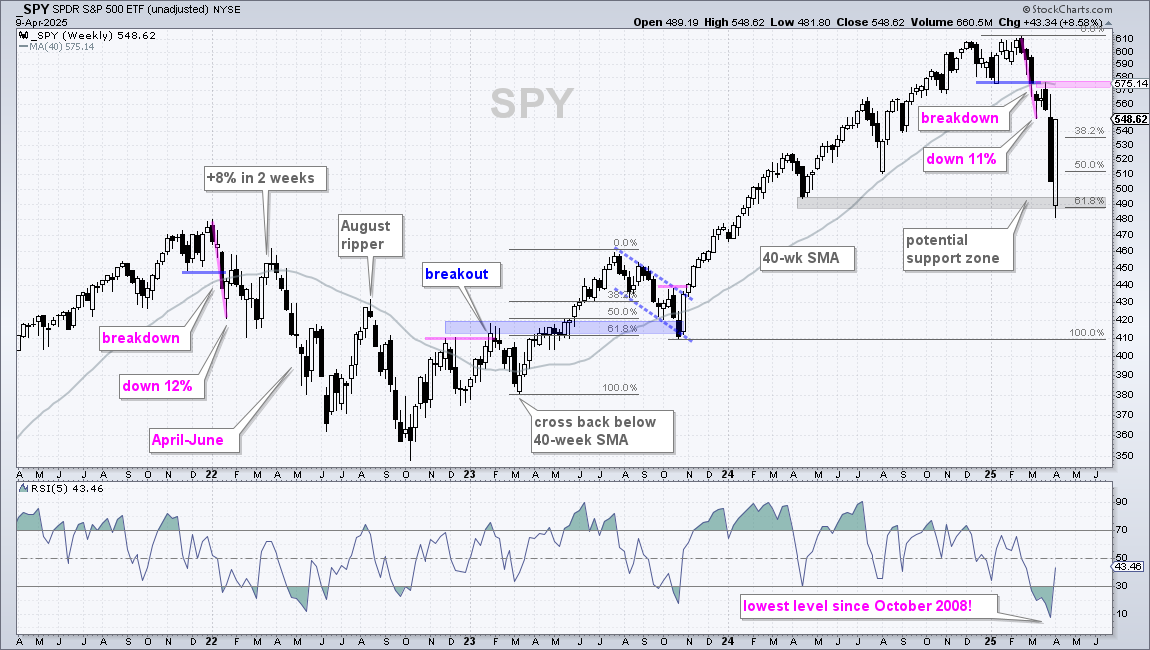
Let’s first look at the weekly candlestick chart. The potential support zone shown on Wednesday morning turned into actual support with a 10.5% surge. Support in the 480-500 area stemmed from the 61.8% retracement and April lows, as well as an extreme oversold condition (gray shading). A big bounce after a big decline is normal. Looking back at 2022, SPY reversed its uptrend with a breakdown and 12% decline. The ETF continued lower into February and then surged 8% the first two weeks of March (2022). SPY recaptured the 40-week SMA, but this proved to be a bear market bounce.
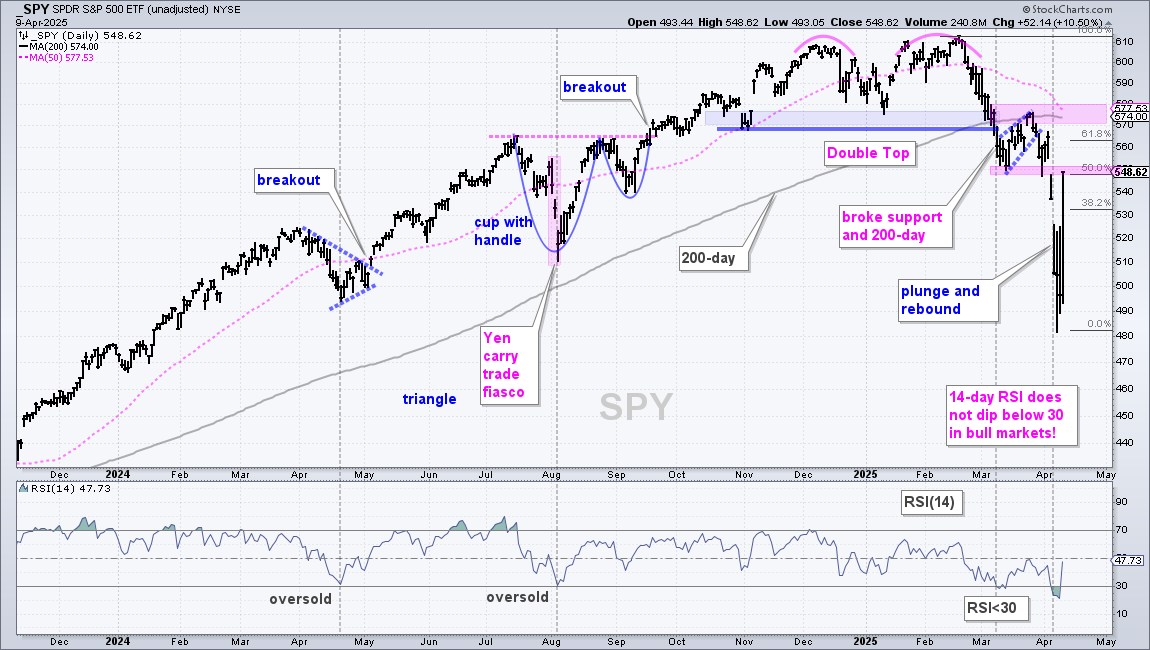
The next chart shows daily bars with the first resistance level coming into play. SPY returned to the March low (support break) and broken support turns into resistance. We also have the 50% retracement line here. Further up, there is resistance from the 61.8% retracement, 200-day SMA, 50-day SMA, late March high and support break. Basically, the 550 to 580 area is one big resistance zone.
The indicator window shows RSI(14) exceeding 30 in early March and early April. RSI moves below 30 reflect oversold conditions that can give way to a bounce. However, note that RSI moves below 30 typically occur in bear markets, not bull markets. RSI(14) did not go below 30 in 2024, which was a bull market. The current moves below 30 show strong downside momentum that is more indicative of a downtrend than an uptrend.
QQQ Bounces from Deep Oversold Condition
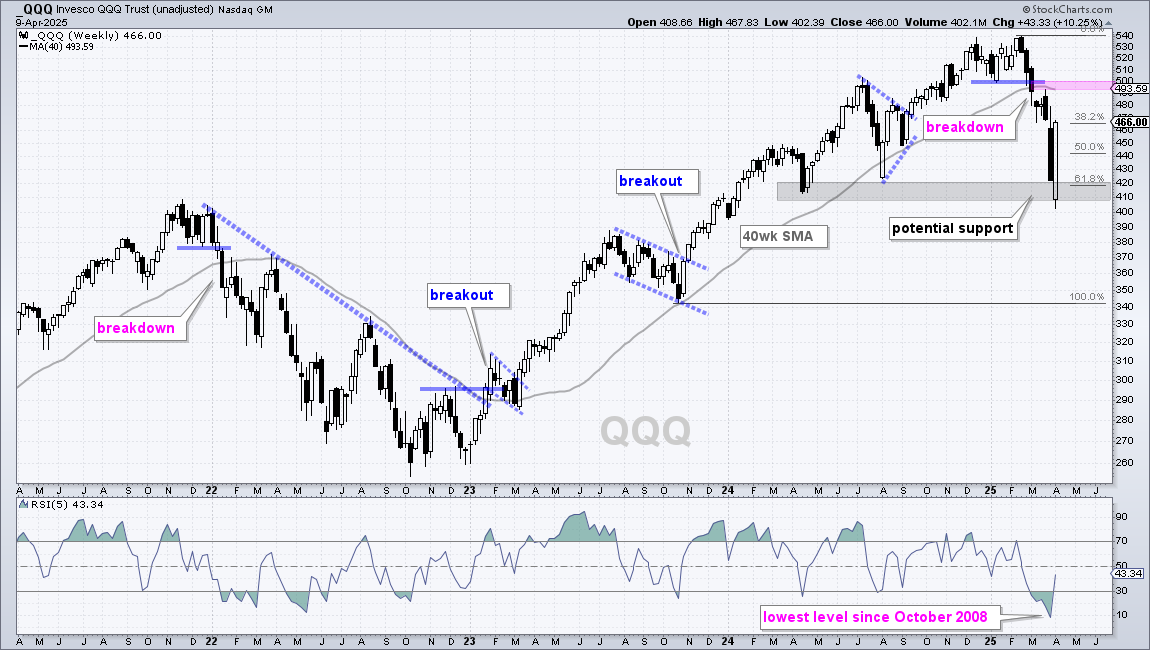
The next chart shows weekly candlesticks for QQQ with RSI(5) hitting its lowest level since October 2008. This deep oversold condition and the potential support zone (gray shading) unleashed a strong counter-trend bounce. The long-term trend turned down with the early March break below support and the 40-week SMA. These breaks have yet to be negated and Nasdaq 100 breadth remains bearish. The break zone and 40-day SMA mark resistance at 500.
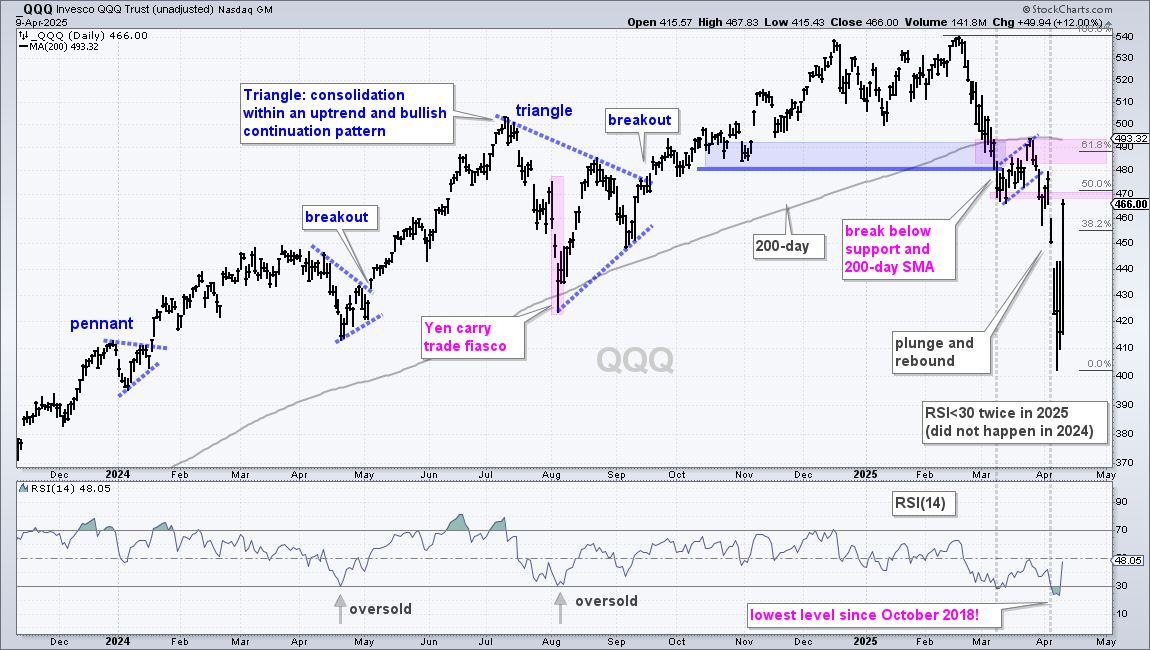
The next chart shows daily bars with QQQ breaking down in early March, plunging to the low 400s and rebounding with a one day move to 466 (+10.25%). This surge is impressive, but still within the confines of a bigger downtrend. QQQ was extremely oversold after a 15% decline in two weeks and RSI(14) fell to its lowest level since October 2018. These conditions gave way to the oversold bounce. As with SPY, resistance is at hand as QQQ nears the 50% retracement and broken support from the early March low (470). Further up, we have resistance in the 490 area. Overall, I see a big resistance zone stretching from 470 to 500.
Send feedback to support(at)trendinvestorpro.com or use the contact form. [2]