Commodity, Bond and BitCoin ETFs – Copper Turns – DBA Holds Up – IEF Goes for Breakout
Posted By
Arthur Hill, CMT
On
In
Archive |
No Comments
The next report will be on Tuesday, April 8th
The markets are rattled. Stocks, commodities, gold and the US Dollar are down in pre-market trading. S&P 500 futures are down around 3%, oil is down around 4%, silver is down over 3%, copper fell 2%, gold edged .50% lower and the Dollar index is down almost 2%. Bond futures are up over 1% as money seeks safe-havens. Bitcoin is also up around .50%, but I am not sure if this is a safe-haven.
The message here: chaos reigns as economically sensitive stocks and industrial commodities lead lower. Bonds are moving higher, which means the 10-yr Treasury Yield is moving lower. Long-term Treasury yields reflect the economic outlook, which means lower yields are pricing in lower growth, if not worse.
Silver and Silvers Miners Fall Short of October Highs
Copper Pulls Back as DBB Hits Moment of truth
Copper Miners ETF Fails to Hold Breakout
DB Agriculture ETF Holds Short-term Breakout
TLT and IEF Go for Breakouts
Bitcoin Remains in Downtrend
Gold and Gold Miners are Getting Extended
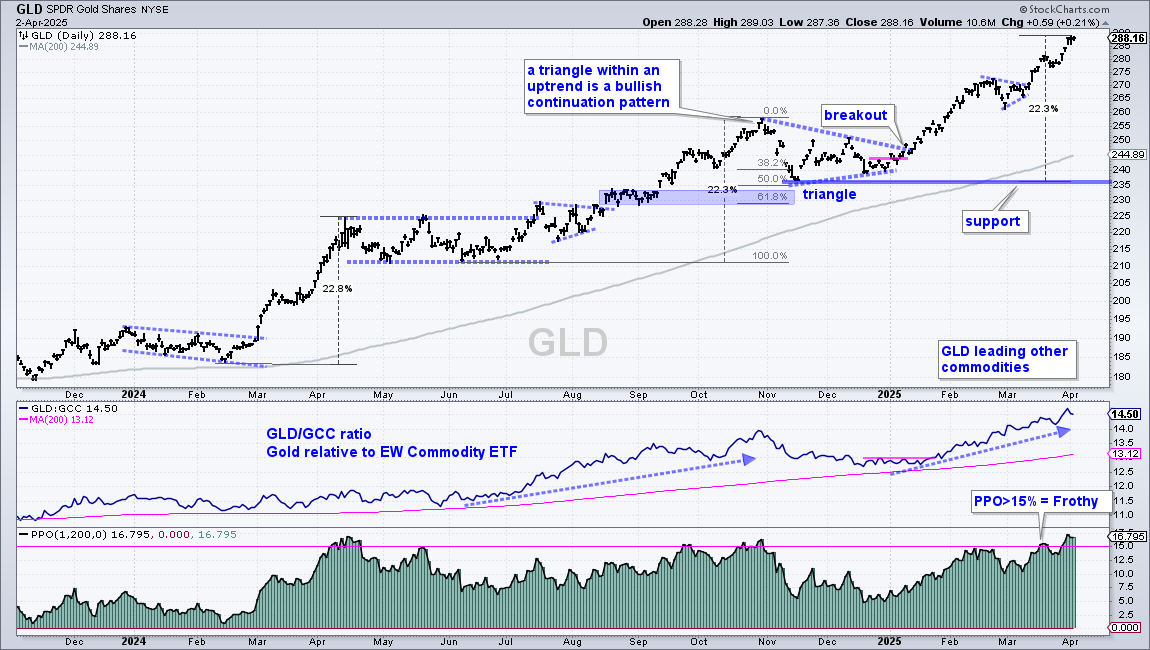
Gold remains one of the strongest assets in the world right now. Stronger than US stocks, US Treasury bonds, crypto, real estate and other commodities. The Gold SPDR (GLD) hit another all-time high this week and remains in uncharted territory, which means there are no resistance levels above. Actually, resistance levels do not matter in uptrends because higher highs and breakouts are expected. Gold, however, is getting frothy with a 22.3% gain since mid November. This is the third 22% advance in the last 15 months. GLD moved into a consolidation period after 22% gains in April 2024 and late October 2024. The indicator window shows the PPO(1,200,0) exceeding 15% in late March and early April. This means price is more than 15% above the 200-day EMA. Thus, GLD is looking extended and ripe for a rest. But that does not mean we will get one. Overbought readings are not bearish, they just mean it is not a good time to initiate new long positions or add to existing long positions. It would be more prudent to wait for a pullback or consolidation.
The bottom window shows the PPO(1,200,0), which is the percentage difference between the close (1-day EMA) and the 200-day EMA. The last parameter (0) is the signal line, which is not needed for this example. I placed a pink line at 15% to mark overbought conditions, which occurred in April, late September, late October and now. While I prefer simple moving averages (SMAs) to exponential moving averages (EMAs), SharpCharts does not have an indicator to express the difference between two SMAs. StockCharts ACP does though. The PPO is based on EMAs. As far as signals and overbought conditions, there is not a huge difference between EMAs and SMAs.
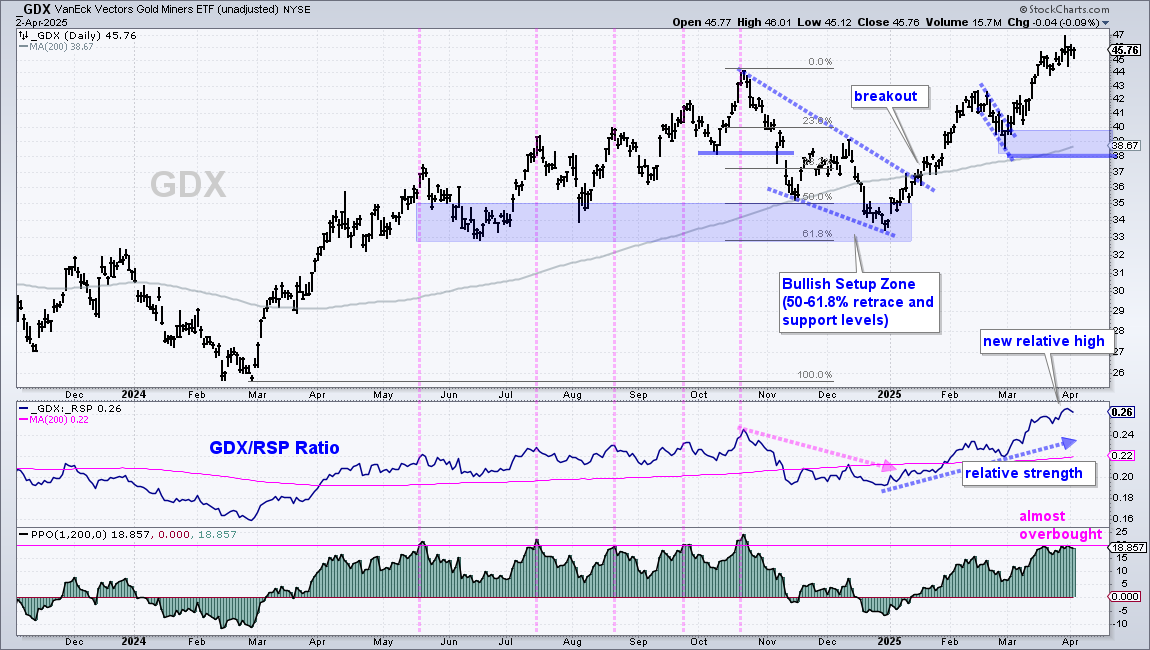
The Gold Miners ETF (GDX) is keeping pace with the Gold SPDR (GLD) as it surged to a new high in late March. GDX is positively correlated to GLD, but more volatile and prone to wilder price swings. On the price chart, GDX broke out of a falling wedge in mid January and extended higher in February-March. I am marking a support zone using the early Mach low and rising 200-day SMA (blue shading in the 38-40 area). The middle window shows the price-relative hitting a new high as GDX outperforms the broader market. The bottom window shows the PPO(1,200,0) nearing overbought territory (20%) in the second half of March. Technically, the PPO did not exceed 20% so GDX has yet to become overbought. As the pink vertical lines show, prior overbought conditions led to pullbacks in May, July, August and September. The October overbought reading foreshadowed a deeper correction into yearend.
Silver and Silvers Miners Fall Short of October Highs
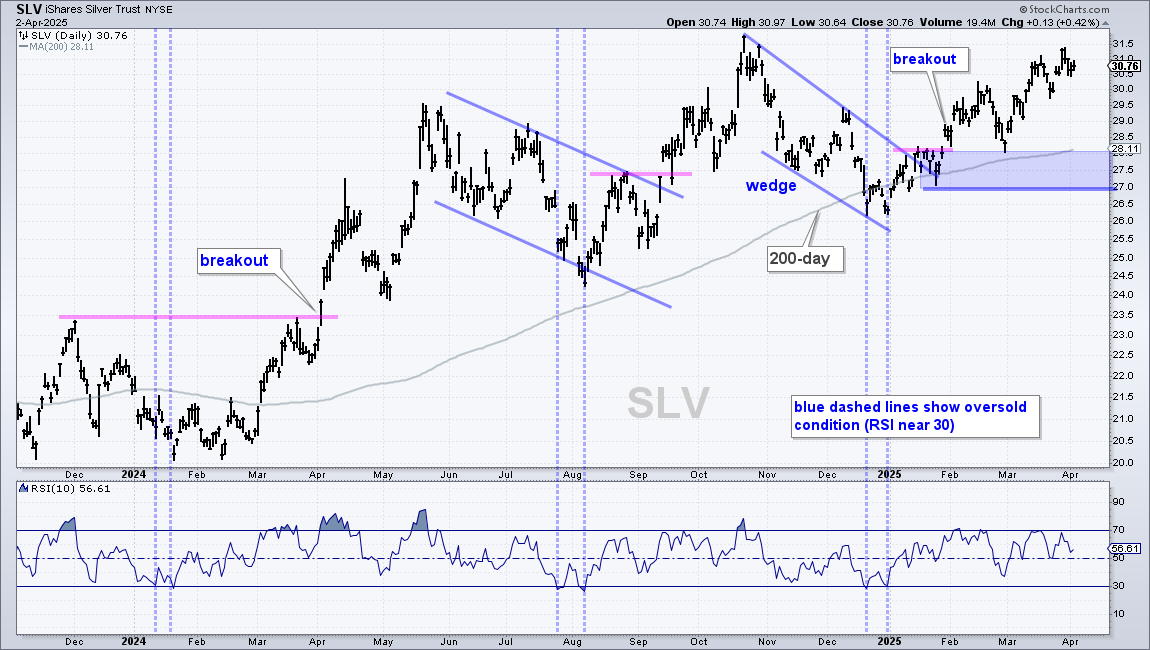
While GLD and GDX surged to new highs, the Silver ETF (SLV) and the Silver Miners ETF (SIL) have yet to exceed their October highs. Both are still in uptrends, but they are not as strong. SLV broke falling wedge resistance in January and extended on this breakout. The late January and late February lows mark a support zone in the 27-28 area (blue shading), a break of which would reverse the long-term uptrend. As long as the long-term trend is up, I would watch RSI(10) for the next setup. Normally, a dip below 30 is needed for oversold, but I would accept a move to the 30 area (<31). The blue dashed lines mark prior oversold conditions. Once oversold, we can then turn to price action to identify a short-term reversal.
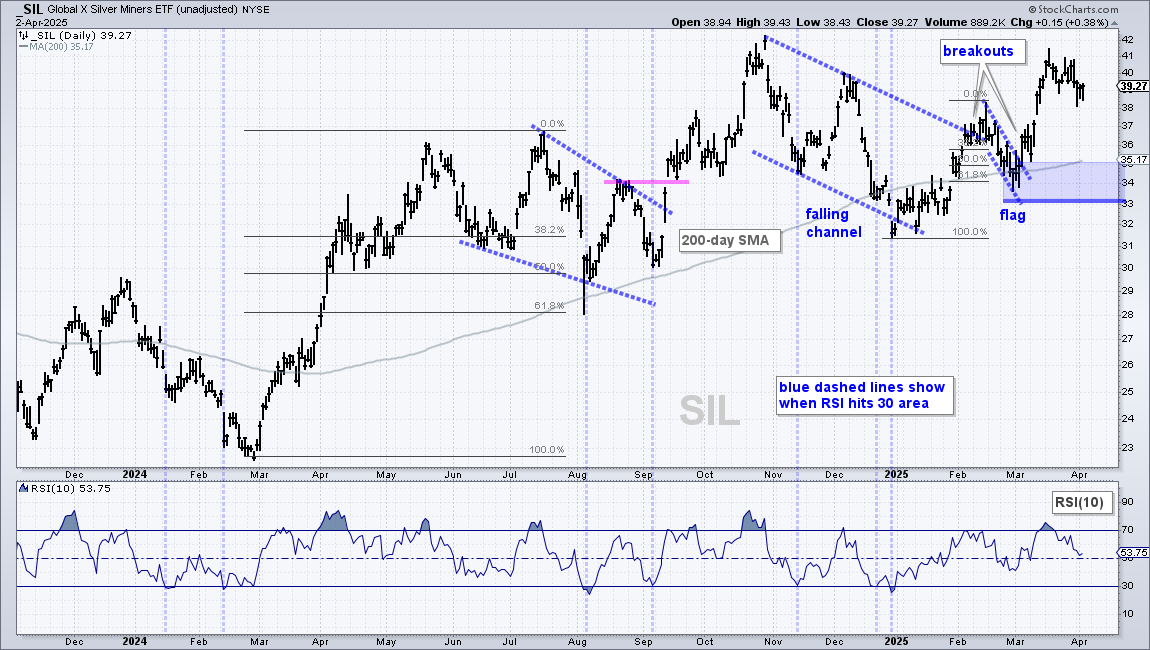
After surging in the first half of March, the Silver Miners ETF (SIL) fell short of its late October high and pulled back the last two weeks. SIL will likely open sharply lower on Thursday so the next setup to watch for is an oversold condition in RSI(10). A move to the 30 area would signal an oversold condition that could lead to a bounce. The blue dashed lines mark prior oversold conditions. For the long-term uptrend, the early March low and 200-day SMA mark a support zone in the 33-35 area (blue shading). A break here would negate the falling channel breakout and reverse the long-term uptrend.
Copper Pulls Back as DBB Hits Moment of truth
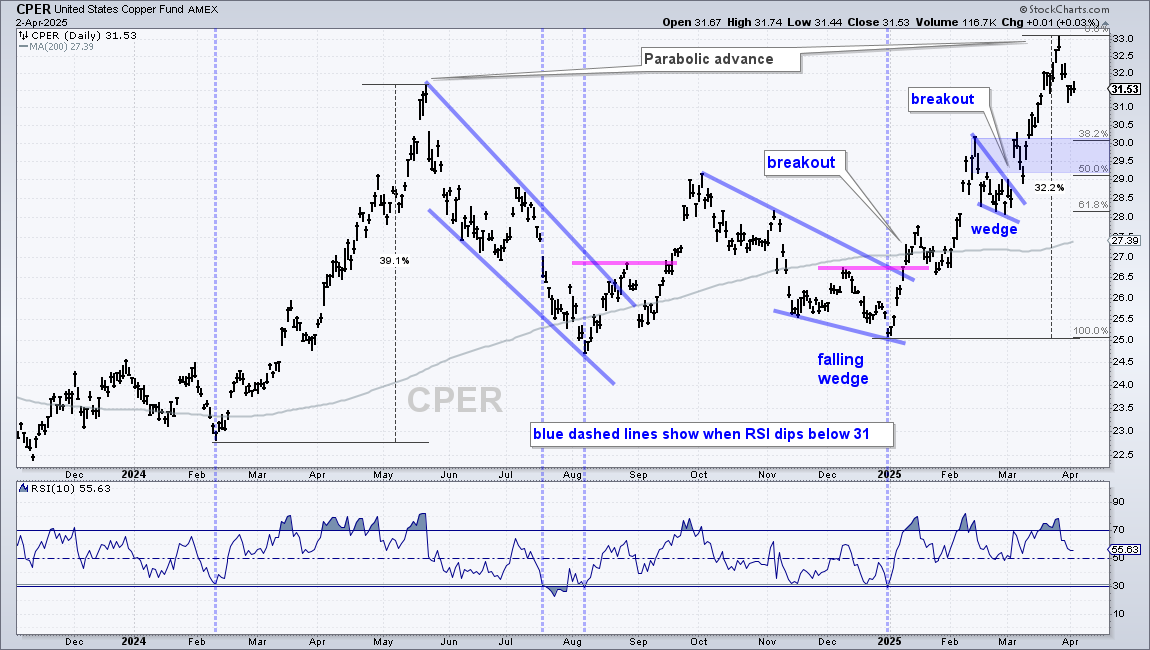
The Copper ETF (CPER) went parabolic with a 32% surge in the first quarter of 2025 and then fell around 4% this past week. Parabolic advances are pretty much straight up, and dangerous. Volatility, which is running high, cuts both ways. CPER also went parabolic in early 2024 with a 39% advance and then fell over 20%. Technical analysis is also a challenge when price moves get extreme. At this stage, it is best to wait for price to become oversold or hit a Bullish Setup Zone, which I am marking in the 29.5-30 area (blue shading). Here we have the 38-50% retracements and broken resistance, which turns next support. For oversold, I would watch for RSI(10) to dip below 31. The blue dashed lines show prior dips below 31.
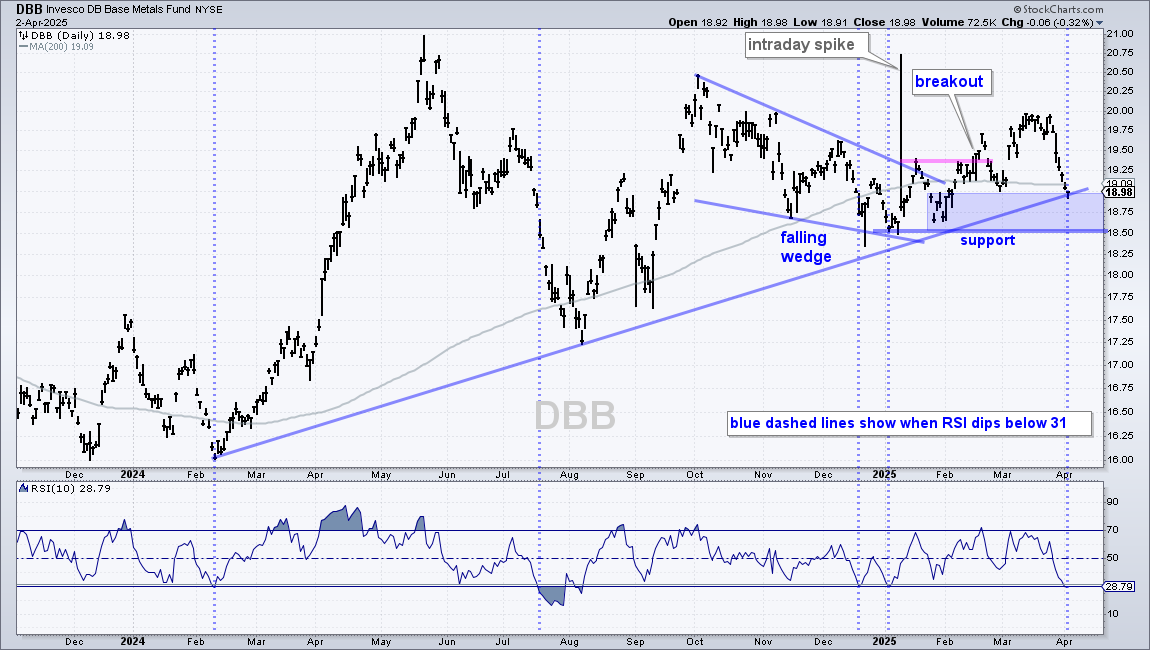
The DB Base Metals ETF (DBB) is equal parts copper, aluminum and zinc, which are all industrial metals. DBB fell to the top of its support zone with a sharp decline the last six days. The ETF will likely hit the lower end of this zone with a weak open today. Support in the 18.50-19 area stems from the January-February lows, the February 2024 trendline, the 200-day SMA and a buffer. This is an area to watch for firming. Also notice that RSI(10) dipped below 30 to become oversold. This is a moment of truth. Firming and a bounce would keep the long-term uptrend alive. A support break would fully negate the falling wedge breakout and reverse the long-term uptrend.
Copper Miners ETF Fails to Hold Breakout
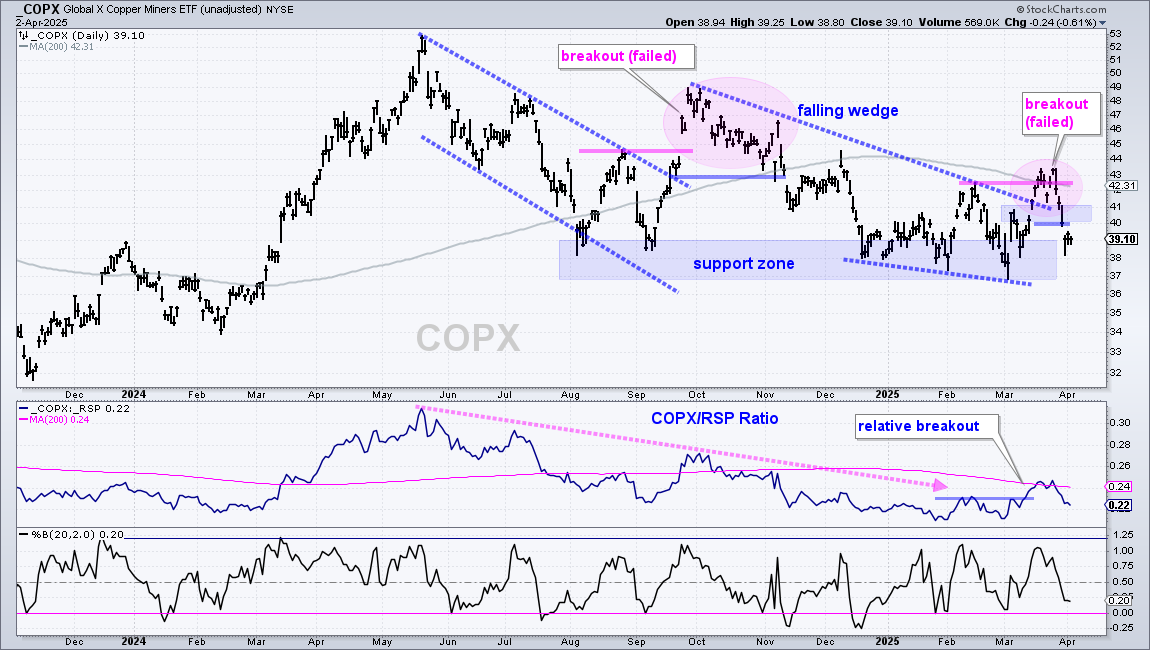
That did not last long. The Copper Miners ETF (COPX) broke out with a surge in mid March, toyed with the breakout zone for a week and then plunged below 40. Even though COPX is volatile and big swings are expected, this breakout did not hold as COPX gave back most of the prior advance. A strong breakout should hold, while a weak breakout will fold. This one folded. As noted last week, US based stocks (SCCO, FCX, MTAL) account for just 10% of the weighting in COPX. 35% are Canadian, 10% Australian and 9% Chinese. In addition, most copper mines are outside of the US.
DB Agriculture ETF Holds Short-term Breakout
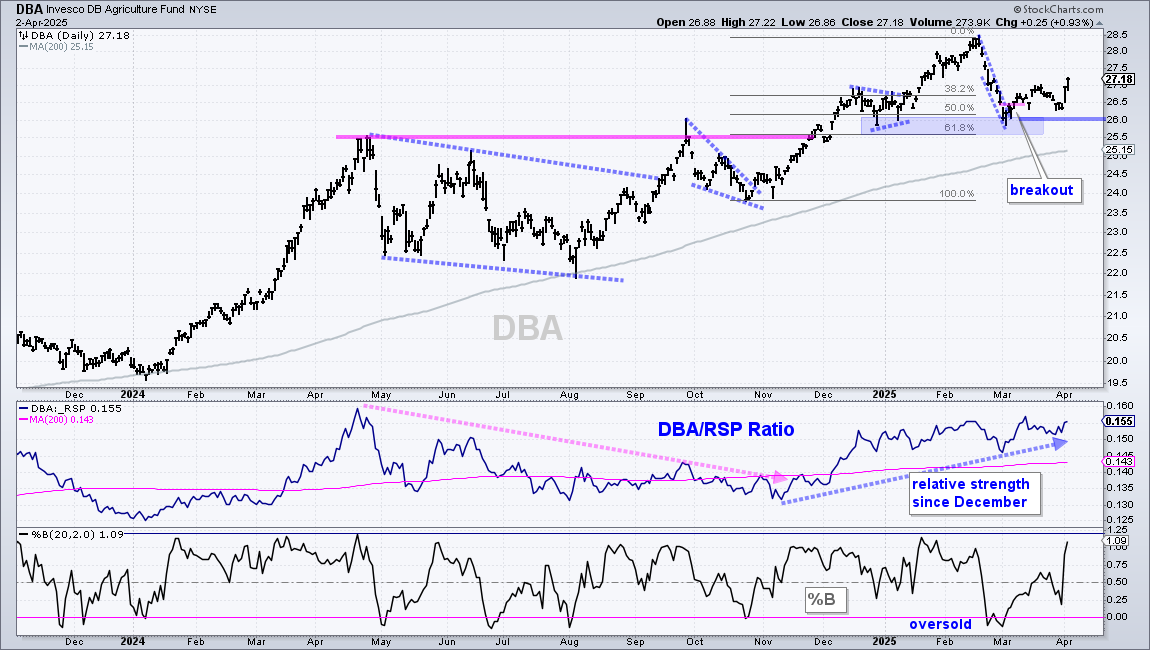
There is no change for the DB Agriculture ETF (DBA). The ETF is in a long-term uptrend and leading the stock market since December. Overall, DBA broke to new highs in November and extended higher into February. The ETF then retraced 50-61.8% of its October-February advance with a decline to the 25.5-26 area (blue shading). This area also marks support from the late December and early January lows. A steep falling flag formed with short-term resistance at 26.50 (pink line). DBA broke out with a pop in early March and this breakout is holding. A strong breakout should hold so I am watching 26 for signs of failure. A close below 26 would negate the short-term breakout.
TLT and IEF Go for Breakouts
The bond market does not know which way to turn. Tariffs are inflationary, which is bearish for bonds (higher rates). On the other hand, tariffs can weigh on economic growth, which is bullish for bonds (lower rates). The Fed may have to choose between fighting inflationary pressures or stimulating the economy. Watch the bond market for clues.
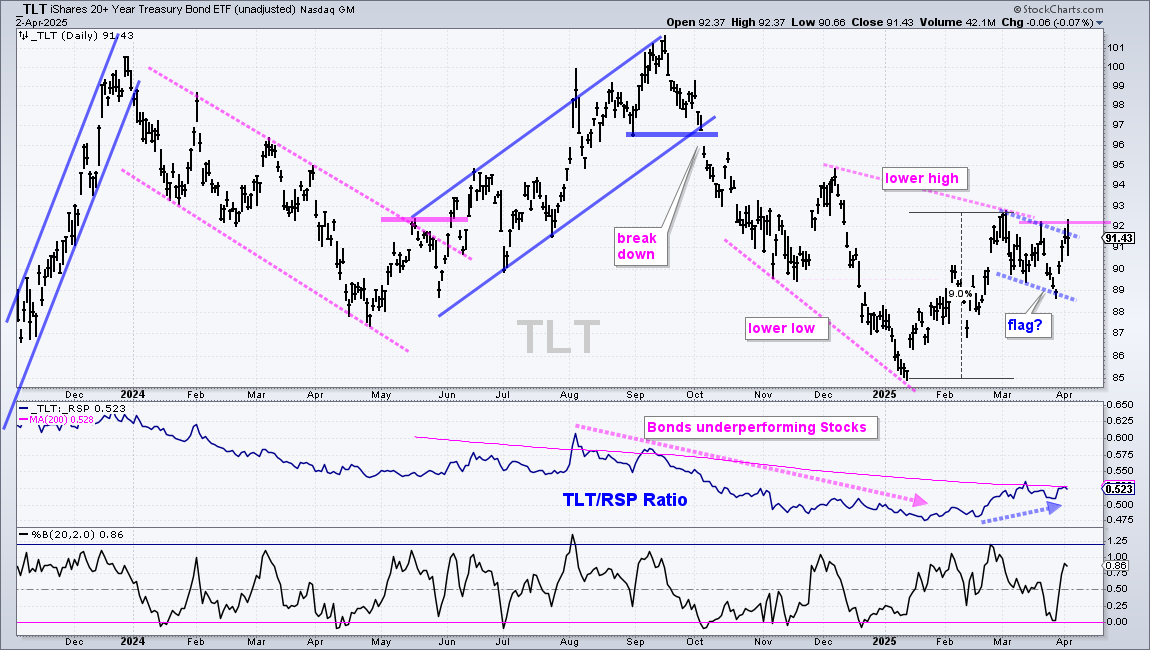
TLT hit a new low in early January and then surged 9% into early March. This move, while strong, did not take out the December high and forge a higher high. Thus, no uptrend yet. However, TLT fell back in March and this decline looks like a bull flag. After becoming overbought with a 9% surge, the bull flag alleviated these overbought conditions with a pullback. Bull flags are also continuation patterns so a breakout at 92 would signal a continuation higher. This would target a move above the December high and a bigger trend change.
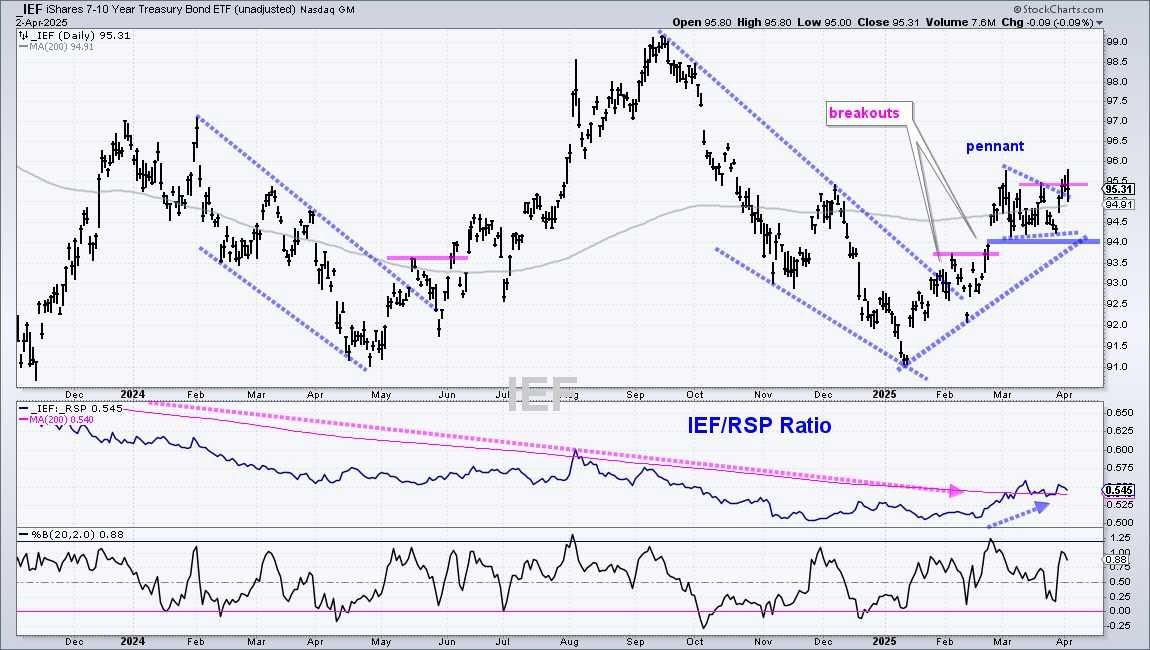
The next chart shows the 7-10 Yr Treasury Bond ETF (IEF) with a breakout in late February and a move above the December high (higher high). IEF became overbought after this surge and then consolidated with a pennant, which is a bullish continuation pattern. A breakout at 95.5 would signal a continuation higher. The pennant lows and January trendline mark key support at 94. A break here would reverse the uptrend.
Bitcoin Remains in Downtrend
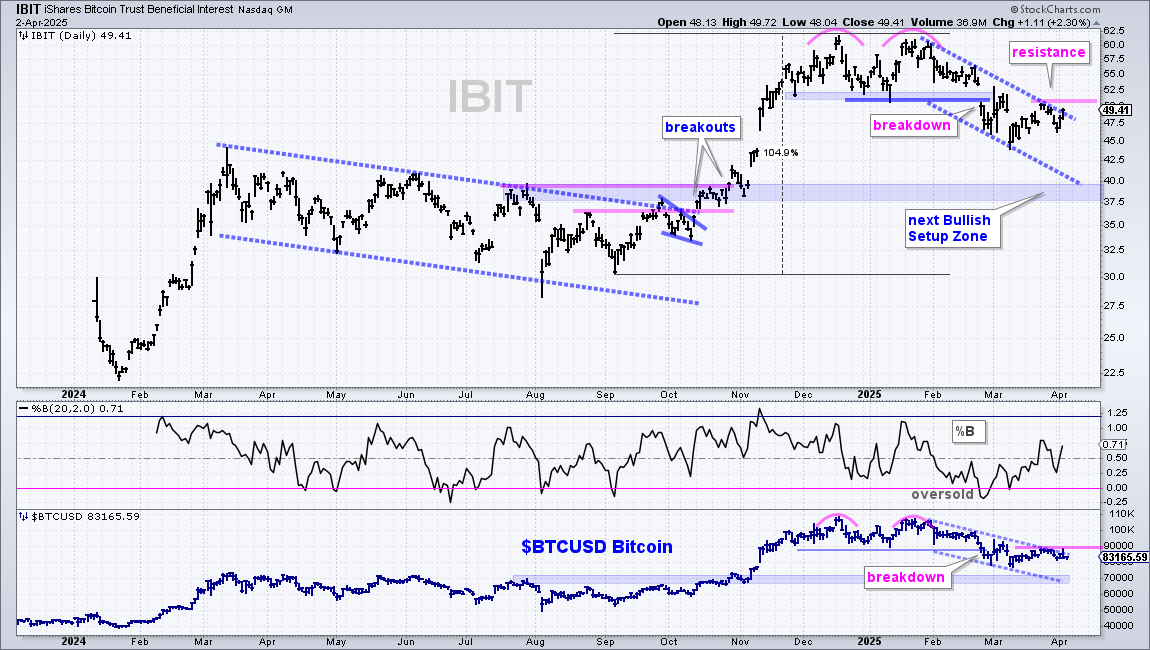
The Bitcoin ETF (IBIT) remains in a downtrend with a confirmed Double Top. IBIT formed two highs in the 62 area (pink arcs) and broke the intermittent low with a sharp decline in late January. This is the active signal. The blue dashed lines define the downtrend since February. IBIT is challenging the upper line and a breakout at 50.50 (pink line) would reverse this downtrend. The bottom window shows $BTCUSD within a downtrend and resistance marked at 90,000, a break of which would be bullish.
Send feedback to support(at)trendinvestorpro.com or use the contact form. [2]