Equity ETF Report – Leader List Shrinks – Dow Theory Movements
Posted By
Arthur Hill, CMT
On
In
Archive |
No Comments
The next report will be on Thursday, April 3rd.
Charles Dow identified three market trends. First, the primary trend is the major trend at work. This is the long-term trend. As noted in the Market Regime report, the weight of the evidence is bearish and this applies to the primary trend. The primary trend cannot be manipulated. Second, secondary trends are counter-trend moves within the primary trends. In a bear market or long-term downtrend, a secondary trend is a counter-trend bounce or advance that can last a few weeks or months. Third, there are short-term price fluctuations. These random price movements are considered noise. In contrast to the primary trends, short-term price fluctuations can be manipulated by news, events, rumors or participants.
Bear markets are more volatile that bull markets. This means we can see more noise via short-term price fluctuations. The key, as always, is to separate the noise from the signal. Therefore, I take a weight of the evidence approach using the Market Regime indicators. These are longer term signals designed to filter the noise and random fluctuations.
Bear markets are best suited for macro analysis with a focus on the big picture (long-term trends, breadth analysis and yield spreads). Equities and equity ETFs are highly correlated, and this correlation is strongest during bear markets. Bear markets cast long shadows that ultimately affect most equities. Trading setups and ideas take a backseat because the chances of success are below average.
Bull markets are different because they signal a risk-on environment and the chances of success are above average. Prices are more likely to reverse near Bullish Setup Zones, follow through is more likely after a breakout and momentum leaders are more likely to keep leading. In bull markets, our analysis efforts turn to individual stocks and equity ETFs because this is the ideal time to look for trading setups and momentum leaders.
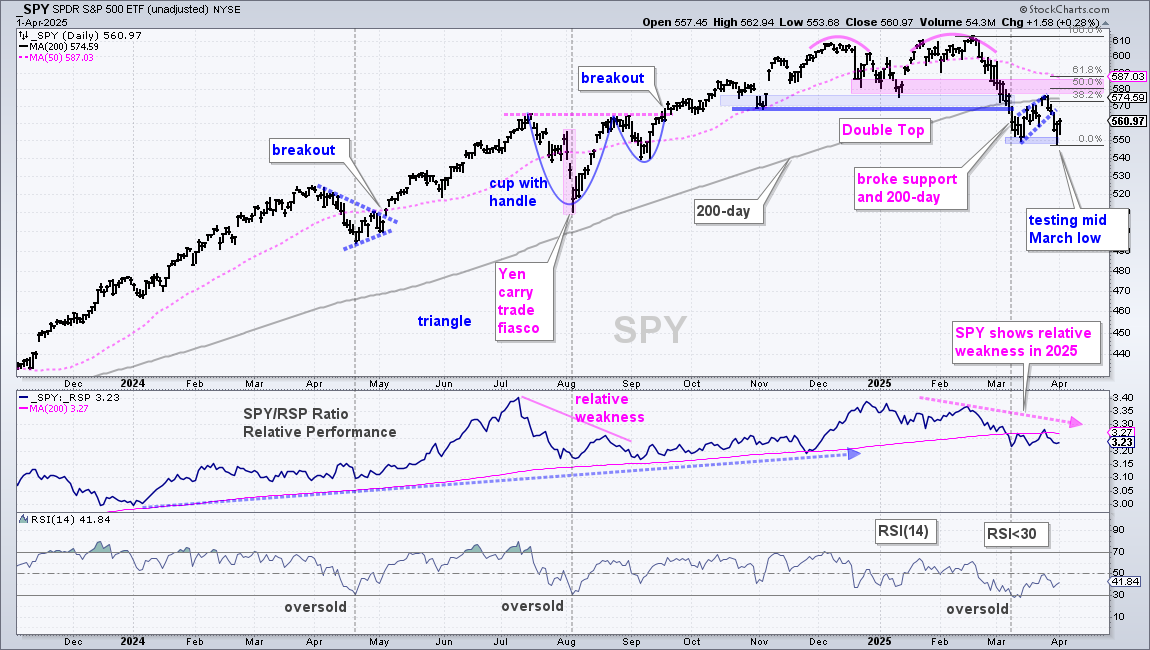
SPY broke Double Top support and the rising 200-day SMA with a sharp decline into early March. These are the breaks that broke the bull’s back. Short-term, RSI dipped below 30 and the S&P 500 Zweig Breadth Thrust became oversold in mid March (gray dashed line). SPY bounced back to its 200-day SMA with a rising flag and turned down last week. This little flag break is the active short-term signal, but we have a bull market in noise so random fluctuations would not surprise me. A sell the rumor (tariff threats) and buy the news (Liberation day announcement) event could spark a counter-trend bounce to the 580 area (pink shading). Here we have the 50% retracement, broken support-turned-resistance and the falling 50-day SMA.
The 200-day SMA is often a battle zone with multiple crosses after the first downside break. A cross back above the 200-day SMA would be normal during a bear market bounce. I covered this in Tuesday’s report and video[2].
QQQ Fails at 200-day SMA
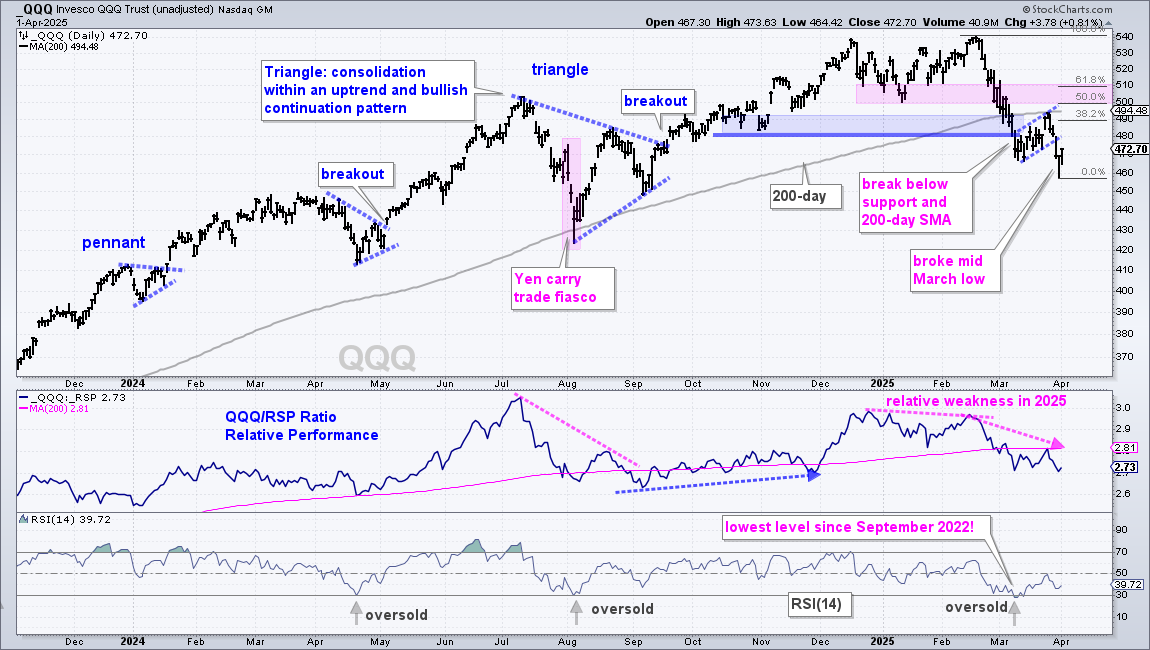
The primary trend is down for QQQ as the ETF broke the January low and 200-day SMA with a sharp decline into mid March. RSI then became oversold and QQQ bounced back to the underside of the 200-day SMA (gray line). A small rising flag formed and QQQ broke the flag line with another move lower last week. This flag break is the active short-term signal. Note that QQQ exceeded its mid March low, whereas SPY held this low. QQQ again shows relative weakness. The next short-term fluctuation is anyone’s guess. Should QQQ bounce, I am marking resistance in the 500-510 area (pink shading). Here we have the 50-61.8% retracements and broken support.
RSP Tests Bullish Setup Zone
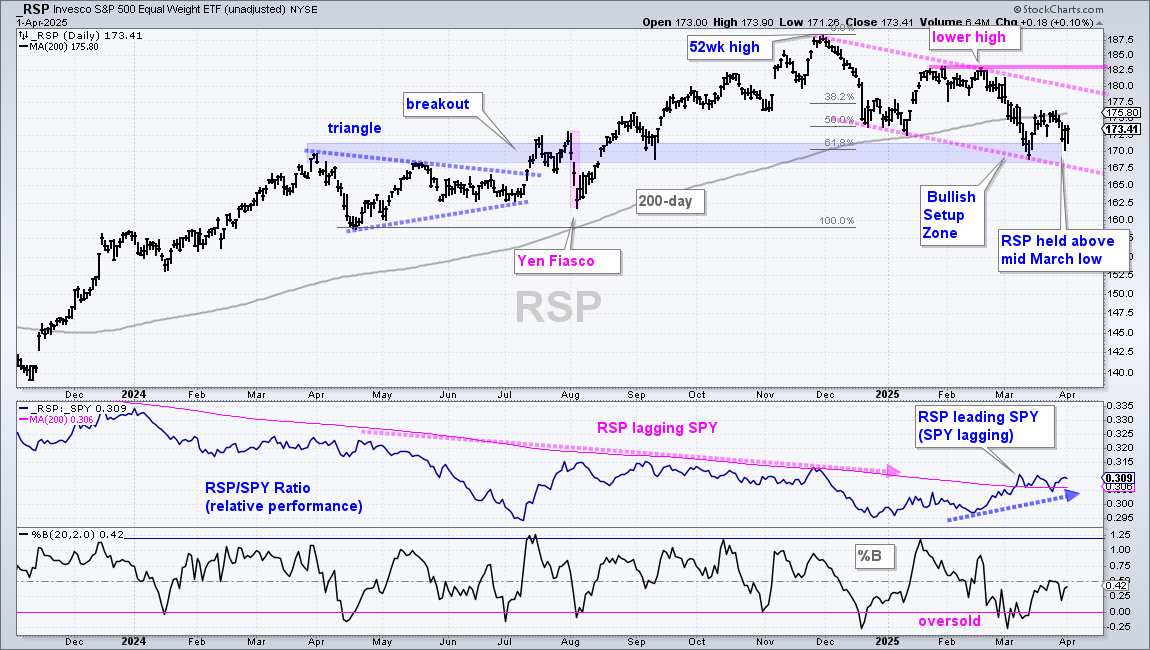
The weight of the evidence is bearish and the primary trend is down for the S&P 500 EW ETF (RSP). RSP has a lower low from January to March and a lower high from December to February (pink dashed lines). The ETF is also below the 200-day SMA. Despite this downtrend, RSP is trading in a Bullish Setup Zone (blue shading). Here we have the 61.8% retracement and broken resistance turned support. RSP also shows short-term relative strength because it held above the mid March low the last three days. SPY tested its mid March low and QQQ broke it. Thus, we have a setup for a bounce that could extend to the 177.5-180 area.
ETFs in Uptrends and Showing Relative Strength
This next section features nine ETFs that are still in uptrends and still showing relative strength. These are the leaders among the equity ETFs.
XLC Tests Bullish Setup Zone
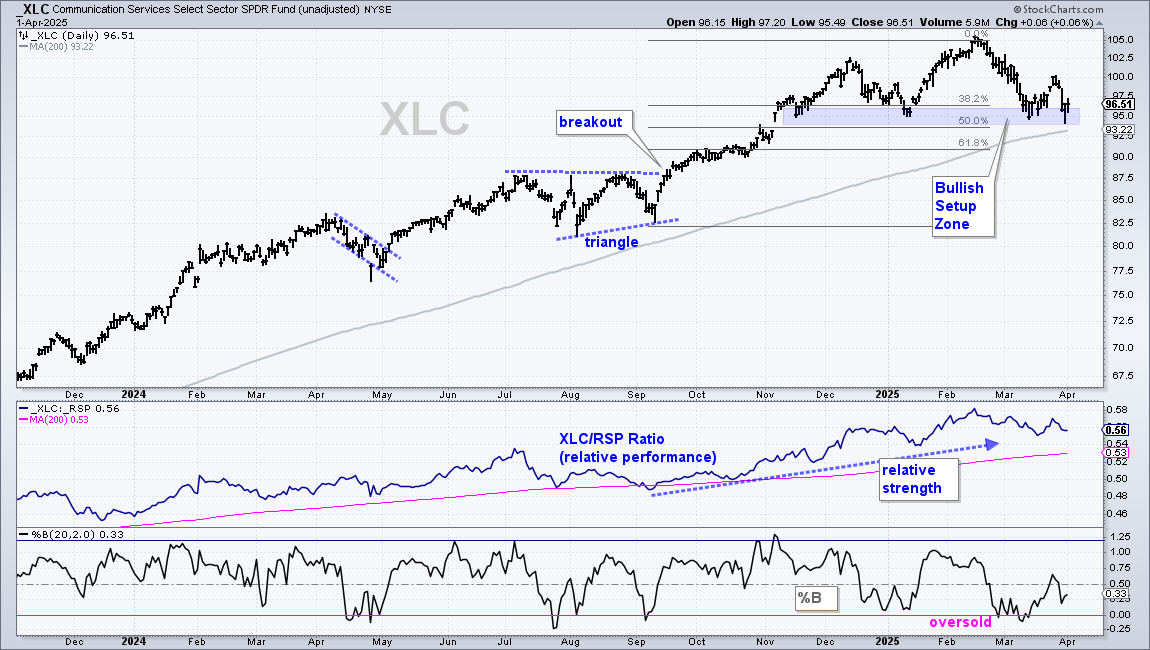
The Communication Services SPDR (XLC) remains in a long-term uptrend as it firms in a Bullish Setup Zone (blue shading). Here we have the 50% retracement and support from the lows extending back to mid November. The rising 200-day is just below this zone. XLC also shows some short-term relative strength as it held the mid March low over the last three days. Overall, I view this zone as a make or break area. A bounce here keeps the long-term uptrend alive, while break below the 200-day would be long-term bearish.
XLF Consolidates within Leading Uptrend
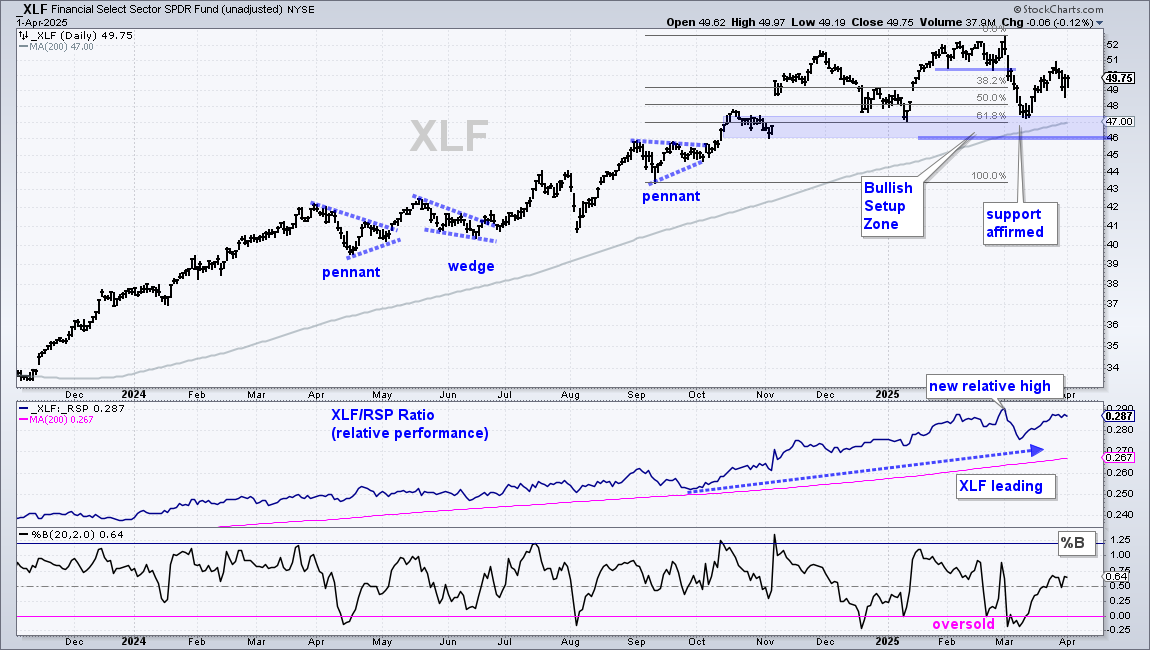
The long-term uptrend and relative strength in the Finance SPDR (XLF) are positives for the broader market, which has more negatives right now. Finance is the second largest sector (14.9%) in the S&P 500, but still half the size of the largest sector (Technology 29.8%). Strength in finance tells us that broad market weakness stems from economic issues, not problems with the financial system.
The chart below shows XLF tagging a new high in early March and then falling to a Bullish Setup Zone (blue shading). Here we have support from the November-January lows, the rising 200-day SMA and the 61.8% retracement. XLF was also oversold as %B dipped below zero. XLF got a strong bounce off this Bullish Setup Zone and remains well above its mid March low (short-term relative strength). The ETF is performing well on the price chart and showing relative strength as the price-relative trades near a new high. Key support is set at 46.
XLU Holds Breakout and Shows Relative Strength
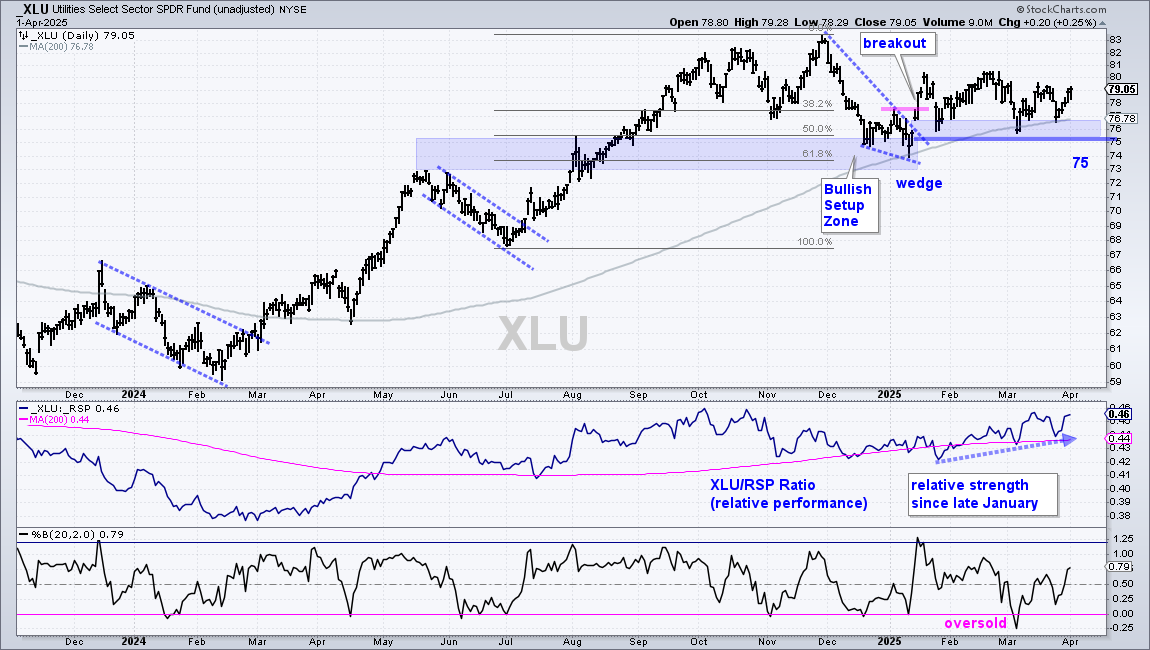
The Utilities SPDR (XLU) is not the most exciting ETF, but sometimes a little less excitement is welcome. XLU is in a long-term uptrend and showing relative strength. The ETF broke wedge resistance with a surge in mid January and this breakout is holding as XLU successfully testing the breakout zone (blue shading). The ETF has gone nowhere since the breakout, but shows relative strength because it held up when the broader market did not. Note that uptrend in the price-relative (XLU/RSP ratio). Overall, I remain bullish on XLU with key support set at 75.
CIBR Tests Mid March Low and 200-day SMA
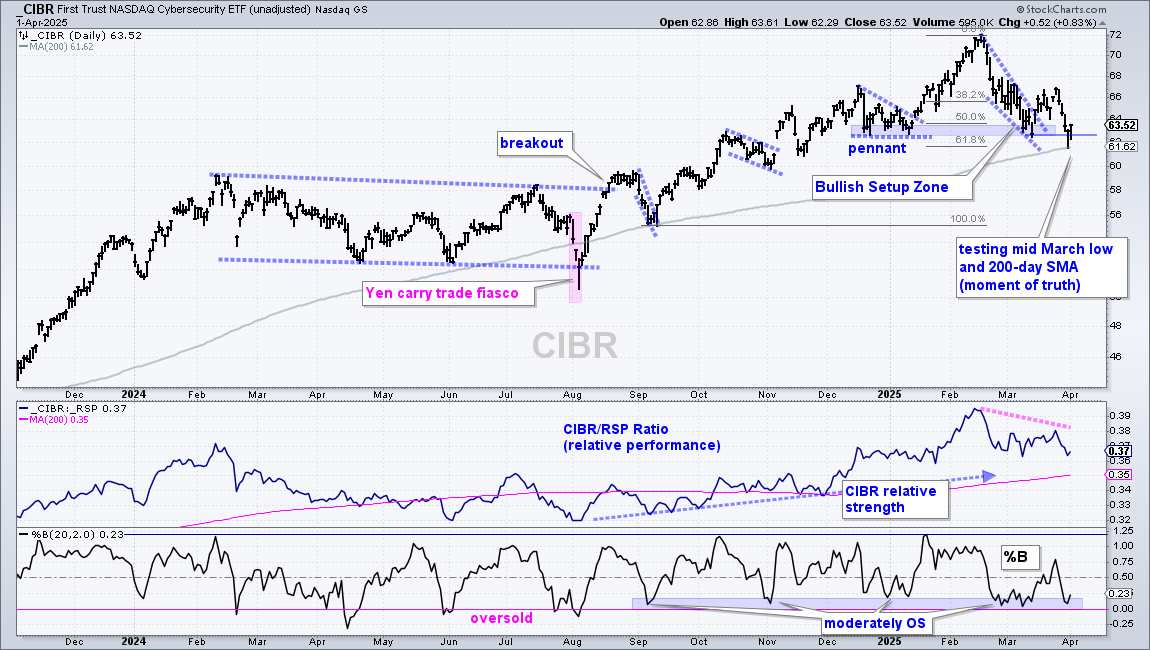
The Cybersecurity ETF (CIBR) is the strongest of the tech-related ETFs in my universe because it is the only that did not break its 200-day SMA and is still positive year-to-date (+.11%). Even so, CIBR is not immune to swings within the broader market and tech sector. The ETF broke out of a falling wedge with a surge in mid March, but gave it all back with a sharp decline last week. CIBR is now testing the mid March low and 200-day SMA. This is a moment of truth. Either the ETF firms and bounces or it fails and breaks down.
KIE Works its Way Higher After Breakout
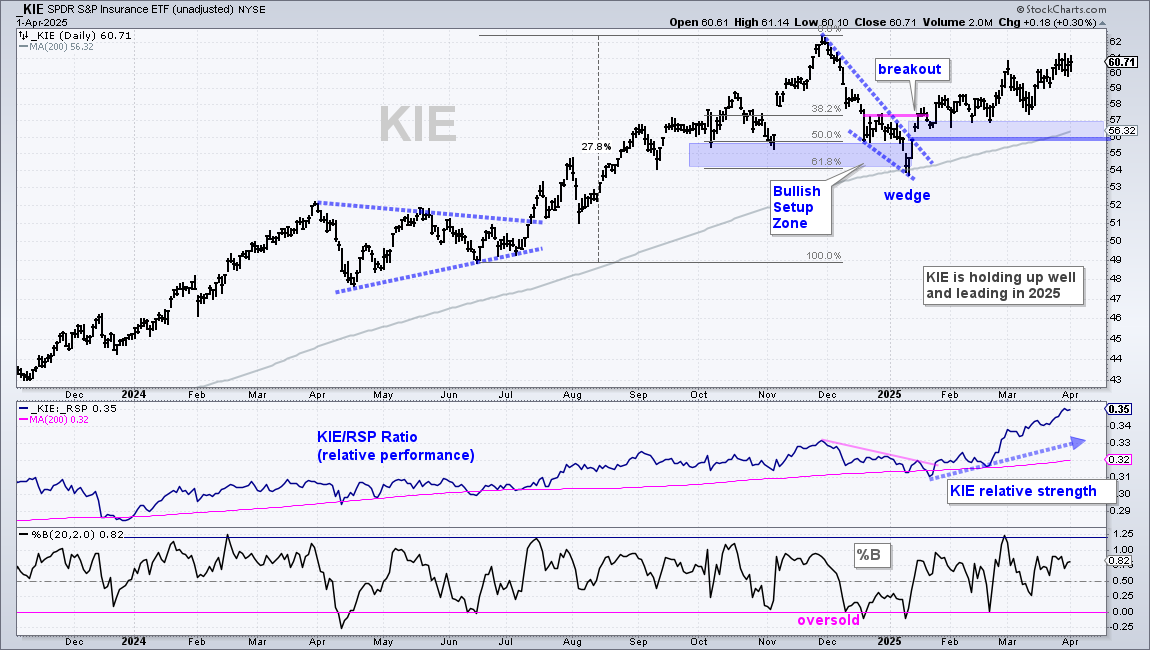
The Insurance ETF (KIE) is not the most exciting, but the ETF is in a leading uptrend as it continues to work its way higher since the mid January breakout. Keep in mind that many ETFs failed to hold their mid January breakouts. KIE held its breakout in February and showed relative strength when the broader market fell. Since this breakout, the ETF worked its way higher into March and the price-relative (KIE/RSP ratio) hit a new high. The February lows and rising 200-day SMA mark a support zone in the 56-57 area.
ITA Falls Back to Breakout Zone
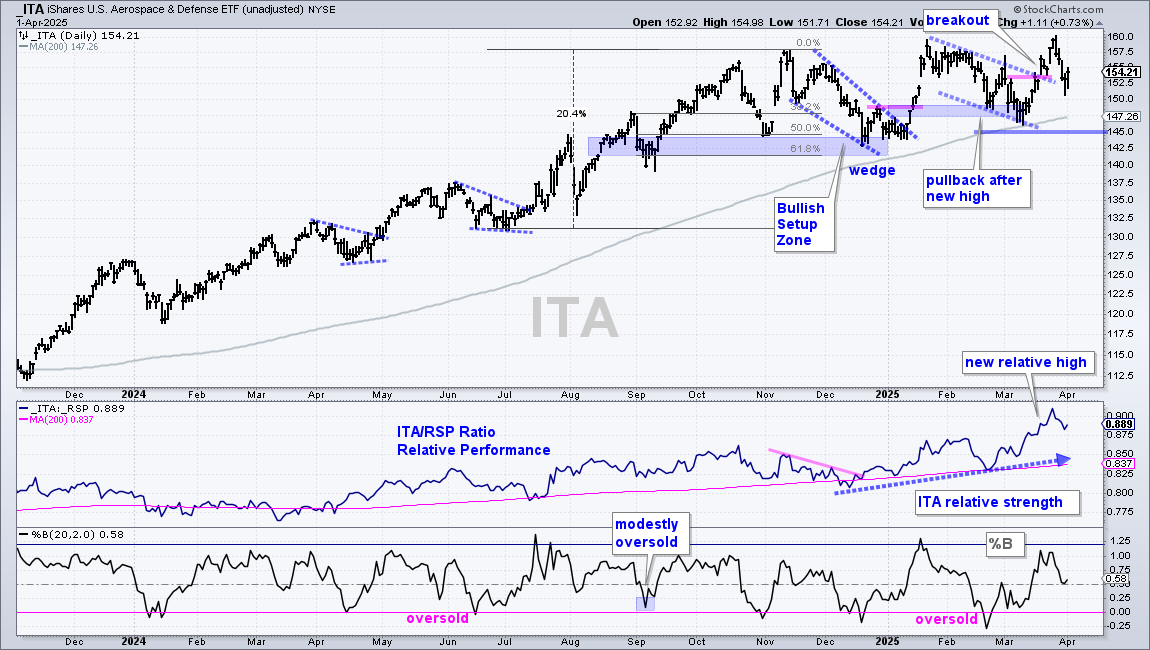
The Aerospace & Defense ETF (ITA) remains in a clear uptrend and shows relative strength. Short-term, ITA corrected with a falling channel into March. The ETF broke out with a surge into late March and tagged a 52-week high. Not many equity ETFs hit new highs in March. The new higher affirms the leading uptrend in ITA. Short-term, the ETF fell back with a sharp decline last week, but I view this as a random fluctuation or throwback to the breakout zone, which turns first support (152.5 area). Overall, I will remain bullish on ITA as long as support at 145 holds.
IHI Tests Rising 200-day SMA
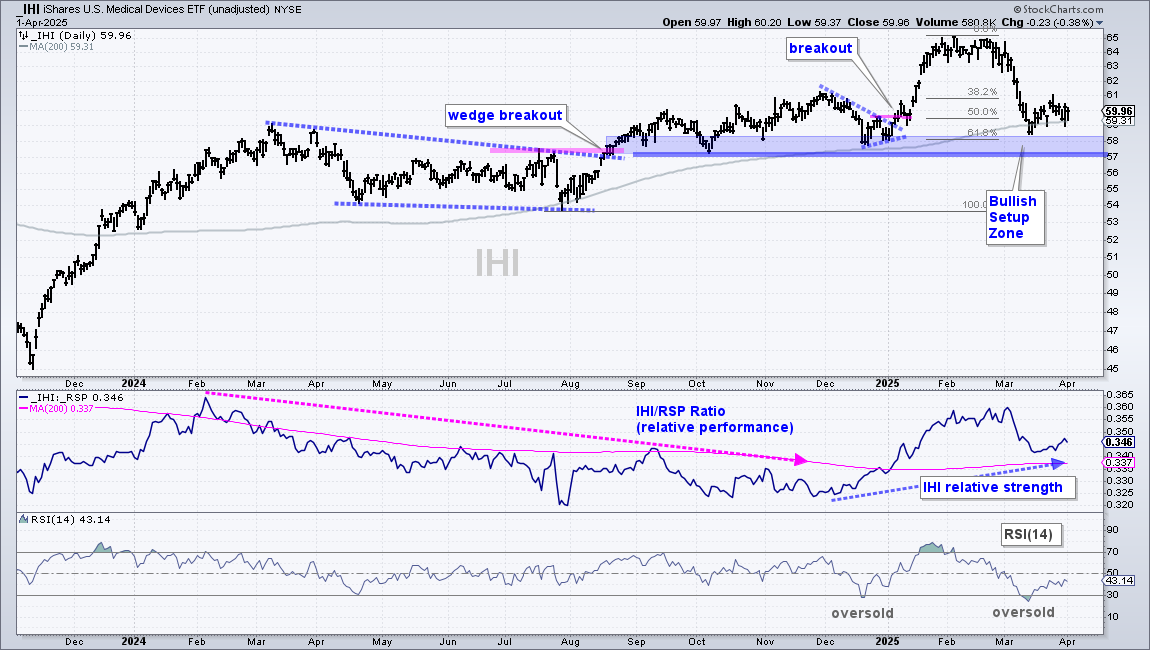
The Medical Devices ETF (IHI) remains in a long-term uptrend as IHI tagged a new high in February and remains above the late December low. IHI fell to the rising 200-day SMA in mid March and firmed just above the Bullish Setup Zone in the 57-58 area (blue shading). Here we have the 61.8% retracement, broken resistance and supports from the September-December lows. RSI became oversold with a dip below 30 in mid March. With the combination of oversold conditions and the Bullish Setup Zone, IHI is ripe for a bounce as it firms around the rising 200-day SMA. Key support is set at 57, a break of which would reverse the long-term uptrend.
AMLP Breaks Out of Small Corrective Pattern
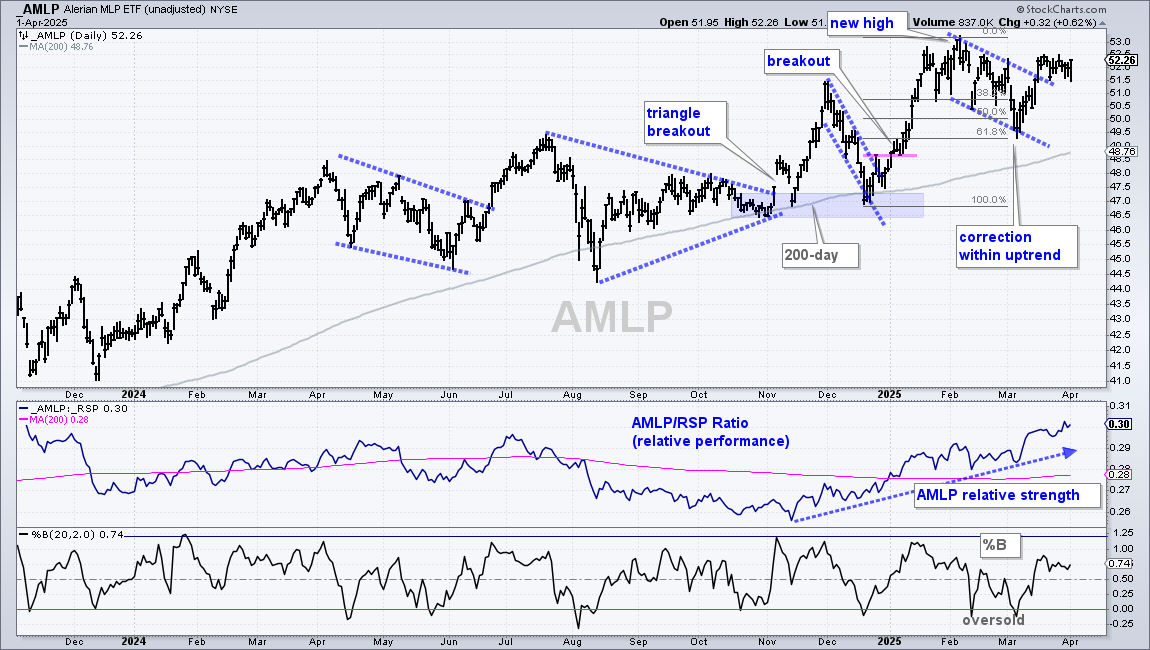
The MLP ETF (AMLP) remains in a leading uptrend with a channel breakout signaling an end to the short pullback. AMLP hit a new high in February, corrected into early March and broke out last week. Notice that this short correction reversed near the 61.8% retracement and when %B dipped below zero (oversold). Overall, this channel is deemed a correction withing a bigger uptrend and the breakout signals a continuation of this uptrend.
IYZ Consolidates within Leading Uptrend
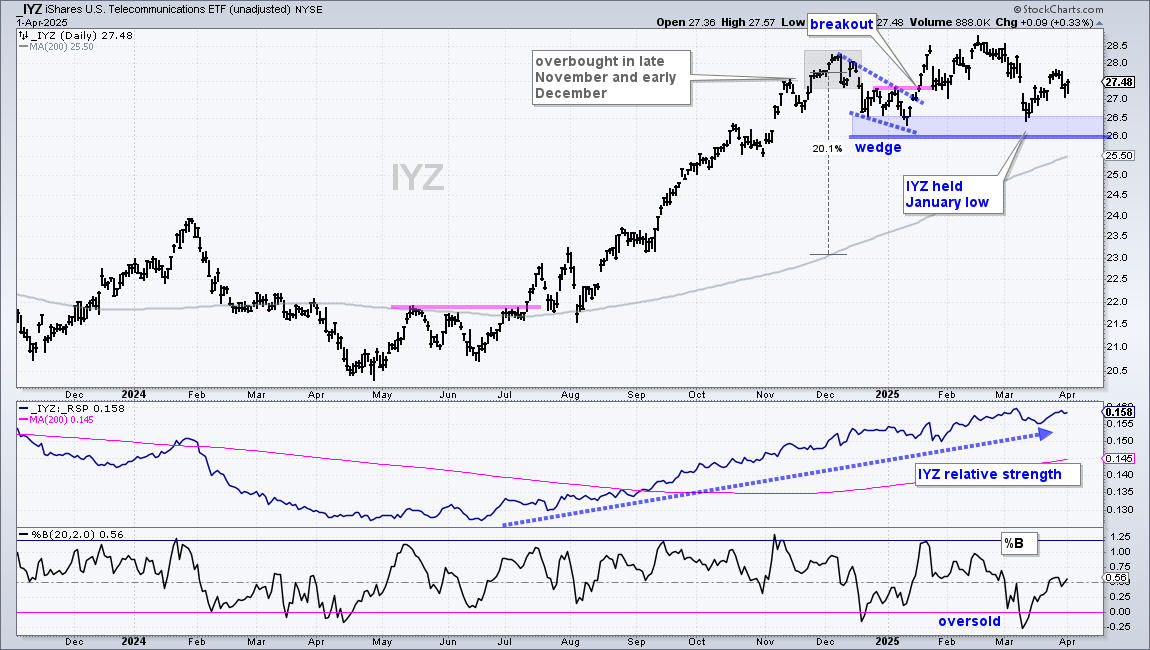
The Telecom ETF (IYZ) remains in a leading uptrend with a new high in February and a rising price-relative (IYZ/RSP ratio). IYZ was not immune to broad market weakness in March as it fell sharply and tested the January low. The ETF did not break this low and got a fairly strong bounce in the second half of March. While SPY tested its mid March low with a sharp pullback, IYZ held well above this low and shows relative strength. The ETF remains a leader with key support set at 26.
Vulnerable or Breaking Down
This next section features a vulnerable ETF (XLV) and two breakdowns (IBB, AIQ).
XLV Tests Rising Wedge Support Zone
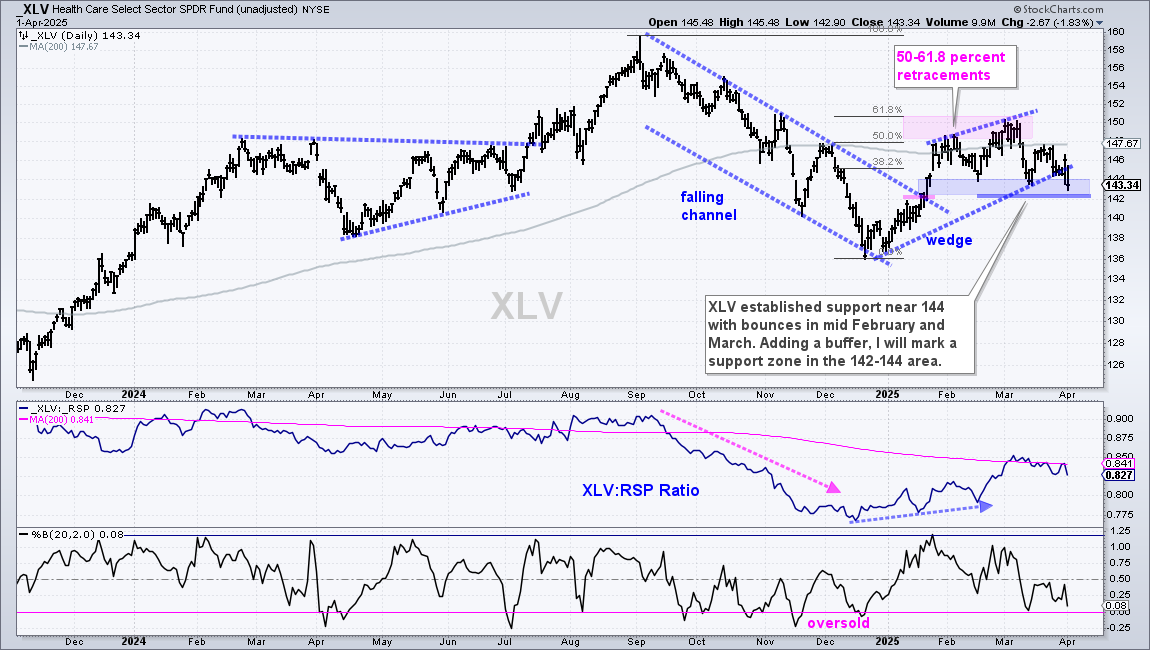
The Healthcare SPDR (XLV) is still one of the best performing equity ETFs in 2025, but it is looking vulnerable to a breakdown and weakness in biotechs could weigh. Support is marked at 142 and a break here would put the rising wedge into play. Notice that this wedge retraced 50-61.8% of the September-December decline and XLV cannot hold above the 200-day SMA (gray line). Thus, the wedge looks like a counter-trend bounce or bearish continuation pattern. A break below 142 would confirm the pattern and signal a continuation lower.
IBB Breaks Down with Sharp Decline
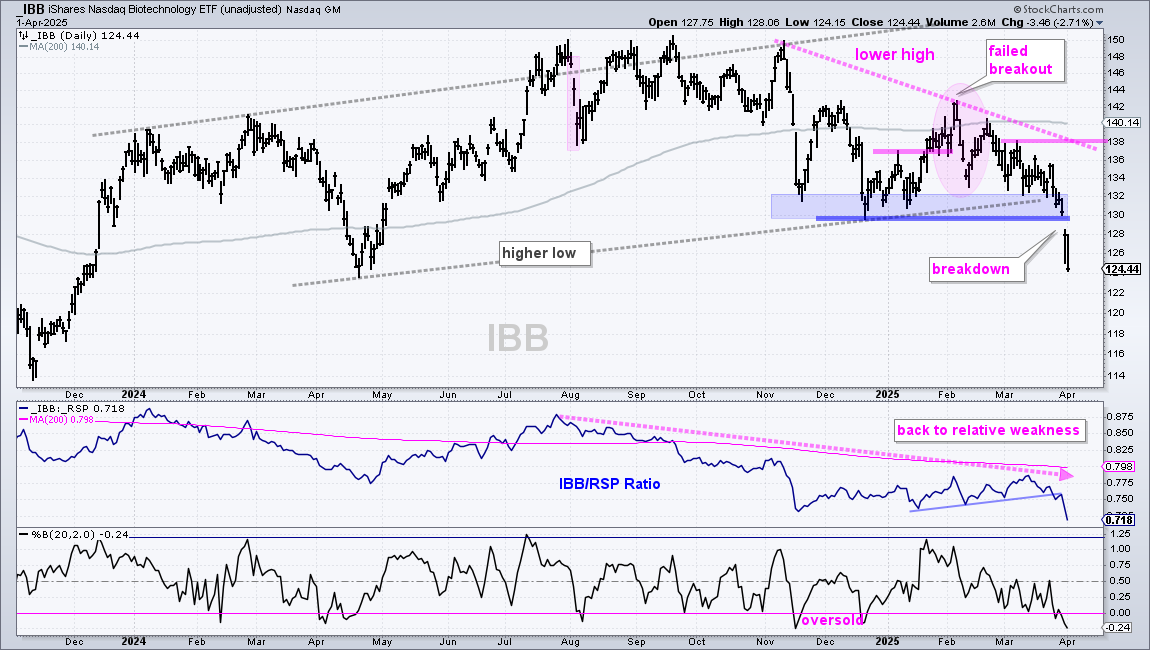
News from the department of Health and Human Services triggered strong selling pressure in biotechs and the Biotech ETF (IBB) broke support with a sharp decline. The gray trendlines mark a choppy rising channel extending back to early 2024. IBB fell to support in the 130-132 area in November and tested this zone the last few months. There was a breakout in January, but the breakout failed as IBB fell back to the support zone. IBB broke support at 130 with a gap on Monday and sharp decline on Tuesday. The indicator window shows the price-relative turning down again and hitting a new low.
AIQ Fails to Hold Breakout
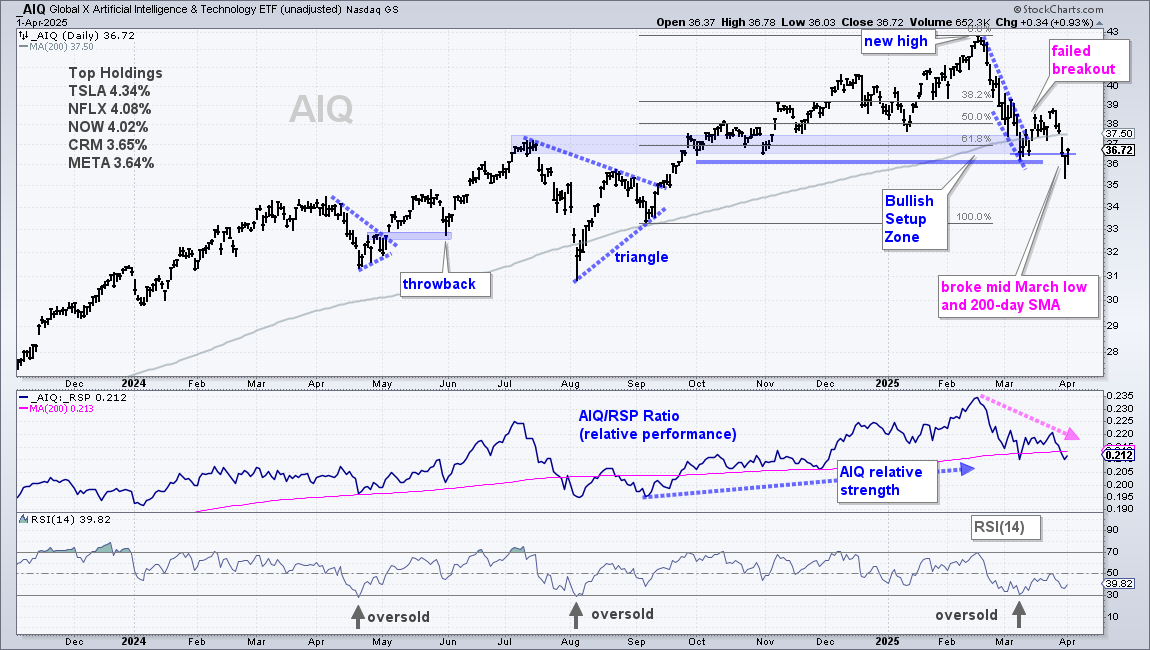
The Global AI & Tech ETF (AIQ) was demoted because it failed to hold its breakout and broke back below the 200-day SMA. Previously, AIQ hit a Bullish Setup Zone and became oversold in mid March. The ETF then broke out with a surge into late March, but this breakout did not hold as AIQ fell below the mid March low and 200-day SMA. The middle window shows the price-relative (AIQ/RSP ratio) turning down and breaking back below its 200-day SMA.
Speculative Setups
The next ETFs fall into the speculative setup category. They are speculative for three reasons. First, we are in a bear market. Second, these ETFs are in downtrends. Third, there is a bull market in noise and random fluctuations.
XLI and IFRA Test Bullish Setup Zones
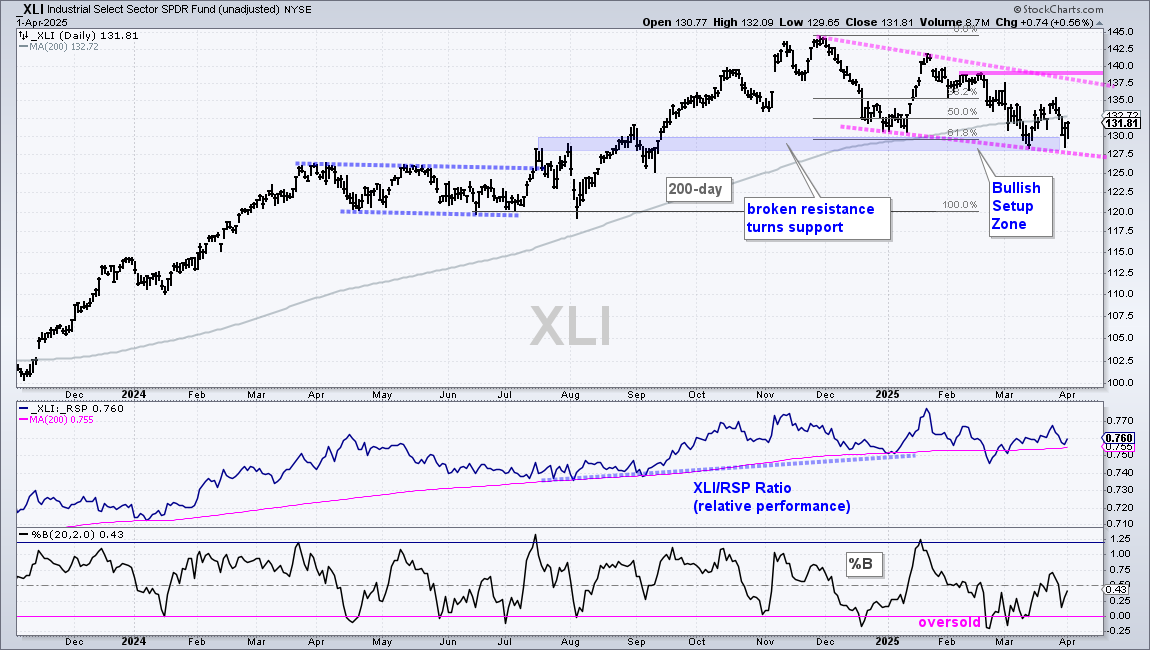
The Industrials SPDR (XLI) is testing a Bullish Setup Zone (blue shading) and shows short-term relative strength as it held the mid March low. This could pave the way for an oversold bounce.
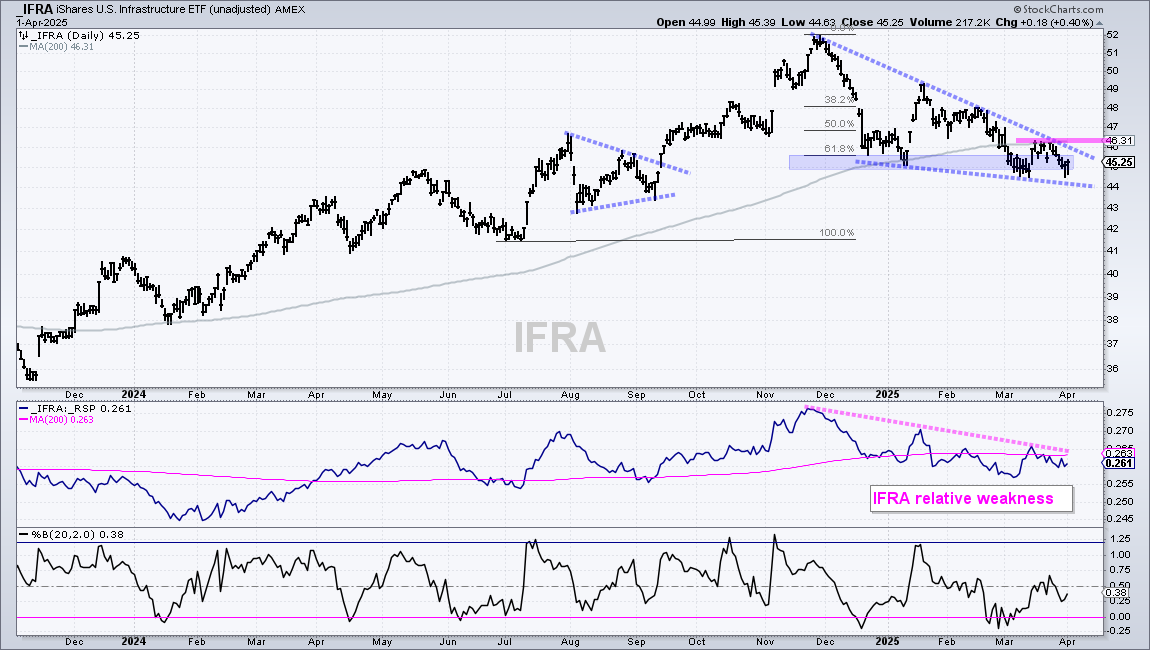
The Infrastructure ETF (IFRA) is trading near a Bullish Setup Zone (blue shading) and showing short-term relative strength as it held the mid March low. This could pave the way for an oversold bounce.
XLB Holds above January Low
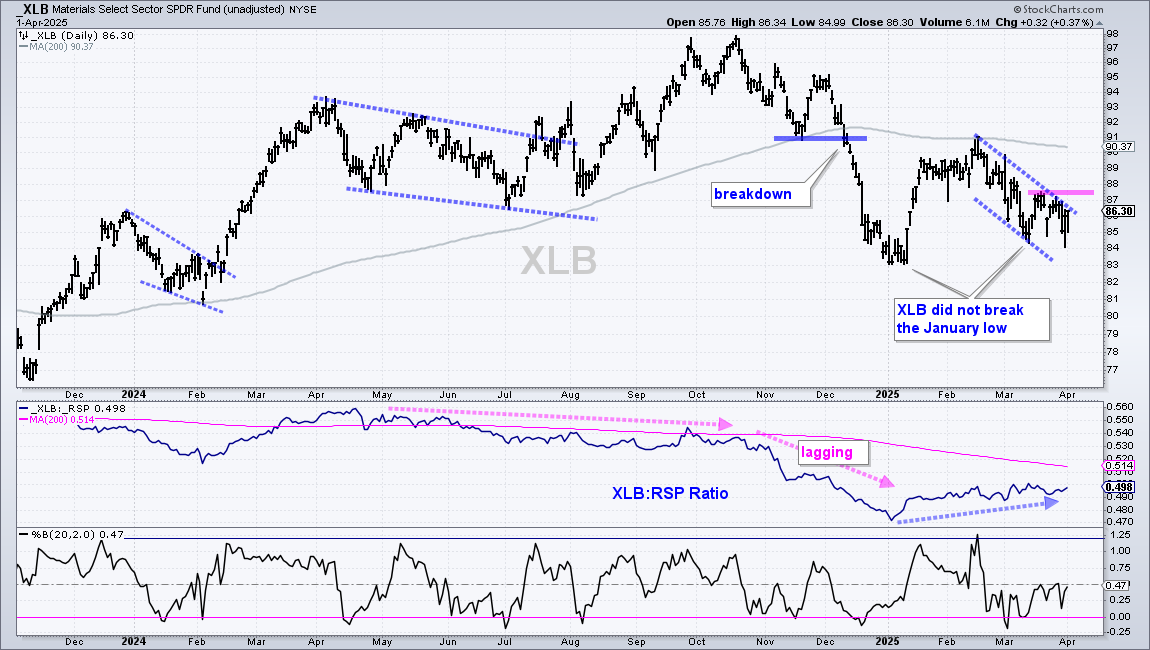
Even though the Materials SPDR (XLB) is in a long-term downtrend and below the 200-day SMA, it is holding up relatively well in 2025. XLB did not break the January low and the price-relative (XLB/RSP ratio) rose the last three months (blue arrow). On the price chart, XLB formed a small falling channel into March with resistance at 87.5. A breakout here would be short-term bullish.
IGV Tests Bullish Setup Zone
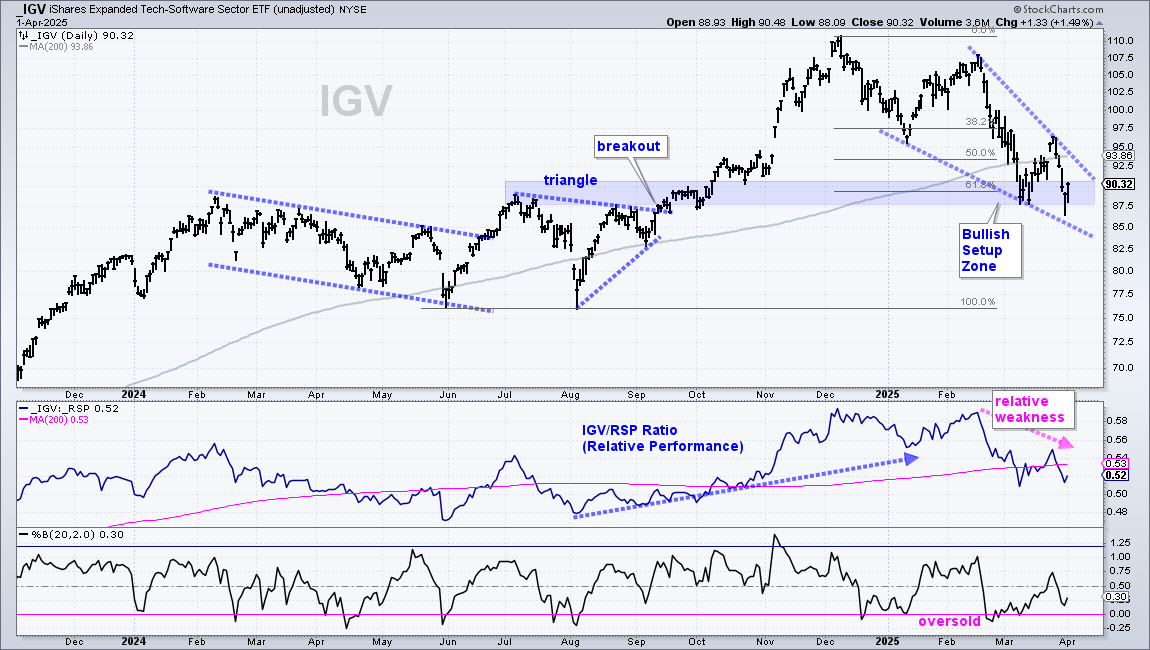
The Software ETF (IGV) led the market with the surge to 110 in early December and then gave most of its back with a sharp decline to the 87.5 area in March. Big moves often give way to big corrections. IGV is trying to firm in a Bullish Setup Zone marked by the 61.8% retracement and prior resistance levels (blue shading). A falling wedge also formed as the ETF tests the mid March low. This is an area that could give way to a bounce.
ITB Leads Lower, but Hits Bullish Setup Zone
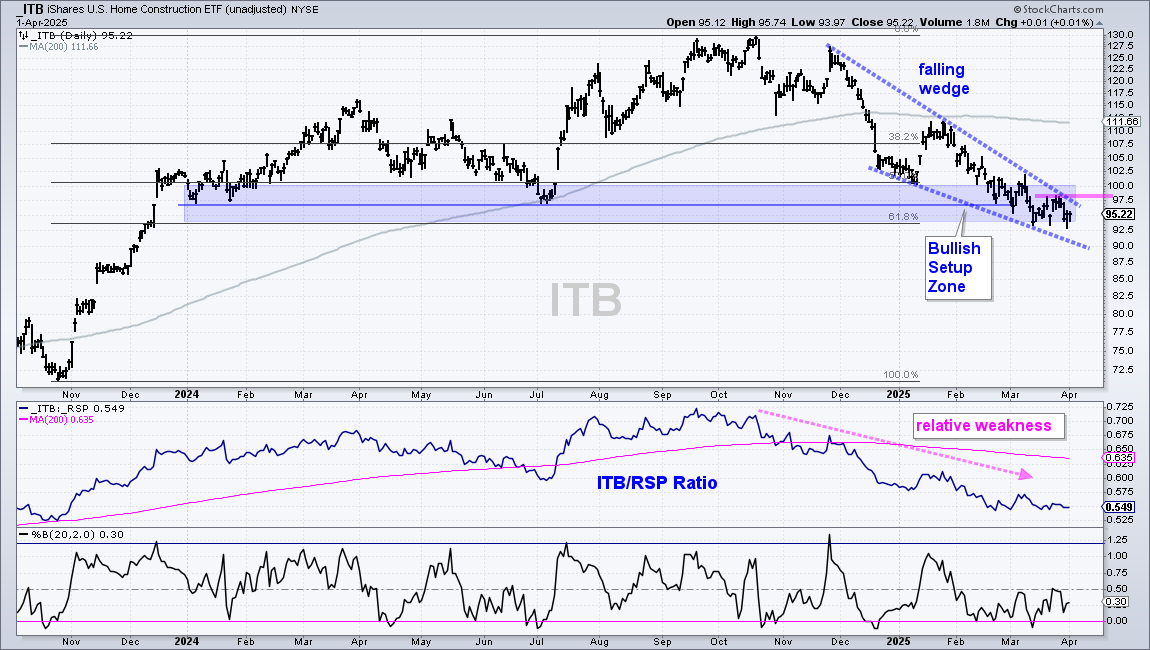
The Home Construction ETF (ITB) is one of the weakest equity ETFs in my universe right now. However, the 10-yr Treasury Yield turned down recently and ITB is trading in a Bullish Setup Zone (blue shading). Here we have the 50-61.8% retracements and support from the 2024 lows. A tight falling wedge is taking shape with resistance marked at 98. A breakout here would be bullish and argue for a tactical bounce (not a long-term trend reversal).
ICLN Firms in 2025 and Forms Bull Flag
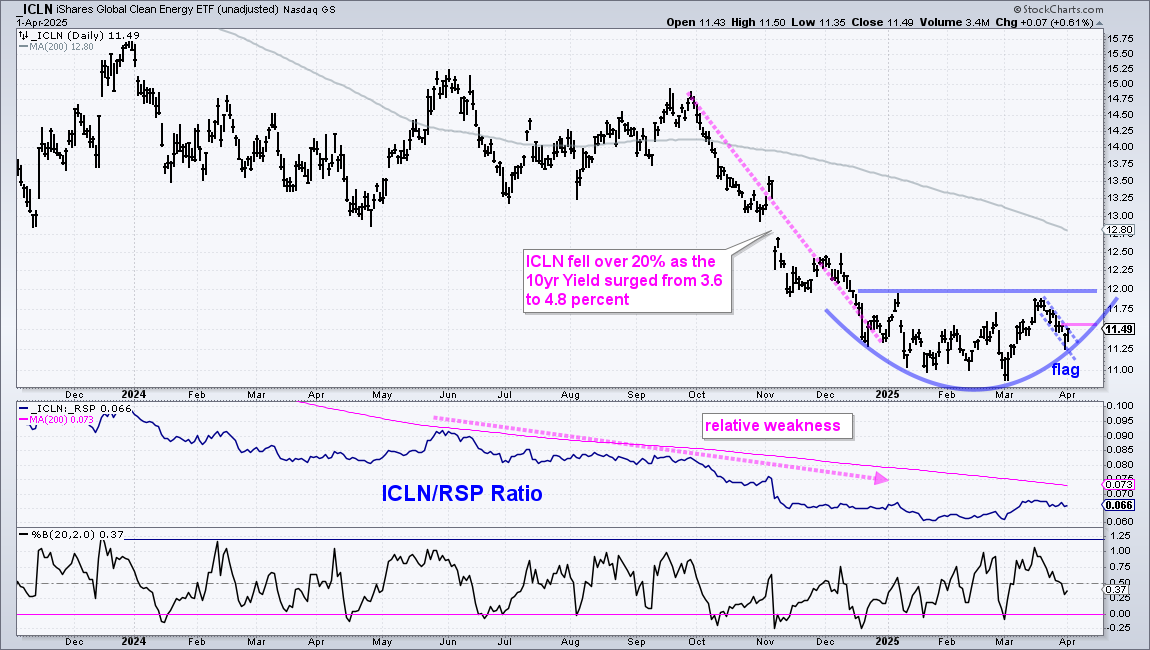
The Global Clean Energy ETF (ICLN) got the double whammy in the fourth quarter as Republicans swept the election and the 10-yr Treasury Yield surged to 4.8%. ICLN fell over 20% and was one of the weakest ETFs at yearend. The ETF is holding its own here in 2025 with a 1% gain year-to-date. On the price chart, a rounding bottom could be forming with resistance at 12. Within the pattern, ICLN surged in the first half of March and the fell back with a falling flag. A flag breakout at 11.60 would provide the first signs of an upturn.
Send feedback to support(at)trendinvestorpro.com or use the contact form. [3]