The next report/video will cover equity ETFs on Wednesday, March 26th.
Short-term, the stock market became oversold in mid March and ripe for a bounce. Longer term, however, the weight of the evidence is bearish and the major index ETFs are in downtrends (SPY, QQQ, RSP). This means we are looking at the possibility of a counter-trend bounce within a bigger downtrend, which is not an ideal situation.
Ideally, we want the bounce and the bigger trend to align. For example, the ideal scenario is an oversold bounce (up) within a bigger uptrend. This means the bounce has the support of the bigger uptrend. The bigger trend is currently down so this means the counter-trend bounce is against the prevailing trend, which creates a headwind. In a bear market, the ideal trading scenario is selling into an overbought condition and resistance zone. We are in a bear market, but SPY is not short-term overbought and not in a resistance zone. Today’s report will show the resistance zone to watch going forward.
We may also be dealing with a selling the rumor and buy the news scenario. The rumors, of course, are tariffs and April 2nd. These rumors will become news when they are announced. Markets are forward looking, which means they sold off in anticipation of the news. Selling pressure is exhausted once the news hits and this can give way to a relief rally as the unknown becomes the known. Not knowing is often worse than knowing.
Report Headlines
- Setting Up for Oversold Bounce
- Sell the Rumor, Buy the News
- Zweig Breadth Thrust Was Oversold
- Fewer Stocks below their 20-day SMAs
- %Above 50-day SMA did Not Become Oversold
- 200-day SMA is a Battle Zone
- SPY Tests mid March Low
- Performance Profile: %Above 50-day EMA
Zweig Breadth Thrust Indicator Was Oversold
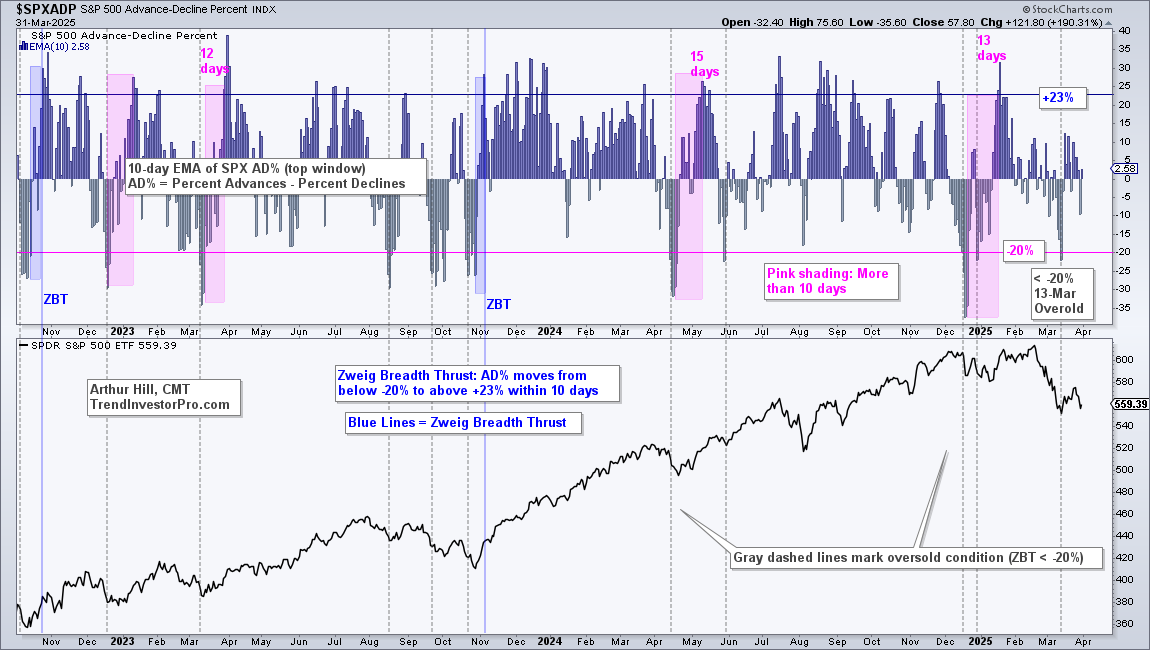
The Zweig Breadth Thrust breadth indicators became oversold on March 13th. The chart below shows the 10-day EMA for S&P 500 AD Percent ($SPXADP) dipping below -20% in mid March (gray dashed line). It did not surge above +23% within the obligatory 10 day window so we did not get a Zweig Breadth Thrust. Dips below -20% signal an oversold condition that can give way to a bounce, which could be underway now. Click here to learn more about the Zweig Breadth Thrust. [1]
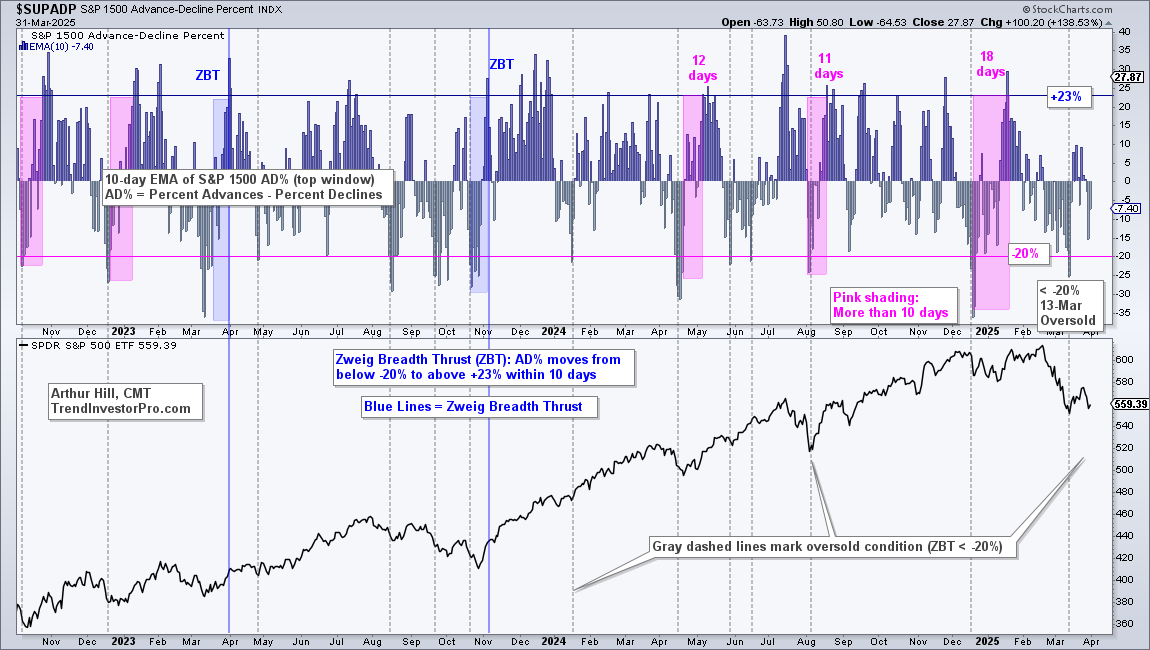
The next chart shows the 10-day EMA for S&P 1500 AD Percent ($SUPADP) dipping below -20% in mid March (gray dashed line). It did not surge above +23% within the obligatory 10 day window so we did not get a Zweig Breadth Thrust. Dips below -20% signal an oversold condition that can give way to a bounce, which could be underway now.
Fewer Stocks below their 20-day SMAs
The next chart shows the percentage of S&P 500 stocks above their 20-day SMAs ($SPXA20R) in the upper window and SPY in the lower window. This indicator becomes OVERSOLD with a move below 10% (gray dashed lines). A thrust signal triggers with a subsequent move above 70% (blue vertical lines). There were three thrust signals over the last two years (3-Nov-2023, 10-May-2024, 16-Jan-2025). The January thrust signal failed as SPY move below its January low in early March. A failed signal is also a sign of weakness.
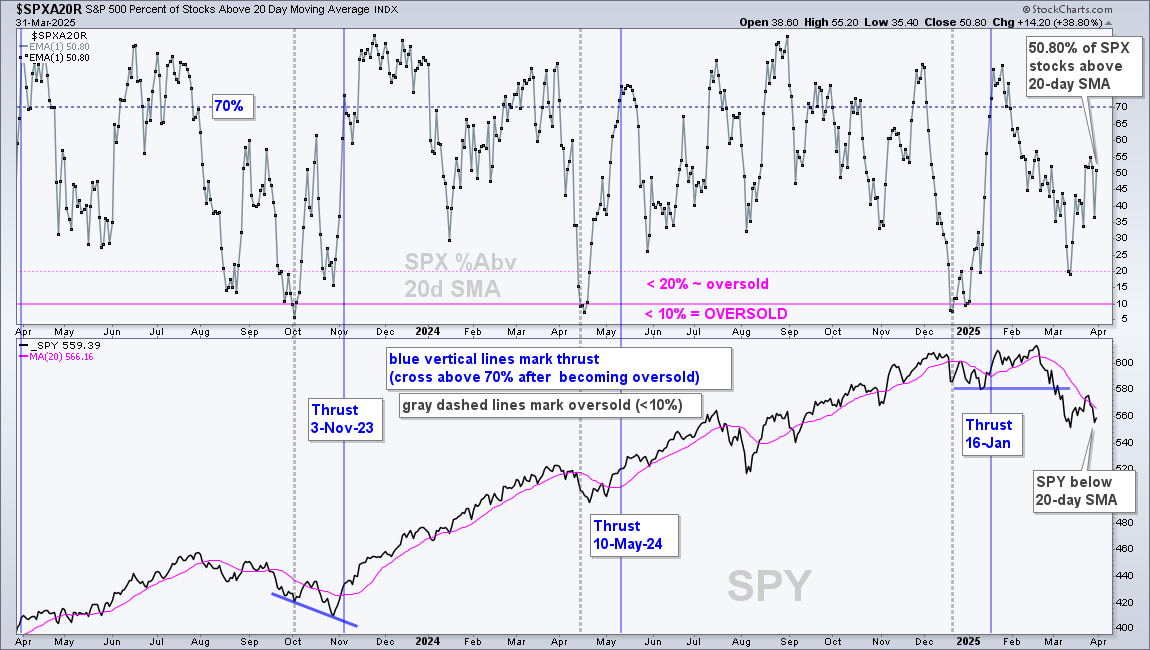
Despite this failed signal, there is an interesting dynamic at work. SPY is trading below its 20-day SMA (pink line in lower window), but 50.80% of S&P 500 stocks are above their 20-day SMAs. Note that 19% of stocks were above their 20-day SMAs on March 13th. SPY is back near its 13-March close, but this indicator is holding up better than the underlying index ETF (SPY). This means the average stock is holding up better, which supports the idea for an oversold bounce.
%Above 50-day SMA did Not Become Oversold
The next chart shows the percentage of S&P 500 stocks above their 50-day SMA ($SPXA50R) in the top window and SPY in the lower window. This indicator is OVERSOLD when below 20% and a thrust triggers with a subsequent move above 60%. A bullish thrust signal triggered on January 27th, but this signal failed as SPY broke the January low in early March. Again, a failed bullish signal is a sign of weakness.
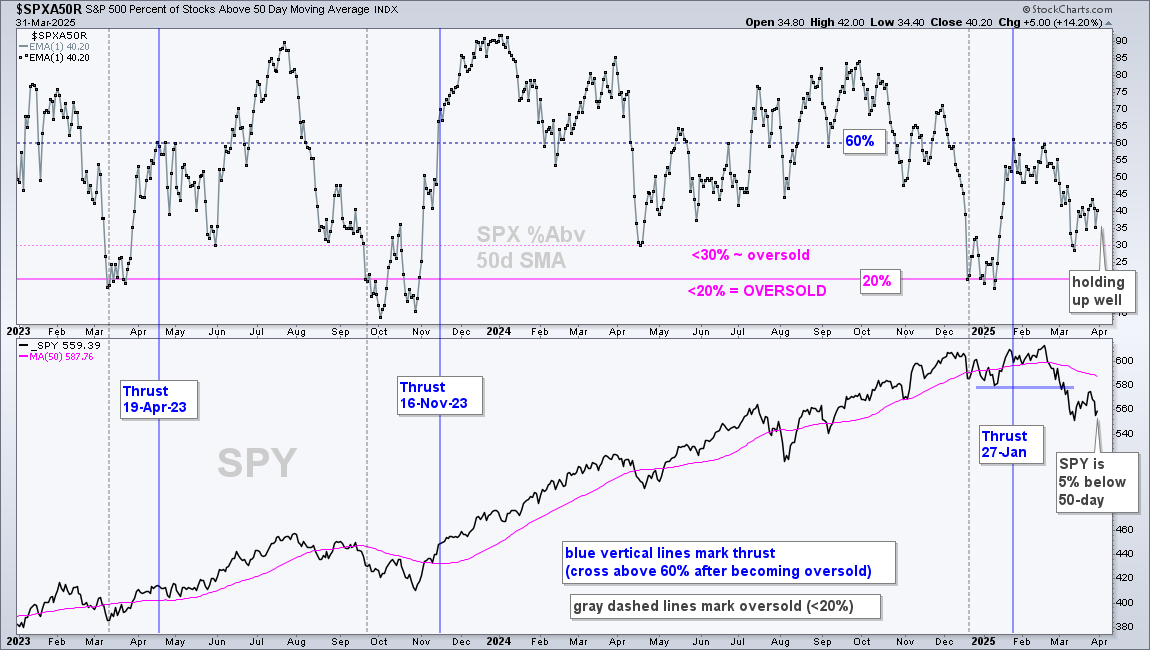
Despite the failed signal, SPX %Above 50-day SMA is held up relatively well in March. SPY broke its 50-day SMA in late February, remained below the 50-day the entire month of March and fell 10% from its high. Despite weakness in SPY, SPX %Above 50-day SMA did not become OVERSOLD with a move below 30%. This means the average stock held up better than the underlying index. Currently, some 40% of S&P 500 stocks are above their 50-day SMA and SPY is 5% below its 50-day. The broader market is holding up better and this could give way to an oversold bounce.
200-day SMA is a Battle Zone
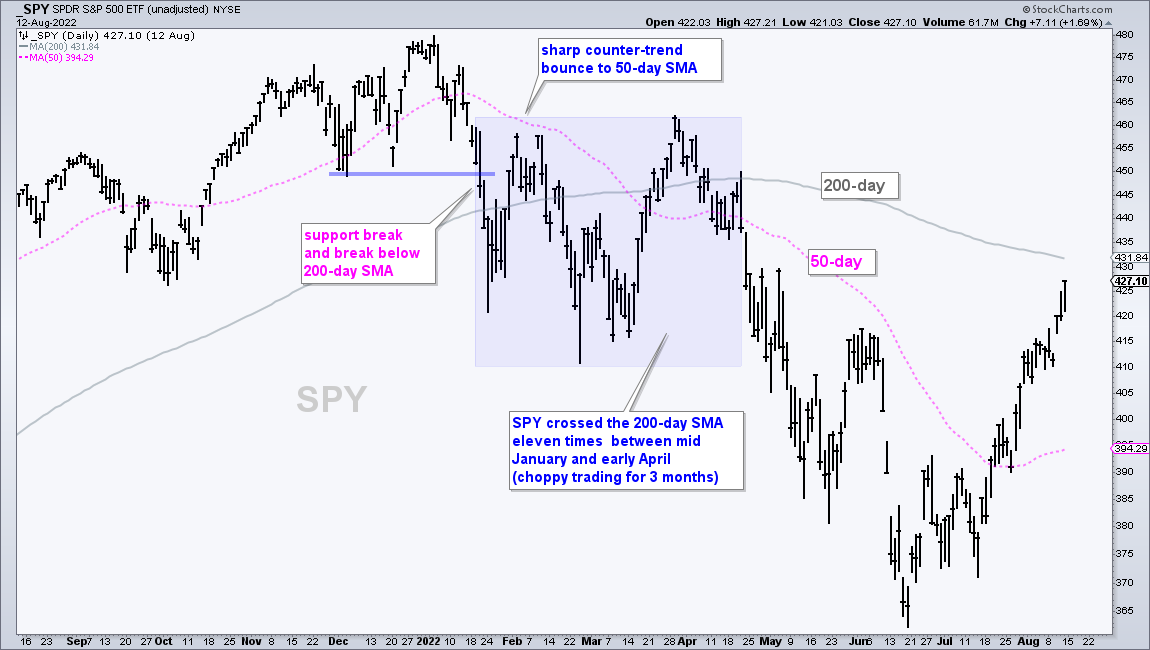
The next chart shows SPY with the 200 and 50 day SMAs. SPY broke down in mid January 2022 with a 10% decline that broke the 200-day SMA and support (blue line). Despite a break that broke the bull’s back, SPY crossed the 200-day SMA another 10 times in the months to come (blue shading). These crosses are based on closing prices, not intraday highs and lows. The lesson here is that the 200-day SMA is often a battle zone, especially after a downside cross. The bulls do not go quietly and counter-trend bounces are often sharp. Note that the first counter-trend bounce failed just below the 50-day SMA (pink dashed line). Also note that SPY traded in a choppy range for around three months. Talk about frustrating!
SPY Tests mid March Low
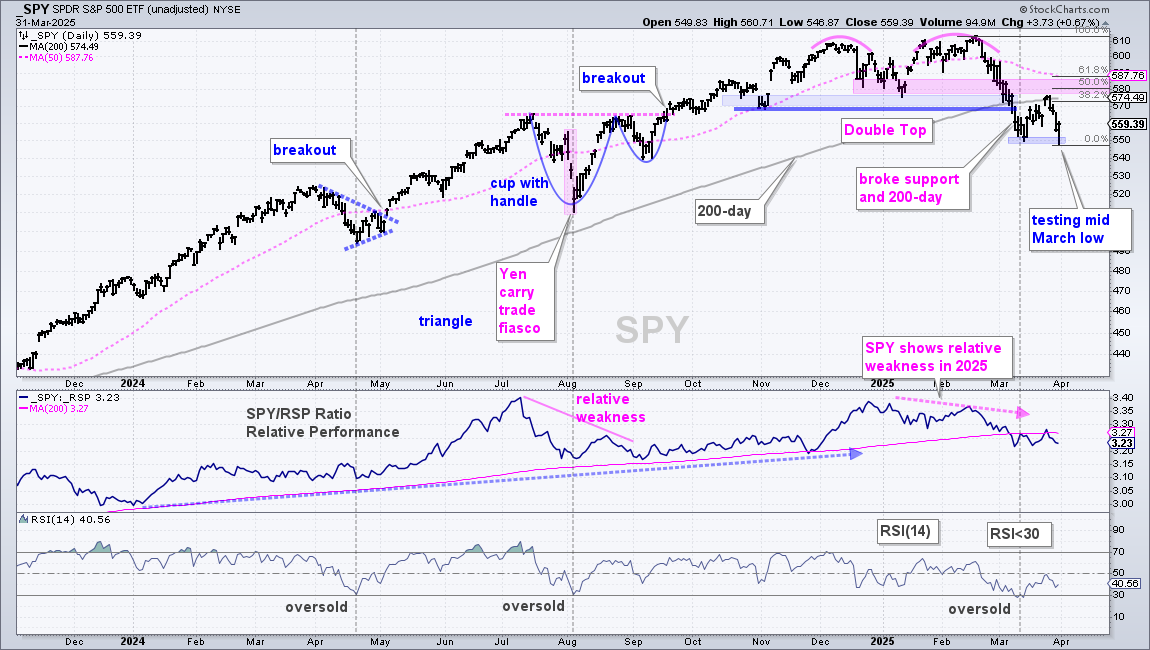
SPY is in a long-term downtrend, but the ETF became short-term oversold in mid March and could deliver an oversold bounce back to the 50-day SMA. First, SPY formed a Double Top and confirmed this reversal with a breakdown in March. The long-term trend is down. SPY became oversold in mid March, bounced back to the underside of the 200-day SMA (gray line) and fell back to the 550 area on Monday. Last week’s decline and Monday’s intraday dip amounts to a test of the mid March low. Also notice that SPY dipped and closed strong on Monday. Thus, we could be setting up for an oversold bounce with a target zone around 580 (pink shading). This zone stems from the 50-61.8% retracements, the 50-day SMA and broken supports, which turn resistance. This is a trader’s area to watch for a short-term reversal.
Performance Profile: %Above 50-day EMA
The table below shows the percentage of stocks above their 50-day EMA for five indexes, 11 sectors and 5 sub-sectors (industry groups). This table is sorted by %Above 50-day EMA to show the strongest at the top and the weakest at the bottom. The CHG column shows the 5-day value change in the indicator (not percentage change). Gold Miners, Utilities, Consumer Staples, Finance and Healthcare are holding up the best with more than 44% of component stocks above their 50-day EMAs. Leadership in defensive sectors reflects risk-aversion in the stock market.
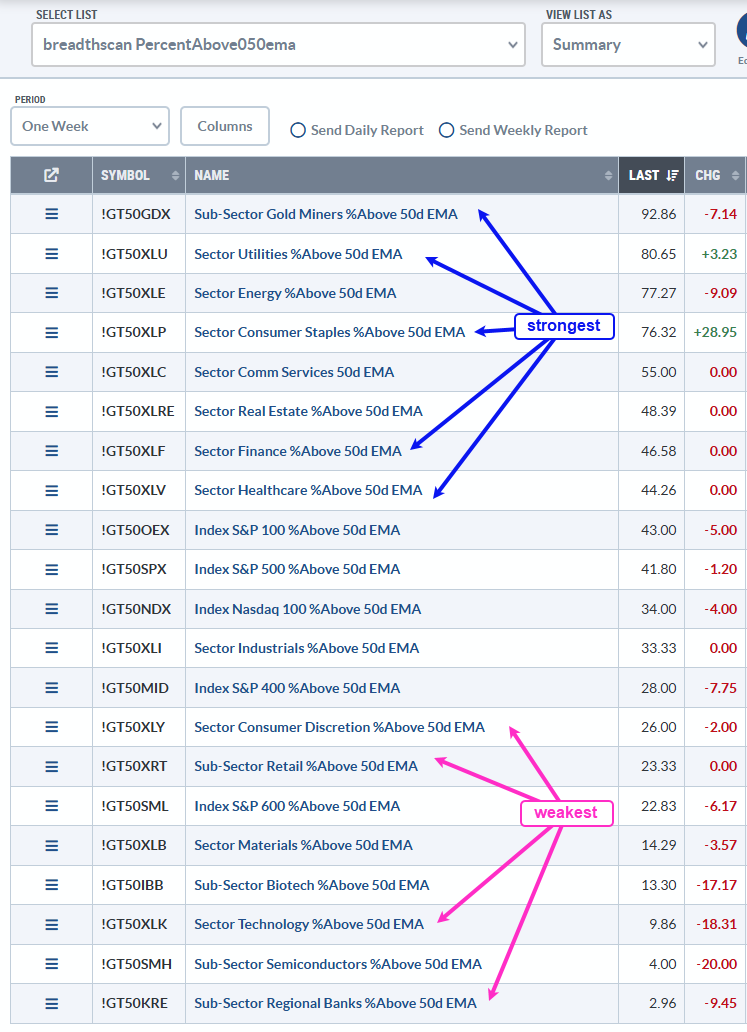
In the lower third, we see the most weakness in Consumer Discretionary, Retail, Technology, Semiconductors and Regional Banks. Their %Above 50-day EMA indicators are all below 30%. Even though they are technically oversold, they are bearing the brunt of selling pressure. Weakness in these offensive sectors and groups reflects risk aversion in the stock market. We want to see these sectors/groups leading, not lagging.
Send feedback to support(at)trendinvestorpro.com or use the contact form. [2]