Zweig Breadth Thrust Indicators Get Oversold Bounce
Posted By
Arthur Hill, CMT
On
In
Archive |
No Comments
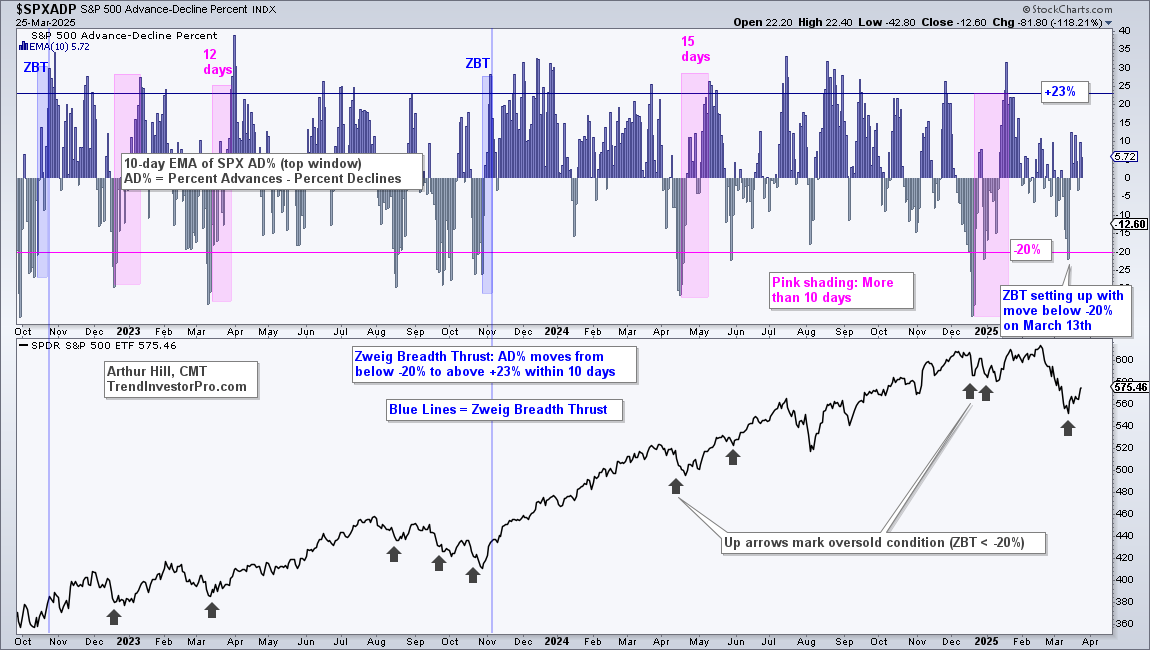
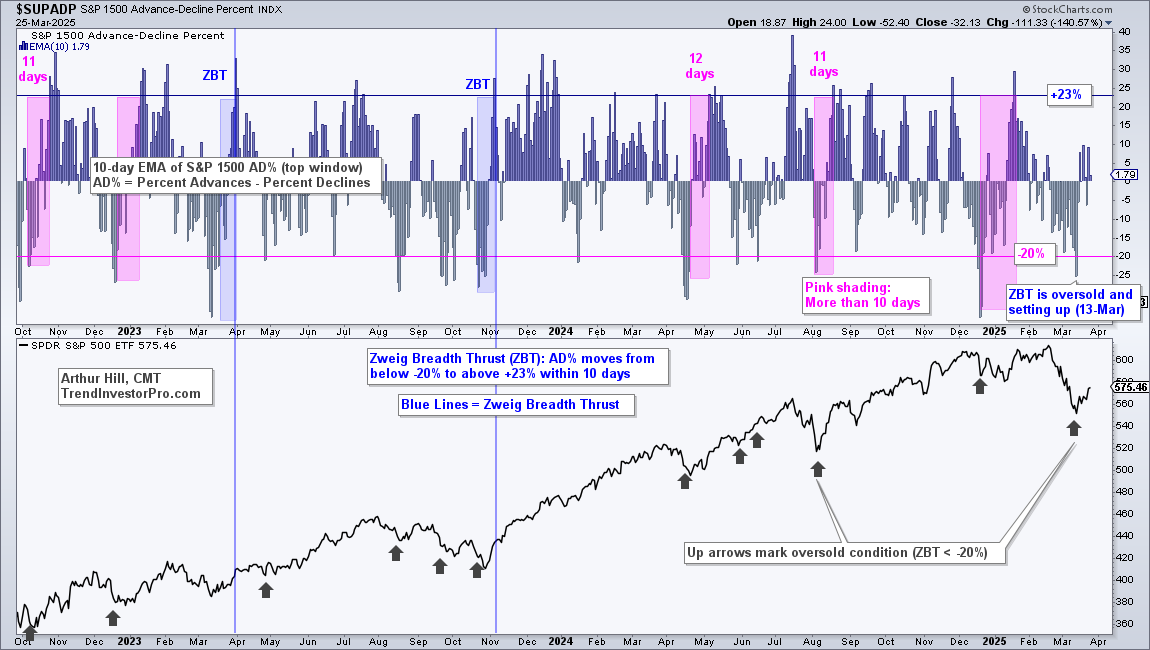
This is an update for the Zweig Breadth Thrust (ZBT) indicators, which were featured on March 21st. The S&P 500 and S&P 1500 Zweig Breadth Thrust indicators became oversold with moves below -20% on March 13th. The black arrows on the SPY chart (bottom window) show the oversold setups. An oversold ZBT indicator means the number of advancing stocks fell sharply and short-term breadth is ripe for a recovery bounce. Think of it as a rubber band that gets stretched and then snaps back. SPY is getting that oversold bounce with a move above 570 the last seven days.
A move below -20% is also the setup for a Zweig Breadth Thrust (blue vertical lines). An actual ZBT signal triggers when the indicator moves above +23% within 10 trading days. This means it needs to exceed +23% by March 27th. These signals reflect a sharp reversal in breadth the 10-day SMA of AD% surged from an oversold condition. A Zweig Breadth Thrust is a bullish signal for the market, but we need to see strong follow through to go from an oversold bounce to a bullish signal. Therein lies the key. Bottom pickers and mean-reversion traders provide the buying pressure for the first oversold bounce. Institutions and new buyer provide the follow through that turns this oversold bounce into a bullish signal. This is follow-through buying pressure. The next chart shows the S&P 1500 ZBT Indicator with similar characteristics.
Send feedback to support(at)trendinvestorpro.com or use the contact form. [1]