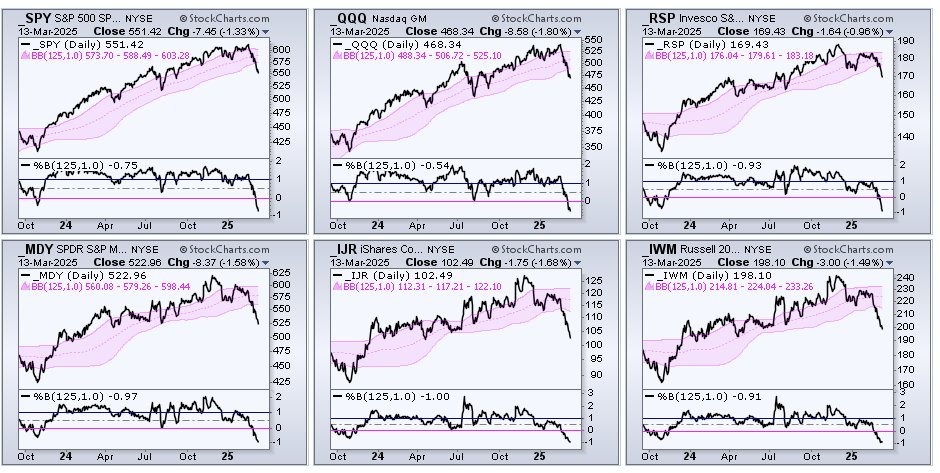
The major index ETFs reversed their long-term uptrends with sharp declines this year. Small and mid caps started with trend reversals in late February (MDY, IJR, IWM). Large-caps followed with trend reversals in the first half of March (SPY, QQQ, RSP). The chart below shows all fix breaking their lower Bollinger Band (125,1). This signal is confirmed by %B (125,1), which turns negative when the close is below the lower Bollinger Band.
What now? The S&P 500 is the single most important benchmark for stocks so I will take an in-depth look at SPY. We will define the long-term trend, review the 2022 bear market and offer a prognosis going forward.
The Current Breakdown and Reversal
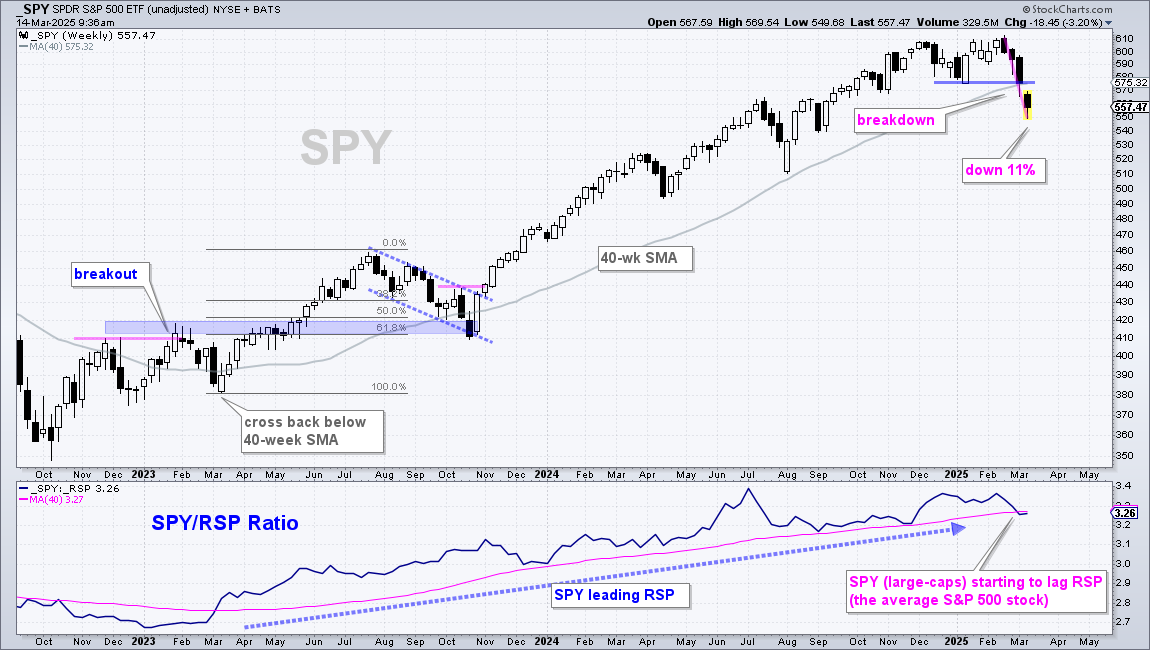
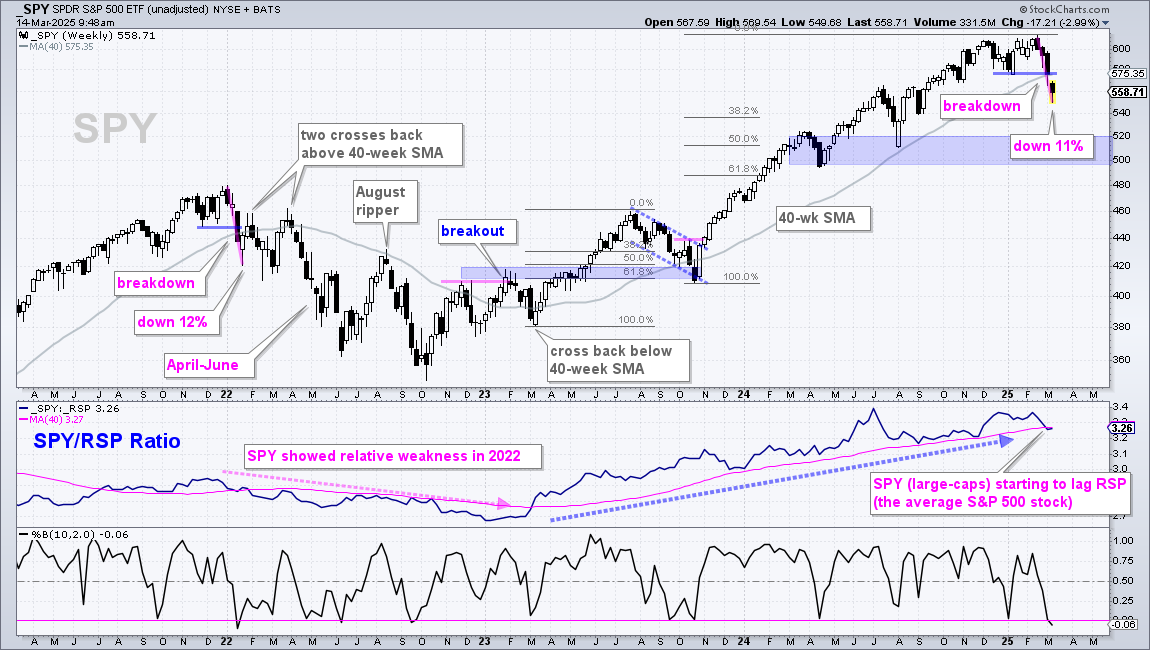
The chart below shows weekly candlesticks for SPY since October 2022. The gray line is the 40-week SMA, which is equivalent to the 200-day SMA. On the top right, we can see a break below support and a break below the 40-week SMA with an 11% decline the last four weeks (high to low). This decline reversed the long-term uptrend. The middle window shows the SPY/RSP ratio breaking below its 40-week SMA for the first time since early March 2023. After outperforming for two years, large-caps (SPY) are underperforming the average stock in the S&P 500 (RSP). The long-term trend is down on this chart and large-caps show relative weakness.
Reviewing the 2022 Breakdown and Bear Market
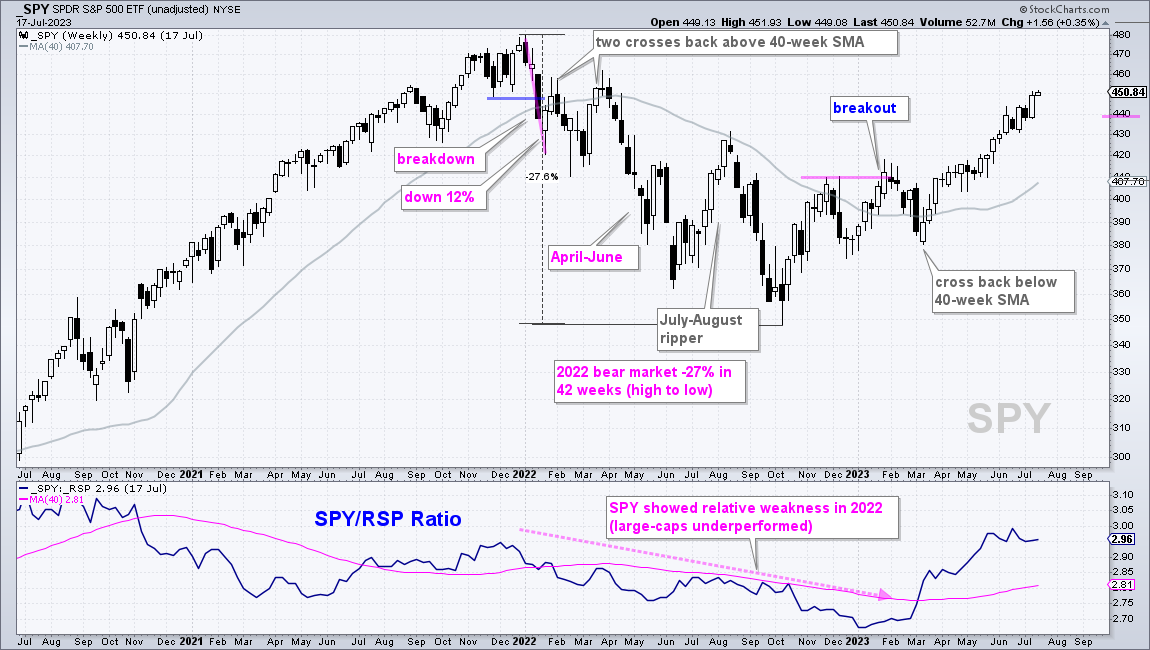
Now let’s look at the last bear market, which started in January 2022. It too started with a four week outsized decline (12% from high to low). SPY also broke support and the 40-week SMA, and the SPY/RSP ratio moved below its 40-week SMA. Thus, a bear market ensued as SPY broke down and started underperforming RSP in January 2022.
After the initial bear market signal, SPY was oversold in mid January 2022 and rebounded with a move back above the 40-week SMA. In fact, SPY crossed back above its 40-week SMA twice before falling sharply from April to June 2022. There was an exceptionally sharp rip higher in August, but this ripper failed near the 40-week and SPY fell to new lows in October 2022. The downtrend reversed with a breakout (higher high) in February 2023.
Price Target - Until the Facts Change
Returning to the present day…No two bear markets are the same. Not all breakdowns lead to bear markets or extended declines. However, we must accept the evidence before us and change when this evidence changes. As Lord John Maynard Keynes said: When the facts change, I change my mind – what do you do, sir? The evidence is currently bearish and I will continue to monitor it on a daily/weekly basis.
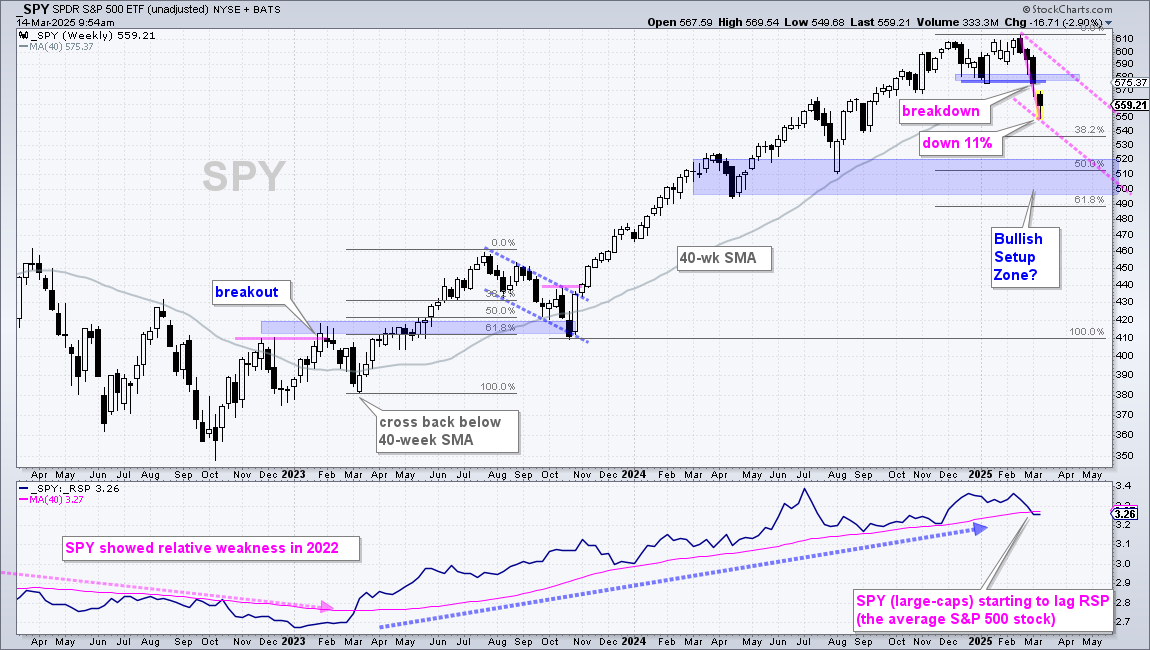
I am not a big fan of price projections or targets, but here is a stab. First, SPY is oversold and sentiment is extremely bearish. This argues for an oversold bounce that could extend to the 580 area. Here we have broken support turning into resistance and the underside of the 40-week SMA. An overshoot is possible to 590. We could then see a reversal and continuation lower with a target zone in the 500-520 area (blue shading). Here we have the April-August lows, the 50% retracement line and the lower line of a possible falling channel. Keep in mind that this is a guestimate.