Posted By
Arthur Hill, CMT
On
In
Archive |
No Comments
I will post a Market Regime update on Friday, March 14th.
Report Headlines
Gold SPDR Extends to New Highs
Silver ETF Extends on Wedge Breakout
Gold Miners ETF Extends on Wedge Breakout
Silver Miners ETF Breaks Out of Wedge
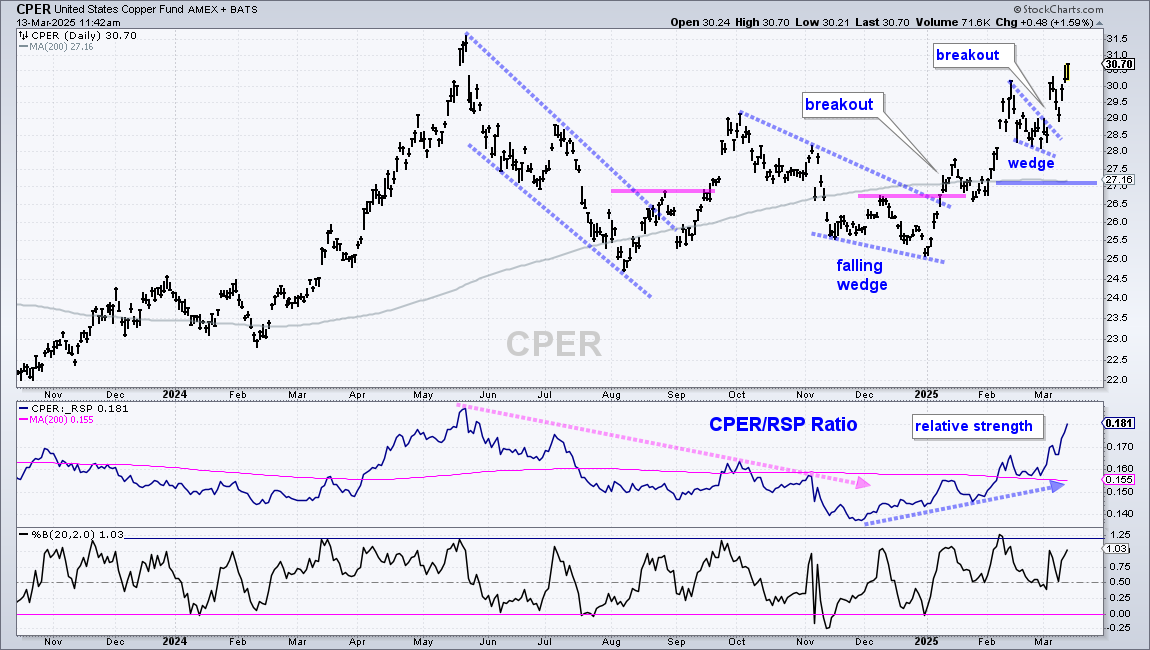
Copper ETF Extends on early January Breakout
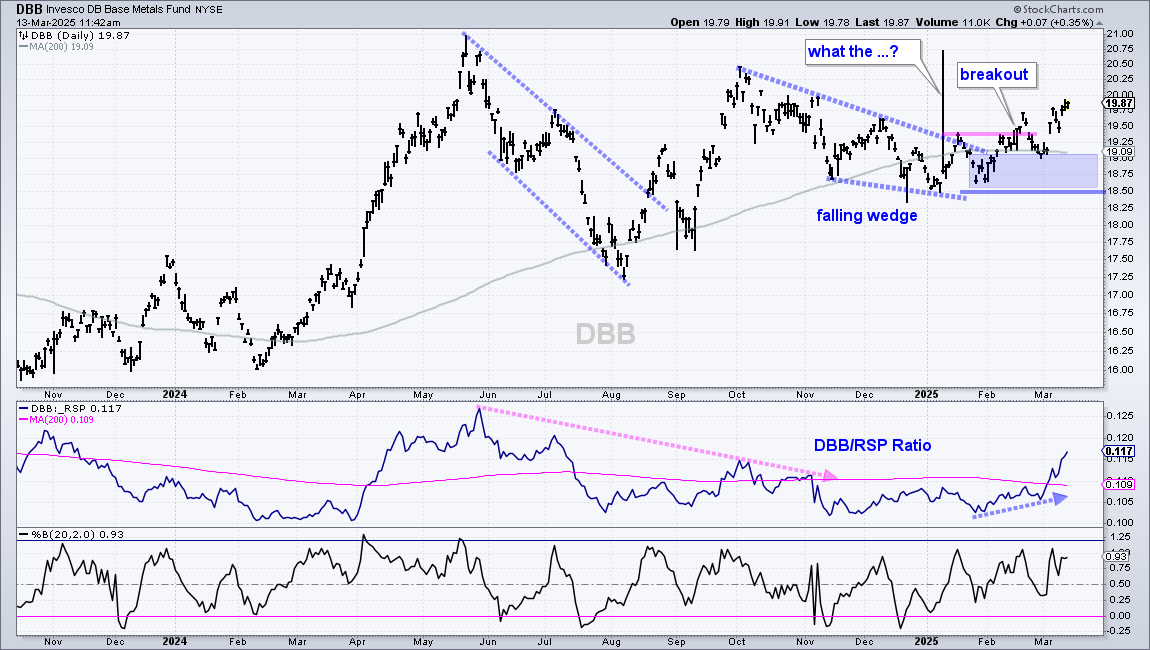
DB Base Metals ETF Breaks Resistance in late February
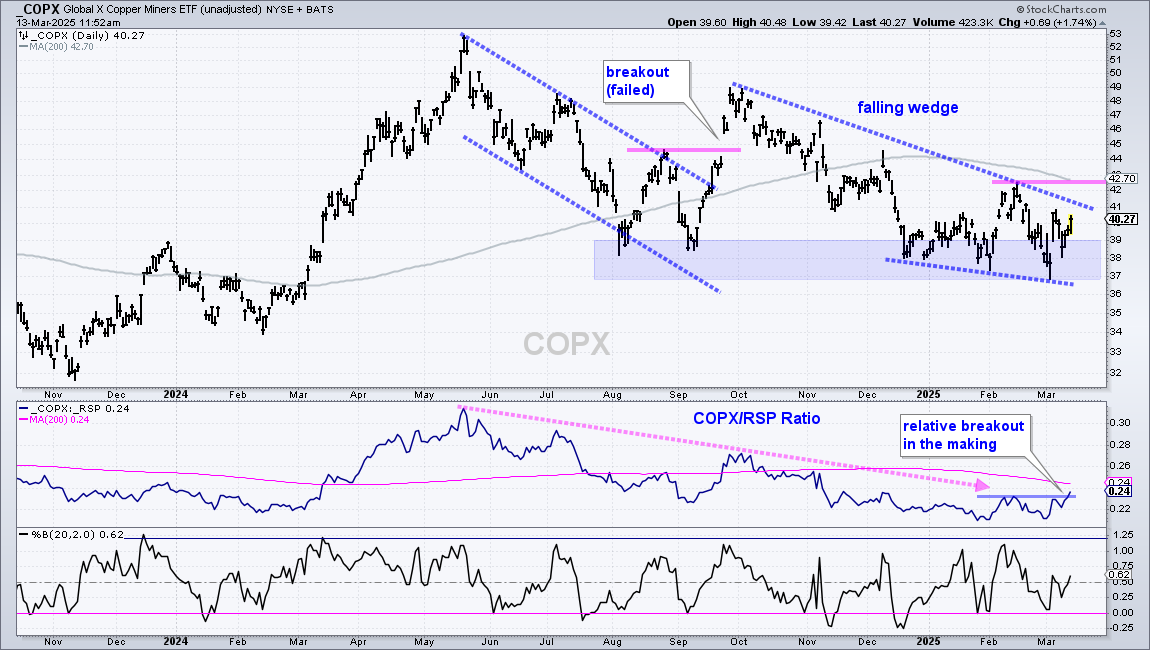
Copper Miners ETF Finds Support in 2025
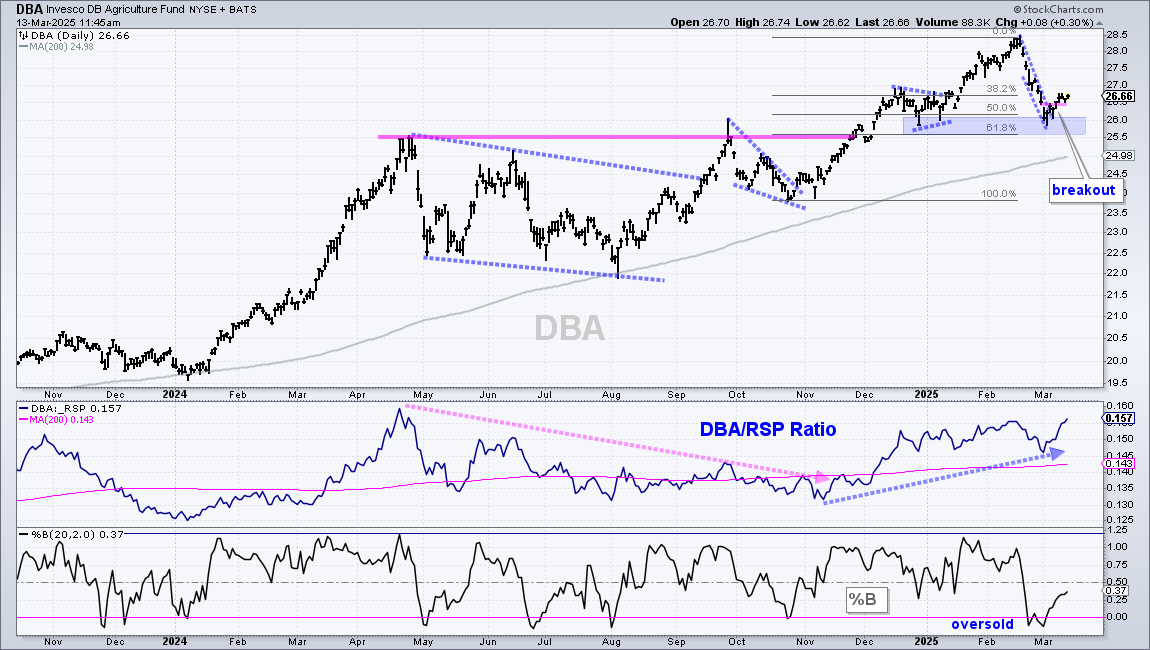
DB Agriculture ETF Turns Up at Bullish Setup Zone
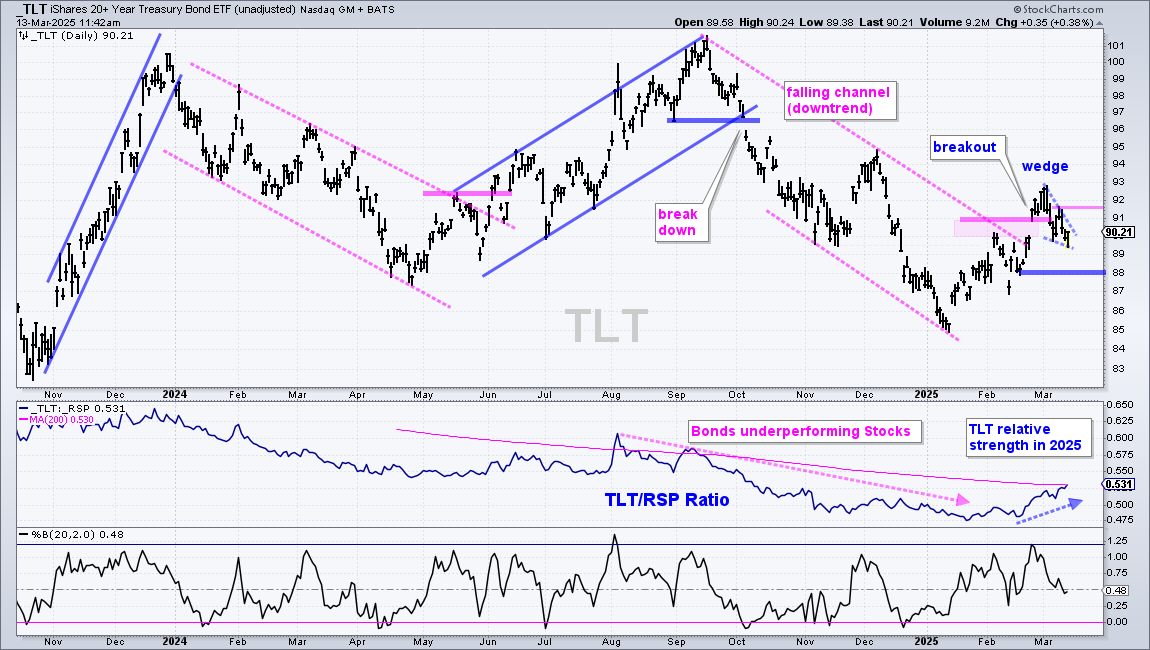
TLT Forms Small Wedge after Breakout Surge
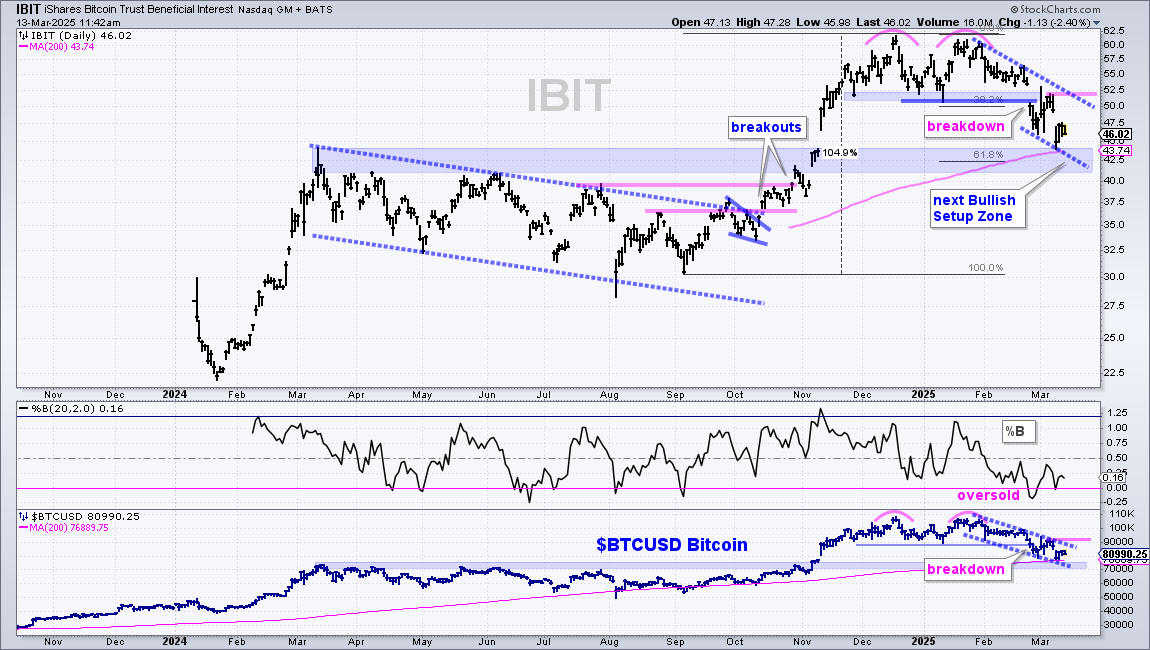
Bitcoin ETF Remains with confirmed Double Top
Today’s report will cover the commodity, bond and Bitcoin ETFs that were featured in yesterday’s video (here[1]). Precious metals are leading the commodity complex and this strength is transferring to the gold and silver miners ETFs. Industrial metals ETFs are not far behind with copper taking the lead here. Even so, copper miners remain subdued and have yet to break out. I am not covering oil because I do not see a trend and I am not covering natural gas because it is simply too volatile. This report concludes with a short-term bullish pattern in TLT and the confirmed Double Top in Bitcoin.
This report shows the classic website layout: headline, written analysis and chart linked to StockCharts. Even though the PDF format saved time, it was less than ideal because chart width was limited and the text under the chart was too small. This website layout allows for a wider chart and decent font size, which makes it easier to see chart details and read the analysis. If interested, I created a PDF with the charts in my ETF ChartList (see below).
Gold SPDR Extends Leading Uptrend
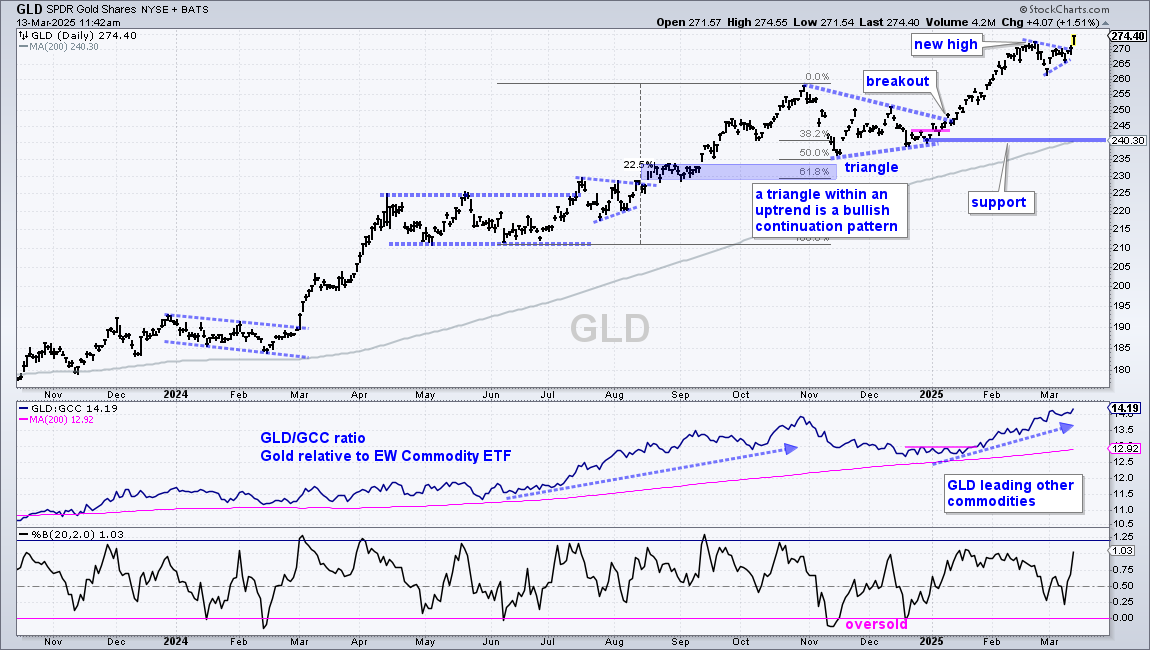
The Gold SPDR (GLD) has been leading the market since its triangle breakout in early January. GLD was already in an uptrend to start the year. This triangle was a consolidation within the uptrend and the breakout signaled a continuation higher. After hitting new highs throughout February, GLD consolidated with a small pennant into March and broke out with a move above 270 this week. I am leaving long-term support at 240 for now. Gold is leading the commodity group because the middle window shows the GLD/GCC ratio hitting new highs in March. GCC is the WisdomTree Enhanced Commodity Strategy Fund (GCC), which offers broad exposure to the main commodity groups (Energy, Industrial Metals, Precious Metals, Gains, Softs, Livestock).
Silver ETF Extends on late January Breakout
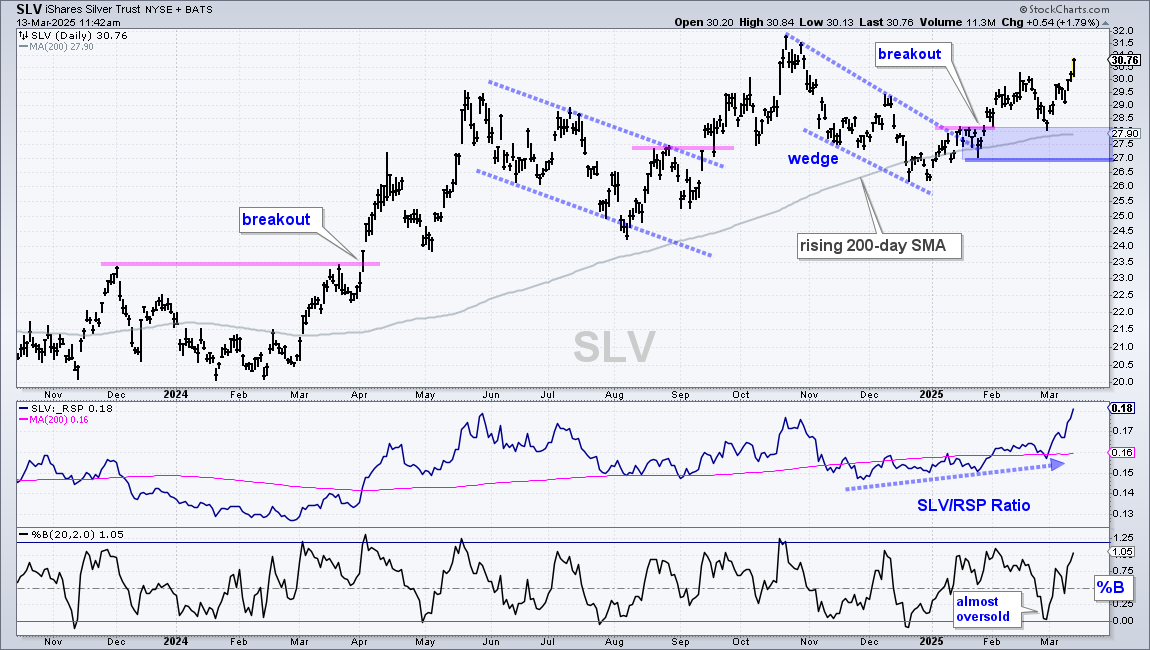
The next chart shows the Silver ETF (SLV) in a long-term uptrend since the March surge and April breakout. SLV corrected with a falling wedge that returned to the rising 200-day SMA in December and broke wedge resistance in late January. The ETF extended on this breakout and the odds favor a move to new highs. The breakout zone in the 27-28 area turns support (blue shading), a break of which would call for a re-evaluation. The middle window shows the SLV/RSP ratio rising in January-February and accelerating higher in March. Silver is outperforming the stock market. Note that Silver has above average volatility and risk.
Gold and Silver Miners ETFs Follow Metals Higher
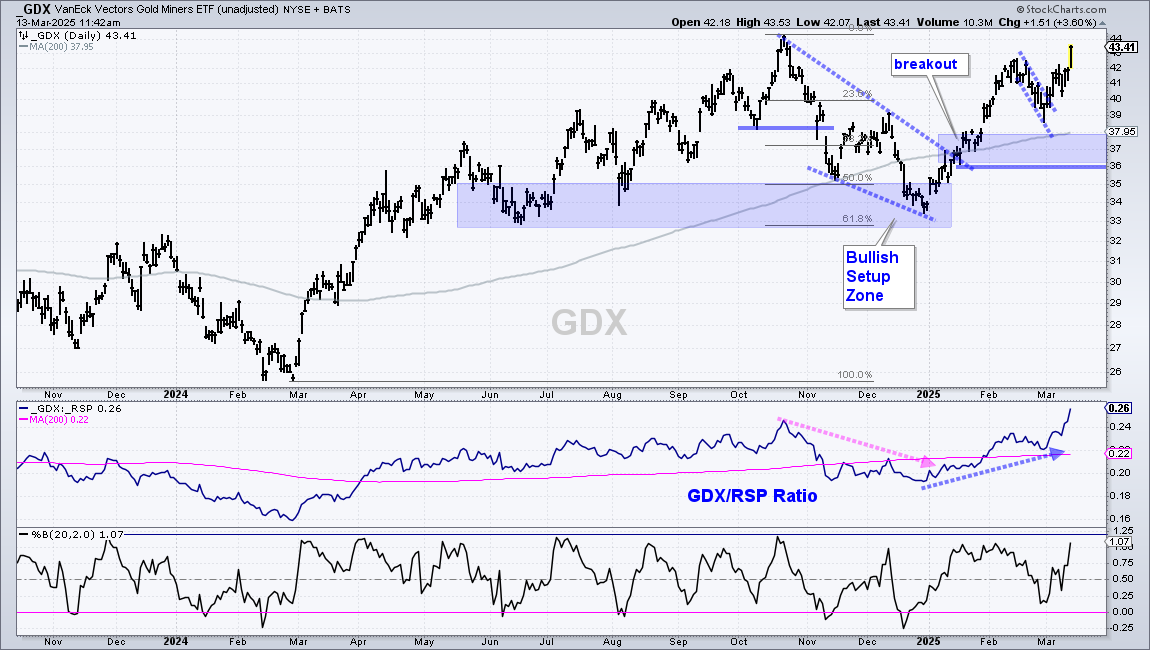
The next chart shows the Gold Miners ETF (GDX) with a falling wedge in November-December. This wedge retraced 50-61.8% of the prior advance and found support near the June-July lows. Together, the retracements and support mark a Bullish Setup Zone. GDX reversed course in January with a breakout and extended higher the last two months. I am marking a support zone in the 36-37 area. The middle window shows the price-relative hitting a new high as GDX outperforms the broader market.
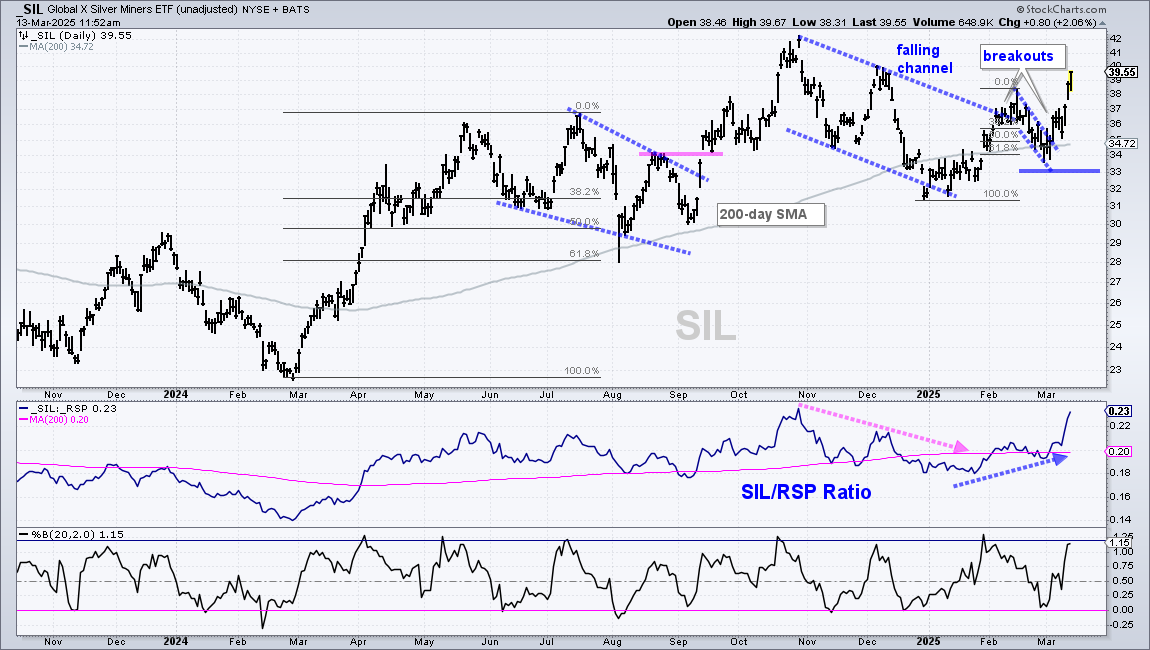
The next chart shows the Silver ETF (SLV) with two breakouts in the last two months. First, the ETF is in a long-term uptrend with a new high in November and price above the rising 200-day SMA. SLV fell sharply in the second half of December and broke its 200-day SMA for a few weeks. After stabilizing in January, SLV broke out of the falling channel with a surge into February. Overall, I view this falling channel as a correction within a bigger uptrend and the breakout signals a continuation of this uptrend. Short-term, SLV fell back into early March with a steep falling flag that retraced around 61.8% of the January-February surge. The ETF broke out with a surge the last two weeks and appears headed for new highs.
Copper and Base Metals ETFs Extend on Breakouts
The Copper ETF (CPER) is leading the market in 2025 with a breakout in early January and a rising relative strength line. CPER corrected from October to December with a falling wedge and then broke out with a surge in early January. After a small pullback, the ETF continued sharply higher in early February. A small wedge formed into early March and CPER broke out again in early March. The move this year is sharp (+22%) and copper can be volatile. I am marking re-evaluation support at 27.
The next chart shows the DB Base Metals ETF (DBB), which is equal parts copper, aluminum and zinc. DBB is not as strong as copper, but has a breakout working all the same. As with the other metals, DBB corrected into yearend and then broke out in early 2025. DBB formed a falling wedge and broke resistance with a surge in mid February. I view the wedge as a correction within a bigger uptrend and the breakout signals a continuation of this uptrend. The February-March lows mark support in the 18.50-19 area (blue shading).
Copper Miners Lag, but Find Support and Firm
The Copper Miners ETF (COPX) is lagging copper because it has yet to hold a breakout and extend higher. Overall, it is hard to make the case for a long-term uptrend because COPX is below its 200-day SMA and trending lower since summer. Notice that the September breakout failed as the ETF fell back to the 37-38 area. COPX managed to firm in this area since late December and even popped here in March. Buying interest its perking up with two levels to watch. A move above 41 would break the wedge line and early March high. Follow through above the February high would reverse the downtrend. The middle window shows the COPX/RSP ratio firming the last two months and turning up in March as COPX starts to show relative strength.
DB Agriculture ETF Bounces off Bullish Setup Zone
The DB Agriculture ETF (DBA) is also participating in the commodity rally. While industrial metals corrected int the third quarter of 2024, DBA moved higher into yearend and extended to new highs in January-February. There was a sharp pullback in late February, but the ETF found support near the late December and early January lows. This area also marks a 50-61.8% retracement zone. Together, support and retracements mark a Bullish Setup Zone. DBA turned up the last few days and broke short-term resistance.
TLT Pulls Back after Breakout Surge
The 20+ Yr Treasury Bond ETF (TLT) is in a large trading range with big swings the last 18 months. The range lows are in the 83-84 area and the range highs are in the 101 area. TLT fell with a falling channel into January and then broke out with a surge in late February. This surge reverses the downtrend and I am marking re-evaluation support at 88. Short-term, TLT corrected after this surge with a small wedge into March. I view this as a short-term continuation pattern (bullish). A breakout at 91.6 would be bullish and signal a continuation higher. The middle window shows the price-relative (TLT/RSP Ratio) rising sharply since mid February as TLT starts to outperform RSP. Safe-haven bonds are outperforming riskier stocks (risk off).
Bitcoin Remains with Double Top and Downtrend
The Bitcoin ETF (IBIT) remains in a downtrend with a confirmed Double Top. The ETF formed two highs in the 62 area (pink arcs) and broke the intermittent low with a sharp decline in late January. There was a short bounce back to the breakout zone (blue shading), but this area turned into resistance as IBIT fell to the 45 area. The blue dashed lines define the downtrend with resistance marked at 52. A breakout here would reverse the current downtrend and also negate the Double Top break. The 61.8% retracement and prior resistance levels mark a Bullish Setup Zone in the 42.5 area. This is an area to watch for firming should IBIT fall further.
Send feedback to support(at)trendinvestorpro.com or use the contact form. [2]