The next report will be on Wednesday, March 12th.
Report Headlines
- SPY Breaks Support and 200-day
- QQQ Breaks Support and 200-day SMA
- RSP Breaks 200-day, But Not January Low
- XLK Breaks Down and becomes Oversold
- AIQ Plunges to Bullish Setup Zone
- CIBR Hits Bullish Setup Zone
- XLU Holds Above January Low
- ITA Corrects within Leading Uptrend
- KIE Maintains Upswing and Relative Strength
- AMLP Corrects and becomes Oversold
- IYZ Pulls Back after New High
- IHI Plunges 5% in Six Days
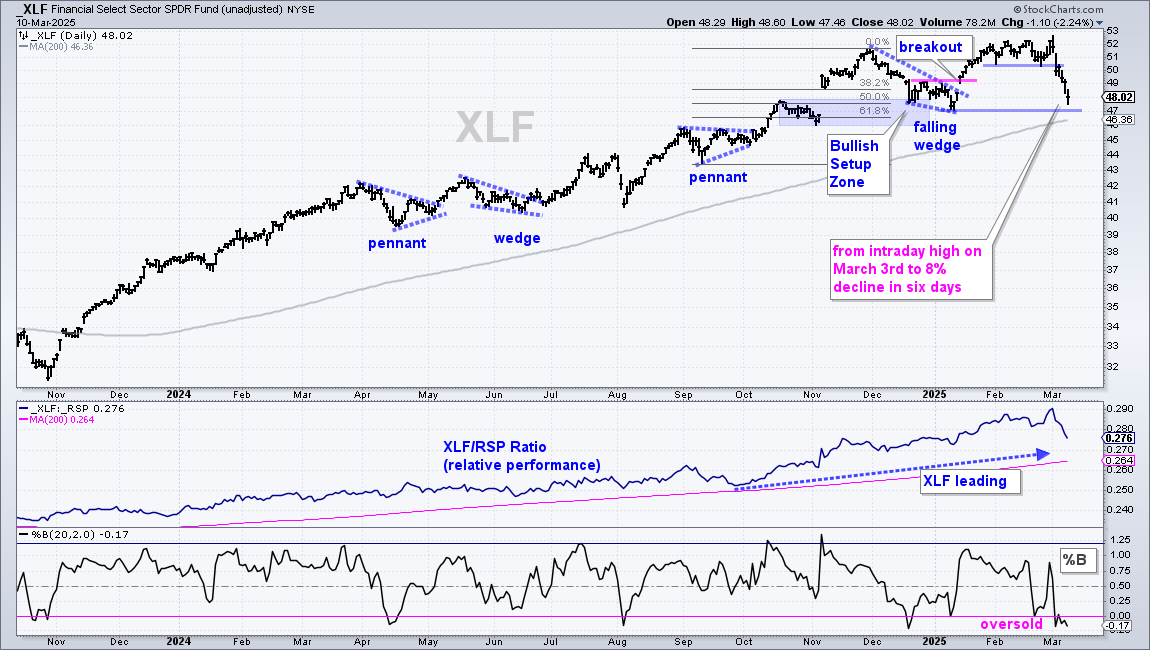
- Finance SPDR Plunges 8% in Six Days
Stocks were broadsided the last three weeks with almost all equity ETFs losing ground. High-beta names are leading lower with the ARK ETFs (ARKK, ARKF, ARKG) down over 25%. Tech-related ETFs are right behind with declines ranging from 11.43% for Cybersecurity (CIBR) to 19.76% for Robotics AI (ARTY). Only four equity ETFs in my trading universe are showings gains the last 15 trading days (Healthcare (XLV), Clean Energy (ICLN), Insurance (KIE), REITs (IYR)). Selling pressure expanded significantly in March and the breadth indicators are close to a bear market signal.
Here’s what we know:
- More than 50% of S&P 500, Nasdaq 100 and S&P 1500 stocks are trading below their 200 and 150 days SMAs (long-term downtrends). This makes difficult to pick winners among stocks and equity ETFs.
- SPY and QQQ broke support and their 200-day SMAs. Negative outcomes are more likely than positive outcomes when SPY is below its 200-day SMA. Large-caps are no longer holding up as weakness expands into other groups.
- Selling pressure expanded in March as the leaders were hit. CIBR, AIQ, XLF, KIE, XLC, IHI, AMLP, IYZ and ITA fell between 2.7 and 8 percent the last six days. Correlations rise when SPY and QQQ lead lower. This means there are relatively few places to hide.
- Junk and BBB yields spreads hit their highest levels since October. Stress levels are rising in the credit markets and this is negative for stocks.
Here’s what we do not know:
- The stock market is in correction mode at best – or on the cusp of a bear market at worst. Either way, we do not know how long or how far this decline will extend. This is classic Dow Theory. Once a signal triggers, we do not know how long it will last and how far prices will extend. The signal will remain in place until it is proven otherwise with a counter signal. It could be weeks or months.
This report shows the classic website layout: headline, written analysis and chart linked to StockCharts. Even though the PDF format saved time, it was less than ideal because chart width was limited and the text under the chart was too small. This website layout allows for a wider chart and decent font size, which makes it easier to see chart details and read the analysis. If interested, I created a PDF with the charts in my ETF ChartList (see below).
SPY Breaks Support and 200-day
SPY broke below its 200-day SMA for the first time since late October 2023. The ETF also broke support at 570 to confirm a Double Top. There are two highs in the 610 area and now a lower low with the break below the January low. These breaks are bearish and put SPY in a downtrend. Also note that SPY broke the lower Bollinger Band (125,1), which is not shown on this chart. Anyway you slice it, SPY reversed its long-term uptrend with a sharp decline into March.
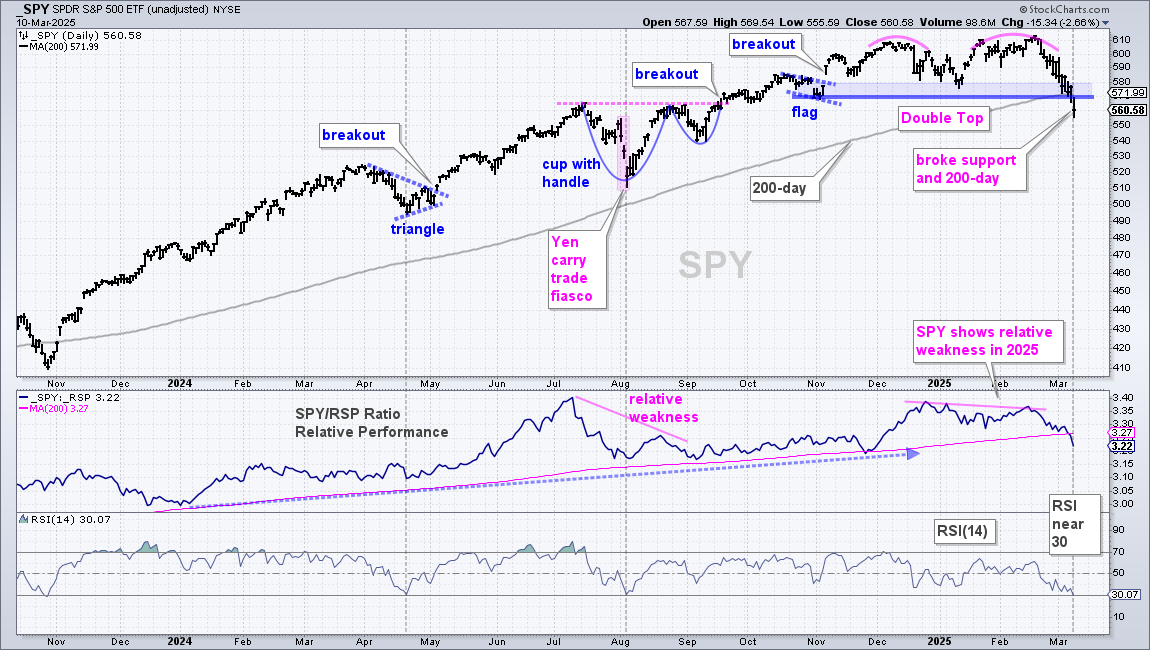
The only positive is that SPY is short-term oversold with RSI(14) at 30. This is the third time in two years that RSI reached the 30 area (gray lines). The others were April and August 2024. This oversold condition increases the odds for a bounce. I would also note that the 200-day SMA is often a battle zone and downside breaks usually occur with higher volatility. This means we could see more than one cross in the coming days/weeks. For example, SPY broke its 200-day on 21-January-2022 and then crossed this key moving average at least six more times from late January to mid April 2022.
QQQ Breaks Support and 200-day SMA
QQQ went from a 52-wk high on February 19th to a support break and move below the 200-day SMA on March 10th. The decline since mid February compares to the sharp fall from early July to early August 2024. Also note that QQQ broke the lower Bollinger Band (125,1), which is not shown. Basically, QQQ started an uptrend with the breakout surge in November 2023 and reversed this 15 month uptrend with the recent decline.
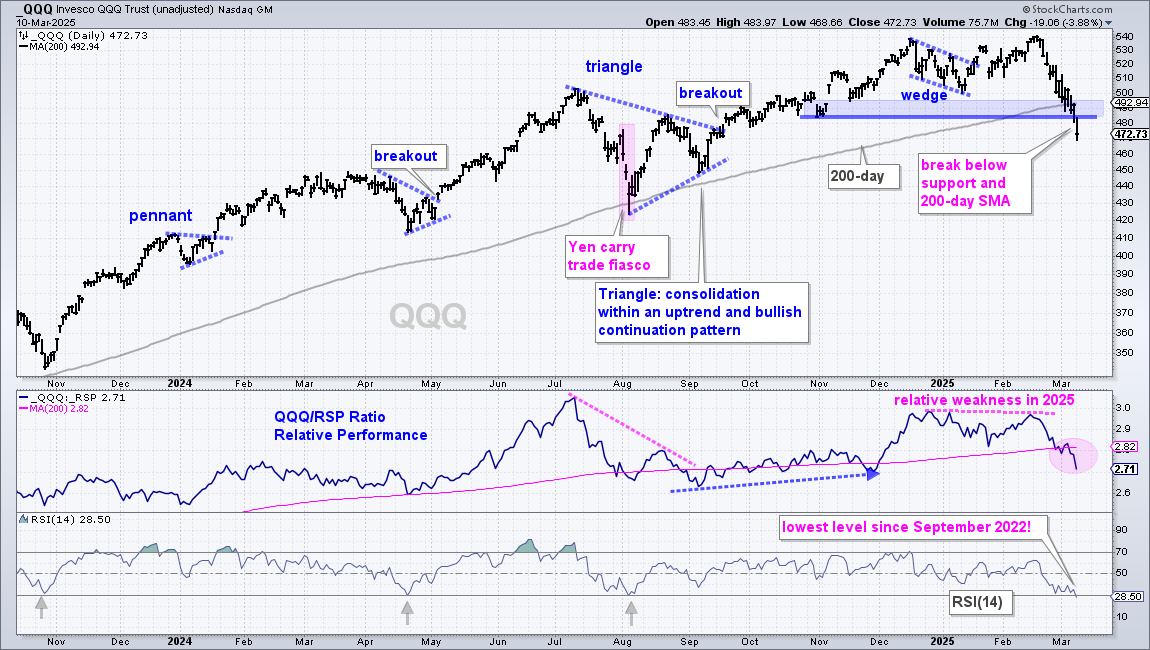
In RSI terms, the current decline is even steeper because RSI(14) moved below 30 for the first time since September 2022. The gray arrows show RSI bouncing off the 30 area in October 2023, April 2024 and August 2024. This time RSI dipped below 30, which reflects strong downside momentum, and enough to reverse an uptrend. Short-term, QQQ is quite oversold and ripe for an oversold bounce. The 500 area turns first resistance to watch should we get an oversold bounce.
RSP Breaks 200-day, But has yet to Break January Low
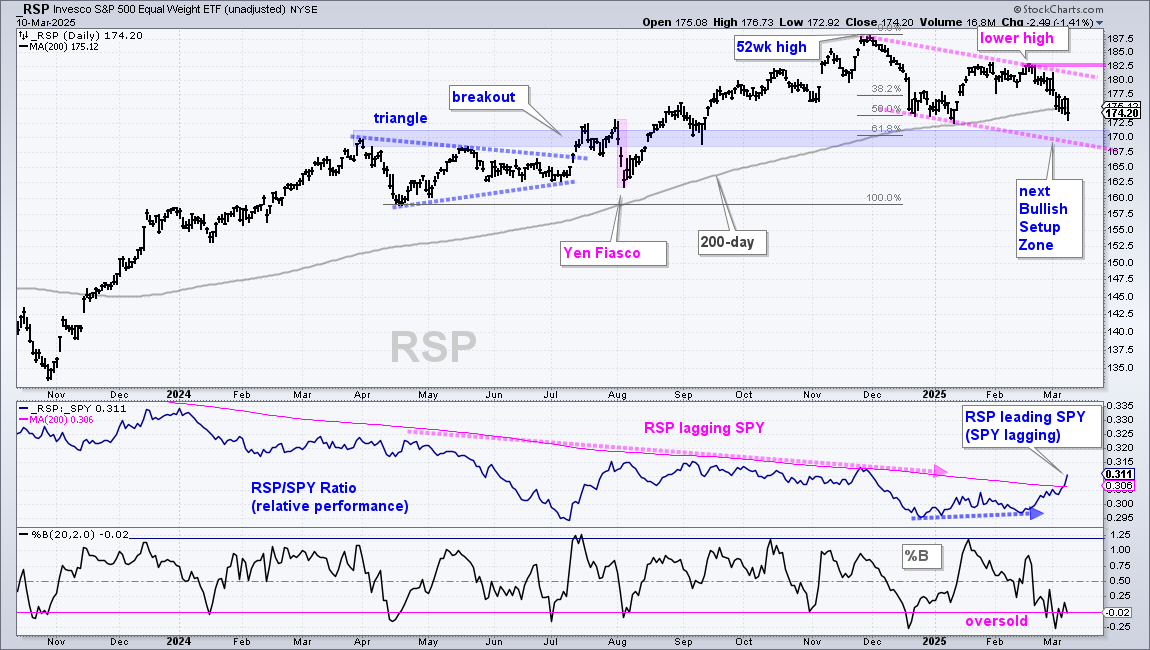
The S&P 500 EW ETF (RSP) is holding up better than SPY and QQQ because it has yet to break its January low. Even though RSP broke the 200-day SMA, I could still make the argument for a correction on this chart. The pink dashed lines mark the lower high from December to February and a possible falling channel with resistance set at 183. The lower line extends to the 168 area, where we also find the 61.8% retracement and broken resistance zone (blue shading). These combine to mark the next Bullish Setup Zone for RSP. Note that small-caps (IJR, IWM) and mid-caps (MDY) are off the radar because they are in long-term downtrends since late February and show relative weakness.
XLK Breaks Down and becomes Oversold
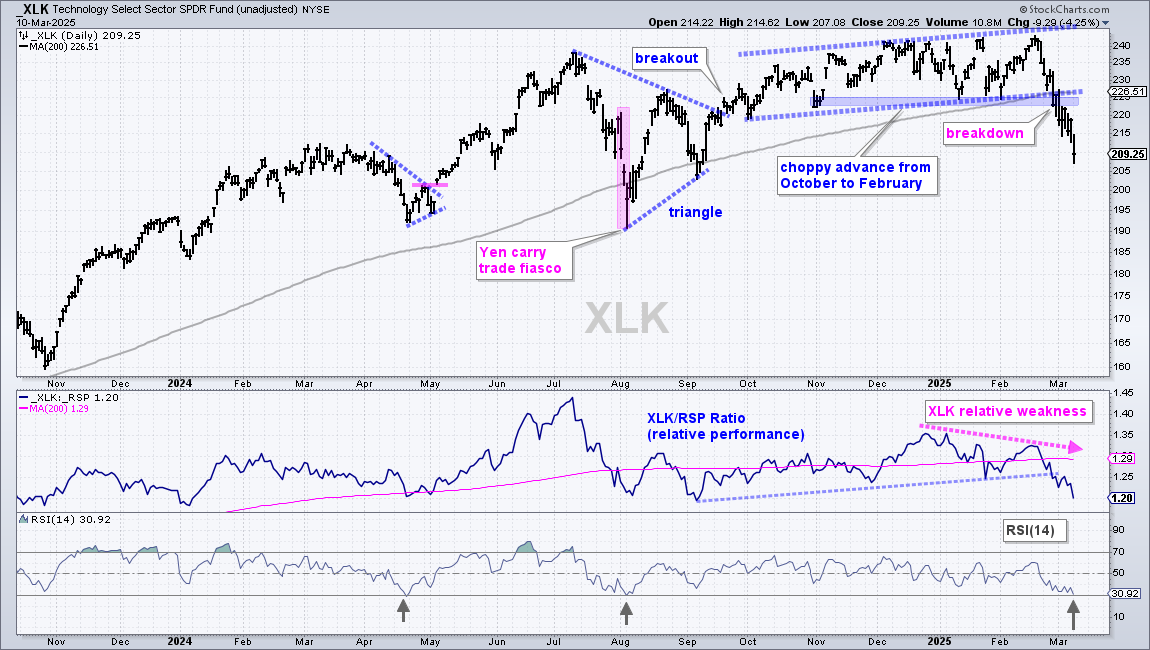
The Technology SPDR (XLK) broke the rising channel line, 200-day SMA and January low with a decline into March. This decline reverses and uptrend that was in place since the mid September breakout. XLK also shows relative weakness as the XLK/RSP ratio formed a lower high in February and broke its January low. Short-term, XLK is becoming oversold as RSI(14) fell to the 30 area (30.95). This is the third time RSI fell to the 30 area in the last two years (gray arrows). Should we get an oversold bounce, I would mark first resistance in the 223-225 area (broken support turns resistance).
AIQ Plunges to Bullish Setup Zone
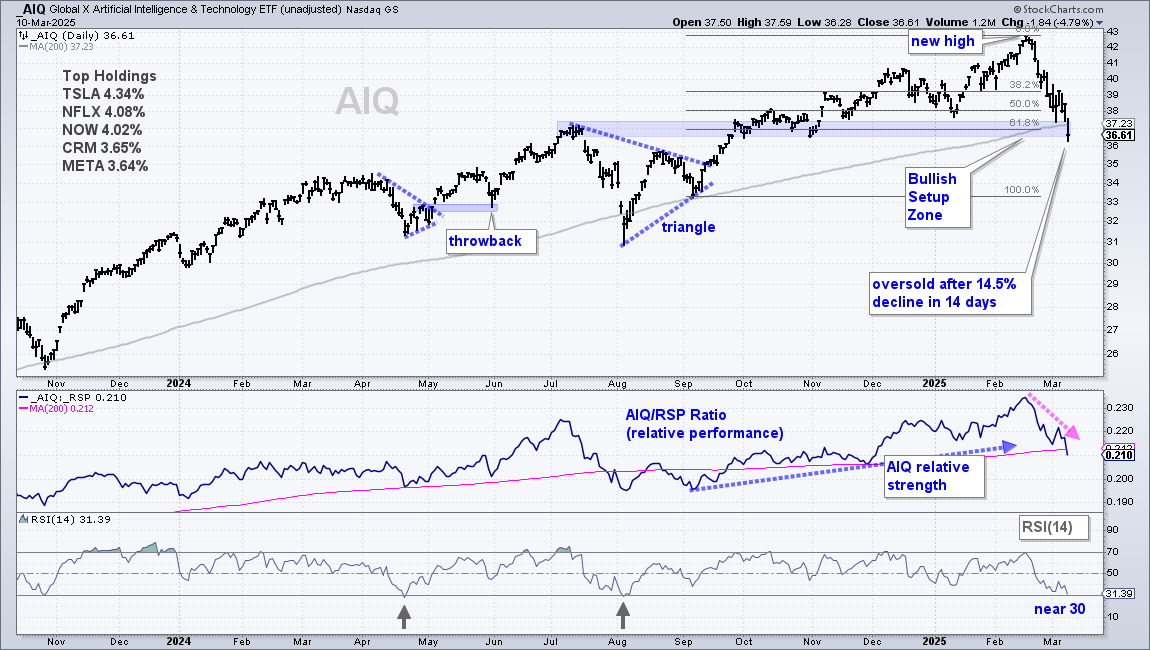
Like all tech-related ETFs, the Global AI & Tech ETF (AIQ) fell sharply the last three weeks. AIQ is also one that went from a 52-week high to a close below the 200-day SMA in three weeks. The ETF also broke the January low. Even so, I see a Bullish Setup Zone in the 36.5 area (blue shading). Here we have broken resistance, the 200-day SMA and the 61.8% retracement. Also note that AIQ is almost oversold with RSI(14) at 31.39, its lowest level since August. RSI dipped below 30 in August and AIQ also closed below the 200-day SMA. This oversold condition gave way to a sharp bounce and a triangle ultimately formed. Even though RSI is not technically oversold, price is clearly oversold after a 15% decline in three weeks and ripe for a bounce. AIQ also sports the second best looking chart among the tech ETFs (CIBR is the best).
CIBR Hits Bullish Setup Zone
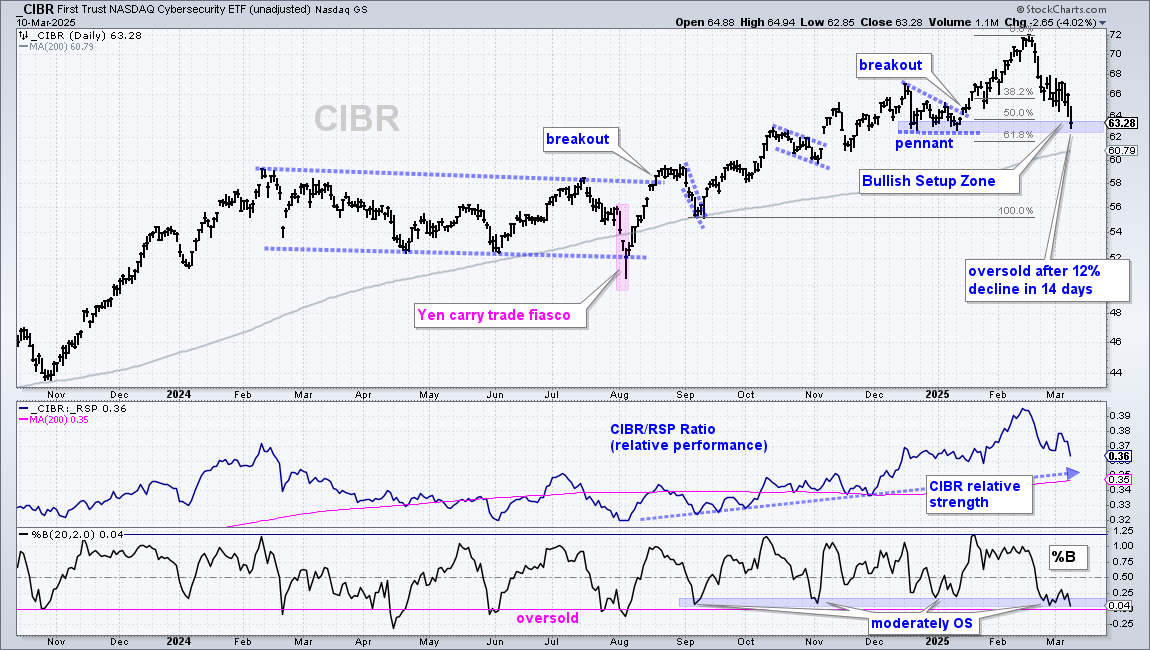
The Cybersecurity ETF (CIBR) is the strongest of the tech-related ETFs. It remains above its 200-day SMA and has yet to break the January low. CIBR is also trading in a Bullish Setup Zone marked by the December-January lows (support) and the 50-61.8 percent retracement zone. CIBR is also moderately oversold with Percent-B (20,2) just above zero. This means the close is just above the lower Bollinger Band. A dip below zero means the close is below the lower Bollinger Band. Notice the Percent-B bounced off the moderately oversold zone in September, November and December.
XLU Holds Above January Low
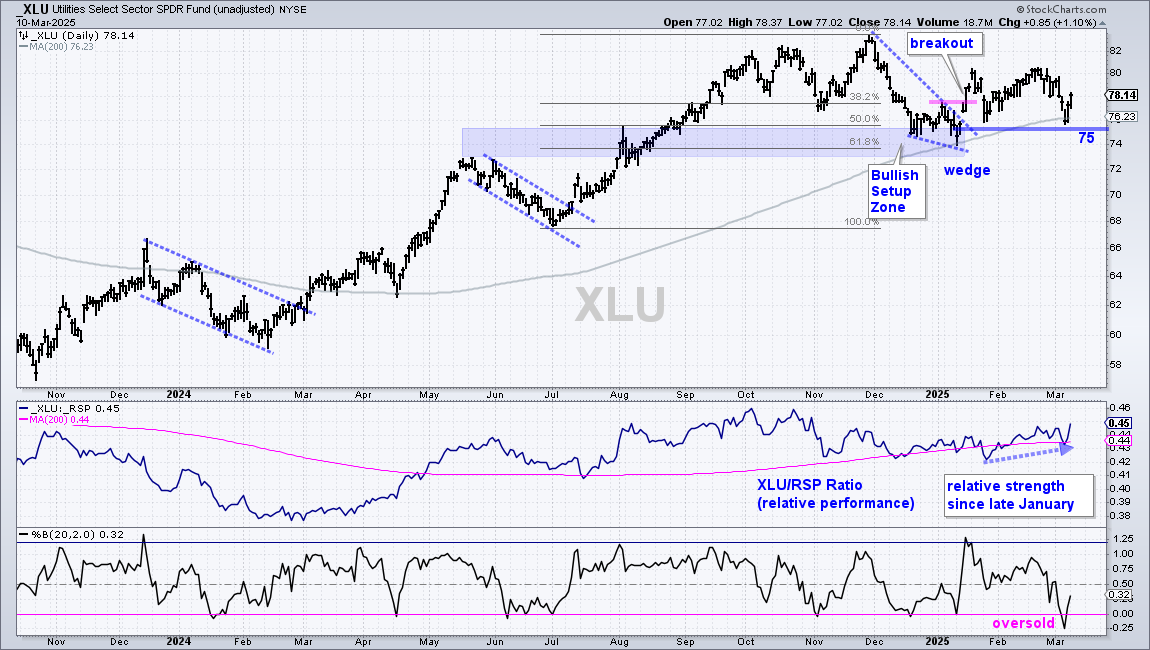
The leaders were hit in March as selling pressure expanded within the stock market. ETFs that remain above their January lows and 200-day SMAs are still in uptrends and showing relative strength. There are not that many because most ETFs broke their January lows. The next charts cover these leaders. First, the Utilities SPDR (XLU) is holding up better than the broader market and even holding its wedge breakout. Note that I originally marked re-evaluation support at 76 and XLU closed below this level on Thursday, and the 200-day SMA. It rebounded the next two days and this affirms support in the 75-77 area. Overall, XLU is back above its 200-day SMA and above the January low. It is holding up better than ETFs that broke the January low. Thus, I think the cup is still half full for XLU and will set the re-evaluation level at 75.
ITA Corrects within Leading Uptrend
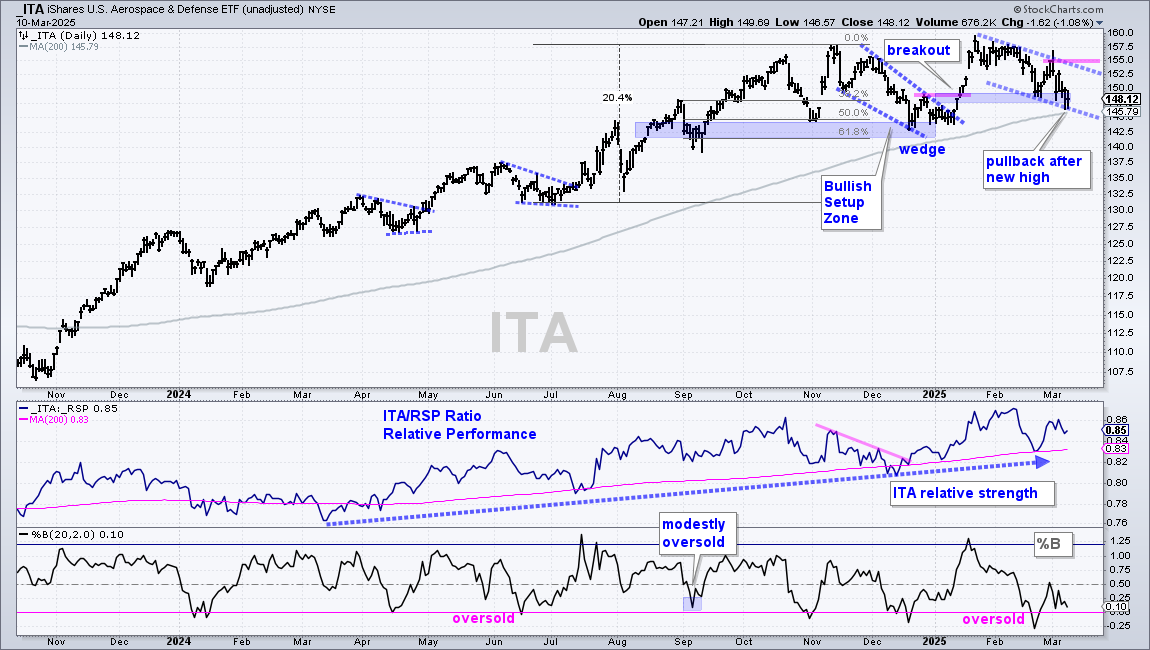
The Aerospace & Defense ETF (ITA) hit a new high in mid January and fell to the 200-day SMA in March. ITA is still above the 200-day SMA and the January low. This means it is holding up better than most equity ETFs. Overall, I view the decline from mid January to mid March as a correction within a bigger uptrend, which makes it a bullish continuation pattern. ITA is also trading near support from the January breakout zone (blue shading). This is an area to watch for firming and a bounce. A breakout at 155 would reverse this short-term downswing and open the door to new highs.
KIE Maintains Upswing and Relative Strength
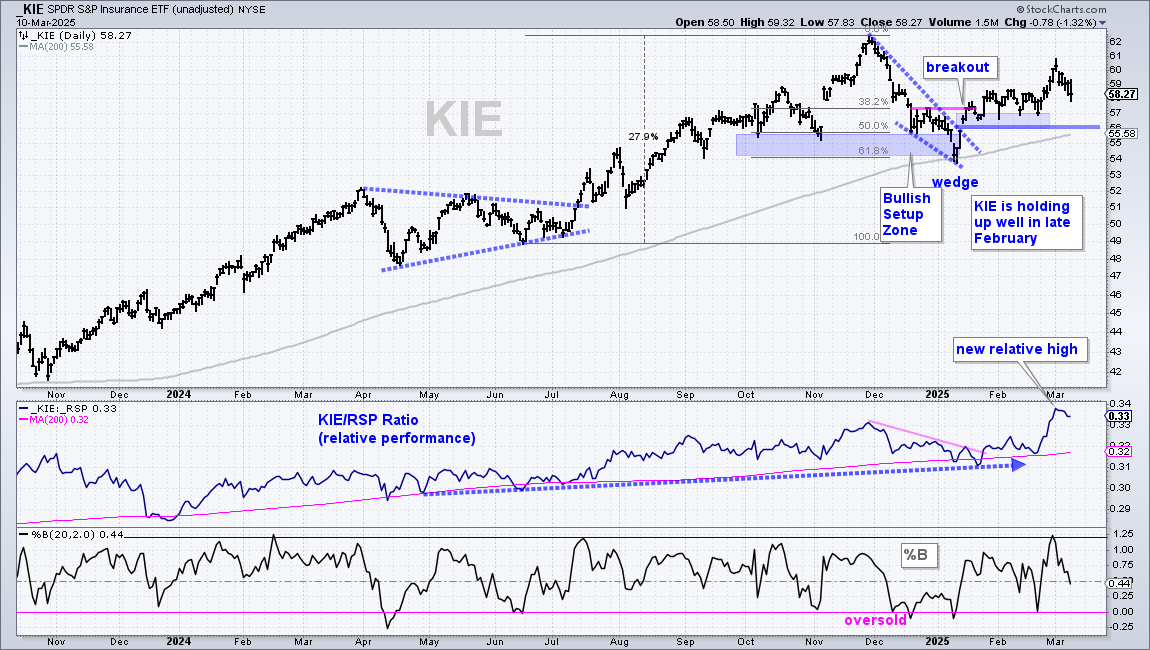
The Insurance ETF (KIE) remains with a wedge breakout and upswing since this breakout. The breakout zone in the 56-57 area turned into support and held throughout February. KIE moved higher in late February, even when the broader market fell. This affirmed support and pushed the price-relative (KIE/RSP ratio) to a new high. KIE is in a leading uptrend and still showing relative strength. I am marking re-evaluation support at 56.
AMLP Corrects within Leading Uptrend and becomes Oversold
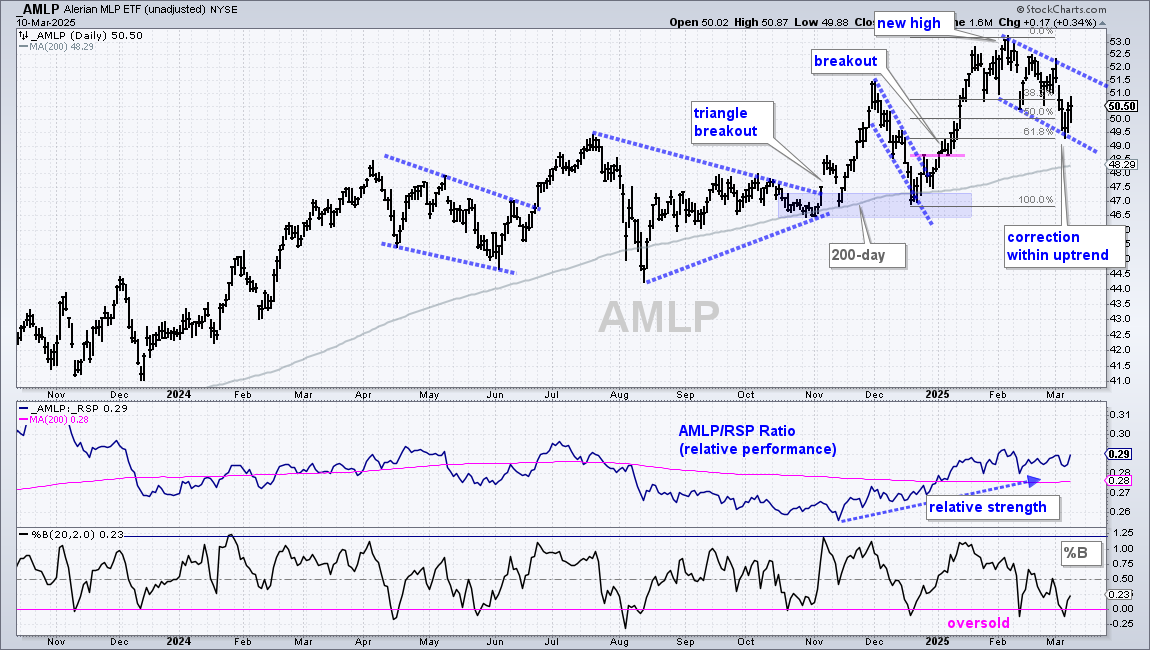
The MLP ETF (AMLP) remains in a leading uptrend with a new high in February and correction into March. AMLP surged from January to early February, hit new highs and then corrected with a falling flag/channel. This pullback retraced around 61.8 percent of the prior advance and AMLP became oversold last week as %B dipped below zero. Thus, we have a bullish setup on this chart: pullback within uptrend, bullish continuation pattern and oversold condition. A flag/channel breakout would reverse the downswing and signal a continuation higher.
IYZ Pulls Back after New High
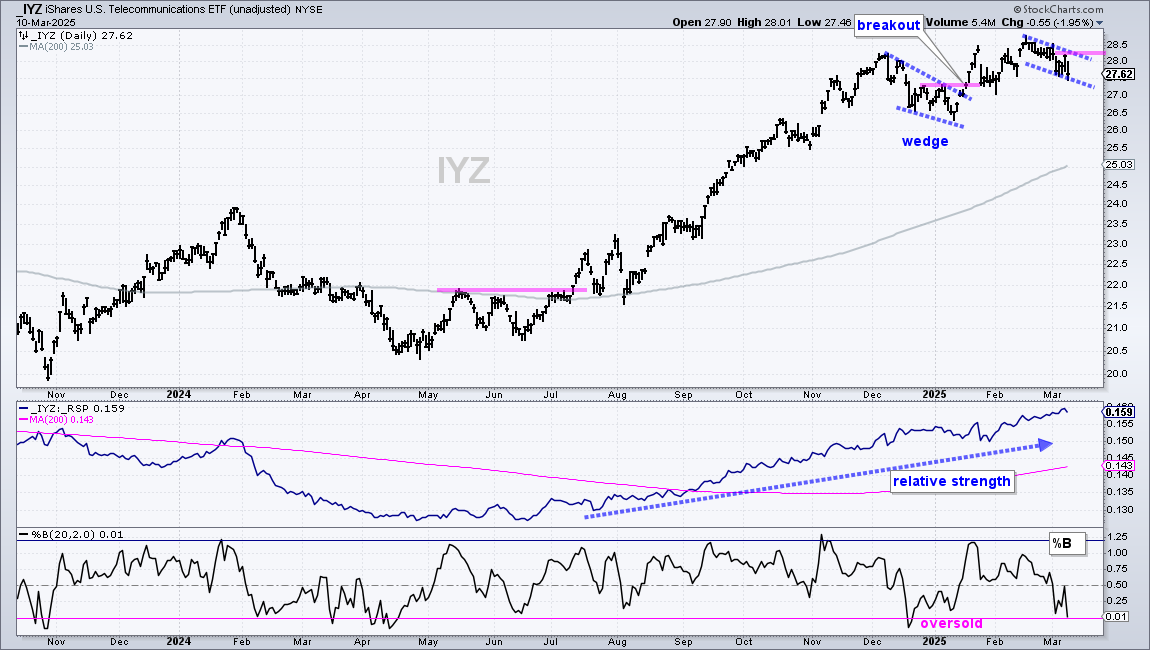
The Telecom ETF (IYZ) remains in a leading uptrend with a new high in February. Short-term, the ETF pulled back as the market weakened into March. IYZ is still leading because it remains well above its January low and above the rising 200-day SMA. A falling flag could form as Percent-B (20,2) hits the zero line to become oversold. A breakout would signal a continuation higher. The middle window shows the price-relative hitting a new high in early March as IYZ continues showing relative strength.
IHI Plunges 5% in Six Days
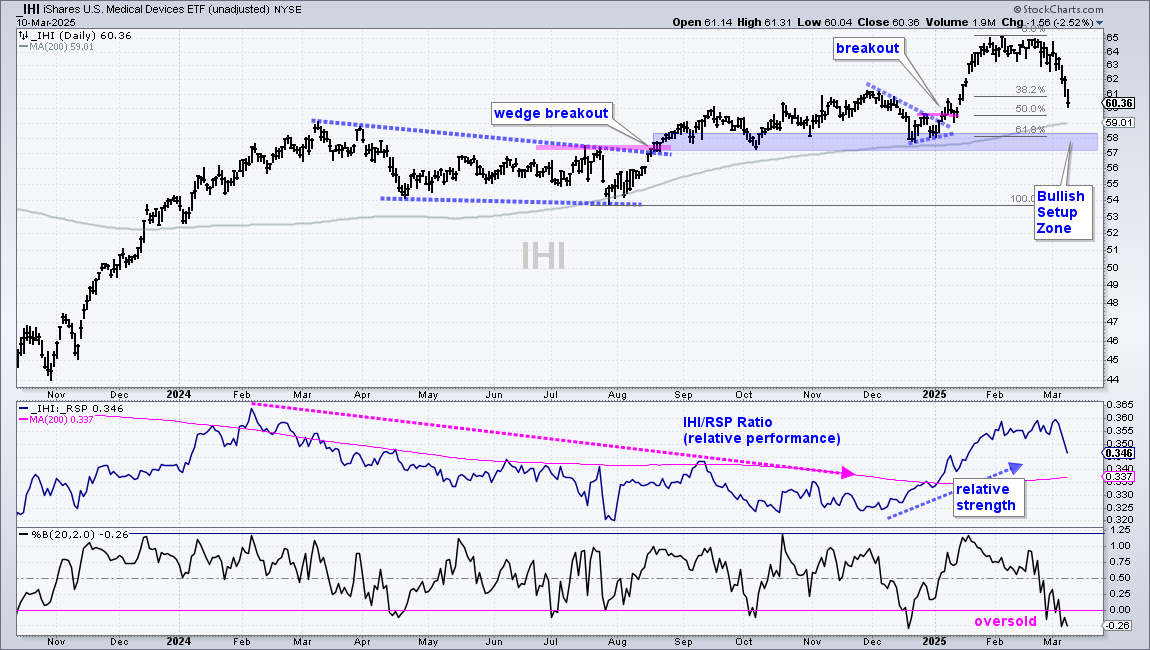
The Medical Devices ETF (IHI) is also a long-term leader and in a long-term uptrend. However, it is not immune to broad market weakness as it plunged 5% the last six days. Intuitive Surgical (ISRG) accounts for 14.3% of the ETF and the stock fell 15.8% in March. Note that the top three stocks account for around 45% of the ETF (ABT, ISRG, BSX), which makes it very top heavy. The long-term trend is still up and I view this decline as the start of a corrective period. The next Bullish Setup Zone is in the 57-58 area (blue shading). Here we have broken resistance turning support, support from the October-December lows and the 61.8% retracement.
Finance SPDR Plunges 8% in Six Days
The Finance SPDR (XLF) was leading the market at the end of February as it traded near a 52-wk high, and then fell 8% in March. Even though XLF is above its 200-day SMA and has yet to break its January low, I am no longer interested in this sector because the Regional Bank ETF (KRE) and Bank SPDR (KBE) broke their January lows, and 200-day SMAs. Banks are in long-term downtrends and leading lower. They also form a big part of the Finance sector.
Send feedback to support(at)trendinvestorpro.com or use the contact form. [2]