The next report will be on Wednesday, March 4th.
Stocks were hit hard the last two weeks with small-caps and tech stocks leading the way lower. SPY is down around 4.6% from its late February high and entering the garden-variety correction range (5-8 percent). Believe it or not, five to eight percent pullbacks are not that uncommon – but they feel a lot worse than they look. Also keep in mind that SPY was up 20% from the August low to the February high. I will consider current weakness as a correction within a bigger uptrend as long as SPY holds above the 200-day SMA and the long-term breadth indicators remain bullish.
There are, however, concerns with the state of the stock market. The Home Construction ETF (ITB) is in a strong downtrend with a 52-week low on Monday. The Semiconductor ETF (SMH) broke support with a sharp decline and shows relative weakness for over six months. Despite weakness in these two cyclical groups, the EW Consumer Discretionary ETF (RSPD) and the Regional Bank SPDR (KRE) remain above their January lows and have yet to roll over. In addition, yield spreads have yet to break out and show stress in the credit markets. These are the areas to watch now.
The decline over the last two weeks is the sharpest since mid July, which is when SPY fell 5% in seven days. This decline continued into early August as the Yen-carry trade fiasco spooked the markets and stocks plunged. This plunge created some severe oversold conditions that led to a very sharp bounce. The chances of something similar happening are high because the news cycle remains in overdrive, and President Trump will address Congress tonight at 9PM ET.
- SPY Forms Possible Double Top as QQQ Breaks January Low
- RSP Tests Breakout Zone and Holds Up Well
- XLF Remains Near High and Shows Relative Strength
- XLI Hits Moment of truth as it Tests Breakout Zone
- XLC Pulls Back after New High, but Remains a Leader
- XLU Holds Wedge Breakout and Shows Relative Strength
- MAGS Breaks January Low, but Remains Above 200-day SMA
- AIQ Remains above 200-day SMA and January Low
- XLK and ARTY Breaks January Lows and 200-day SMAs
- BOTZ Hits Bullish Setup Zone after Break Down
- CLOU, SKYY and IGV Breaks January Lows, but above 200-day SMAs
- CIBR Holds Above January Low and Rising 200-day
- SMH and SOXX Break Triangle Support
- IHI Consolidates Near High and Shows Relative Strength
- IYZ Consolidates Near Highs
- GLD Pulls Back after New High
- IBIT Breaks Double Top Support
Leading Uptrends and Relative Strength: Finance SPDR (XLF), Communication Services SPDR (XLC), Utilities SPDR (XLU), Cybersecurity ETF (CIBR), Global AI & Tech ETF (AIQ), Insurance ETF (KIE), Aerospace & Defense ETF (ITA), Medical Devices ETF (IHI), MLP ETF (AMLP), Telecom ETF (IYZ), Gold SPDR (GLD)
If viewing the PDF in a browser, right click on charts to open in a new tab or window.
Use CRTL and the Plus or Minus keys (+ -) to zoom. 125% works best for me.
Send feedback to support(at)trendinvestorpro.com or use the contact form. [2]
Working with PDF Files
PDF reports based on ChartLists from StockCharts.com offer several advantages. First, each chart is linked to a live SharpChart, allowing readers to see open it, see the most recent price data and view the chart settings. Second, publishing reports as PDF files is much more efficient because it eliminates the need to copy/paste each chart and its corresponding analysis to a webpage. This allows more time for updates and analysis. Third, these comprehensive PDF reports allow users to see my ETF ChartList, Market Regime ChartList and Stock Setup ChartList.
There are three ways to open a PDF file. First, just click on the file link and it should automatically open in your browser. Most browsers can read PDF files without a plugin. Second, you can install the Adobe Acrobat plugin for your browser (Chrome, Firefox, Edge, Safari). I am running a Windows PC and the Acrobat plugin works great using Edge. This my preferred option. Third, you can download the PDF file to your computer and open it in Adobe Acrobat or your default app for PDF files.
The charts in this PDF report are linked to a SharpChart. If viewing through a browser or the Acrobat plugin, right click on the image to open the SharpChart in a new tab or window. If viewing in Adobe Acrobat outside of your browser, click on image to open the SharpChart in browser.
Users can easily control the zoom using CRTL + and CRLT – (plus/minus keys). Press and hold the CRTL key and then press the + key to zoom in (increase the magnification). Press and hold the CRTL key and press the – key to zoom out. 125% zoom works best for me. See comments section below for links.
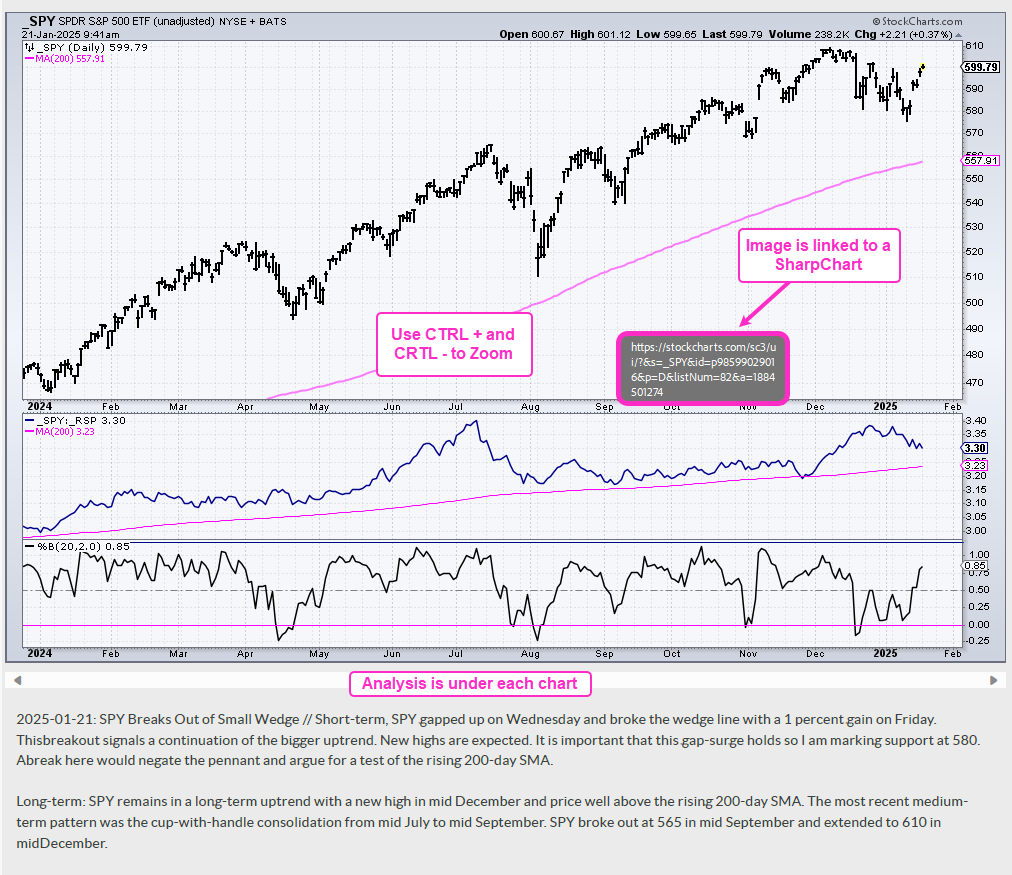
The example below is a screen shot from the PDF.
Send feedback to support(at)trendinvestorpro.com or use the contact form. [2]