The S&P 500 is at a moment of truth and the direction it takes will have ramifications throughout the stock market. Today’s video will review the indicators in the Index Breadth Model, show that the large-cap Bullish Percent Indexes are holding up better and cover the rising High-Low Lines. I will then turn to the QQQ effect on SPY and look at recent signals in SPY. The StochClose crossed above 60 as SPY broke out of a flag this week, but this week’s range was the narrowest since late February. We will finish with the ETF ChartBook by covering a slew of flag breakouts.
Top ETFs Ranked by StochClose
The image below comes from the StochClose rankings tables. You can read about the indicator here [1] and see the complete tables in the link above.
The universe of ETFs in uptrends expanded this week with StochClose moving above 60 for the S&P 500 SPDR (SPY), Consumer Discretionary SPDR (XLY), Mobile Payments ETF (IPAY), Home Construction ETF (ITB) and Retail SPDR (XRT). Bond, gold, tech and healthcare ETFs still dominate the top 20.
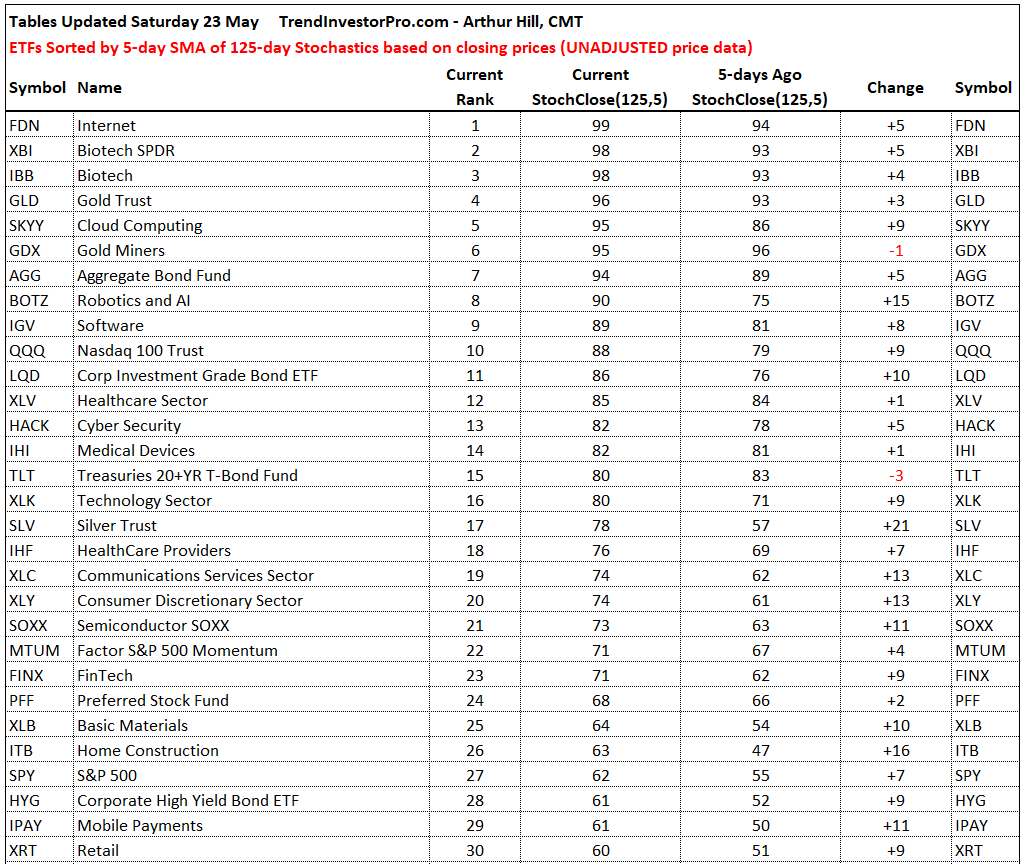
ETFs related to finance, industrials and energy still dominate the bottom of the list. In addition, the StochClose is at 40 or lower for the Finance SPDR (XLF), Industrials SPDR (XLI), Regional Bank ETF (KRE), S&P SmallCap 600 SPDR (IJR), Energy SPDR (XLE) and Aerospace & Defense ETF (XAR).
StochClose Chart for SPY
The StochClose for SPY moved above 60 for the first time since February 28th. This signal triggered just below the prior bearish signal and is similar to the signal seen in early February 2019. Notice how the StochClose triggered bearish on October 23rd and then bullish on February 4th. This is the nature of trend-following and momentum. Signals trigger after a significant move. There will be whipsaws, but the idea is that, over time, a few good trends will pay for the whipsaws (bad signals)
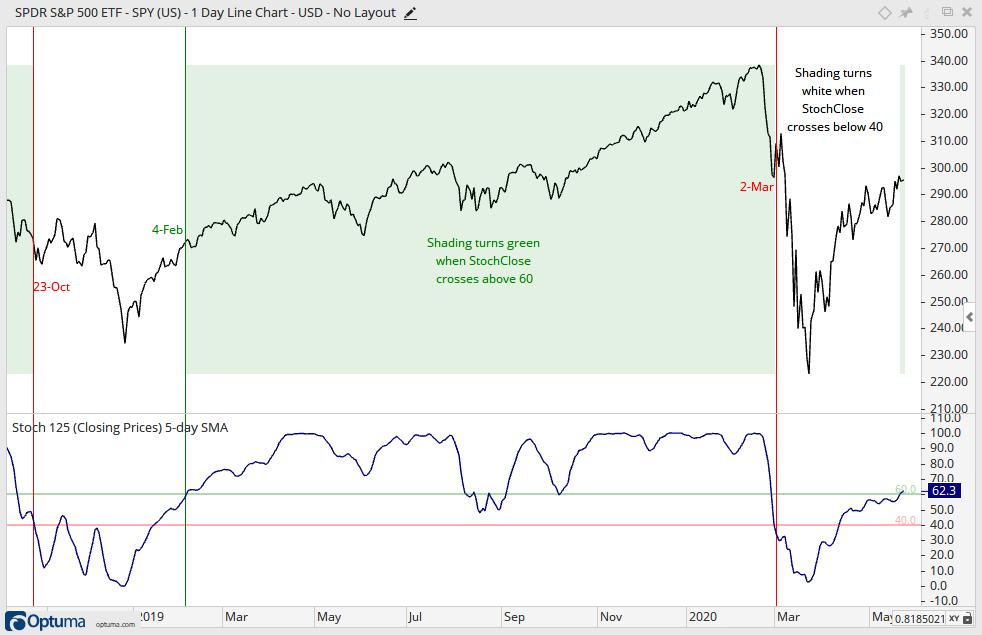
I do not know how long this signal will last, but I will note that the Index Breadth Model remains net bearish. The Index Breadth Model turned bullish on February 5th to validate the StochClose signal in 2019. As noted in commentary on Thursday and Friday, Technology, Healthcare and Communication Services are leading this charge and they account for over 50% of the S&P 500. We are still seeing pockets of weakness in other key sectors and groups.
The chart above was created using Optuma and a custom indicator (StochClose). At StockCharts, you can chart the Full Stochastic (125,5,1) for an equivalent. Note, however, that the normal Stochastic uses the INTRADAY high and low to define the range, while the StochClose uses the closing high and low to define the range.
The Premium Content Page
I created a page with Premium Content that is less time sensitive. Chart analysis, chart setups, indicator signals and ETF rankings are time sensitive and these reports get stale after a week or two. The Premium Content page contains articles to get you started using TrendInvestorPro, strategy articles, analysis considerations and long-term themes. A link can be found at the top of the main analysis page or here. [2]