Today’s video starts with the current weight of the evidence, which is bullish. We then turn to some signs of excess, which could be just noise to keep us on our toes. Most importantly, SPY is holding its triangle breakout and QQQ is on the verge of a breakout. The technicals remain bullish until they aren’t (proven otherwise). Outside of the technicals, yield spreads continue to narrow and the Fed balance sheet continues to expand. We will also look at a weak Dollar, the downtrend in Gold and the resistance challenge in TLT, as well as the charts in the ETF ChartBook.
Turkey Day Notice
Note that I will only post on Monday and Tuesday next week. I will update the video on the breadth models and present a new design for the ranking tables. The new method will expand the number of ETFs and be signal oriented (StochClose and Oversold signals). I will be off from Wednesday to Saturday next week and there will not be any updates. Hopefully, it will be an uneventful week and we can focus on the things that really matter: family, food, drink and sports!
ETF ChartNotes Saturday, 21 November 2020
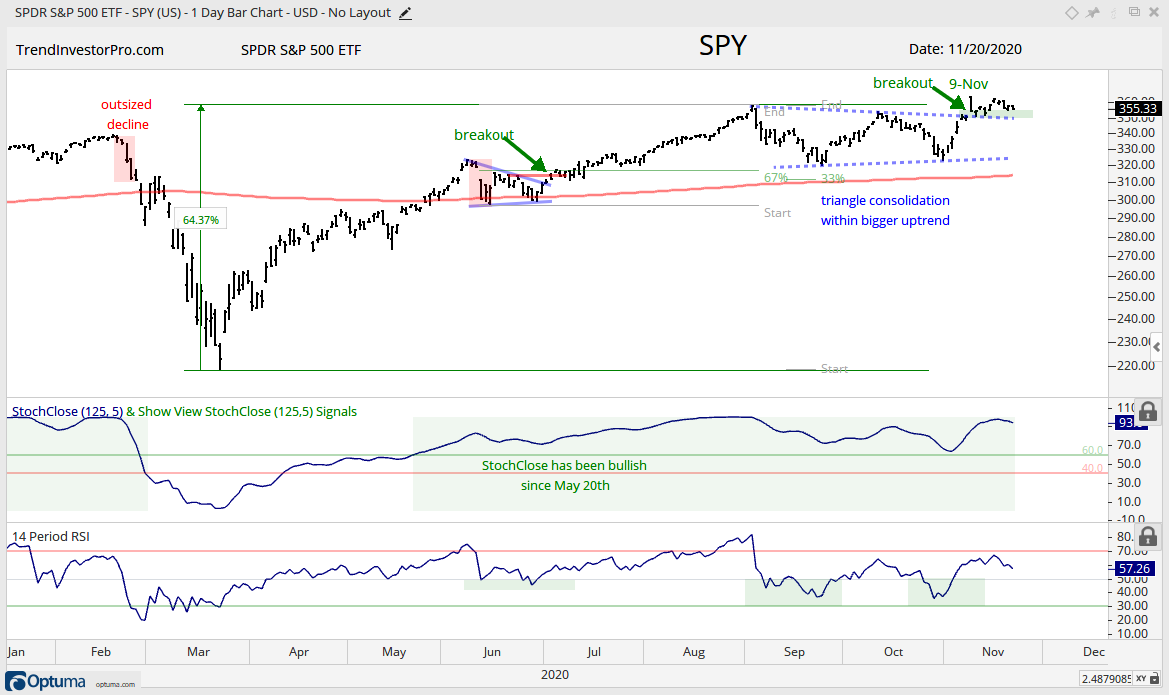
The S&P 500 SPDR (SPY) and S&P 500 EW ETF (RSP) are holding their breakouts and gaps from November 9th. Da bulls have a clear edge as long as both hold.
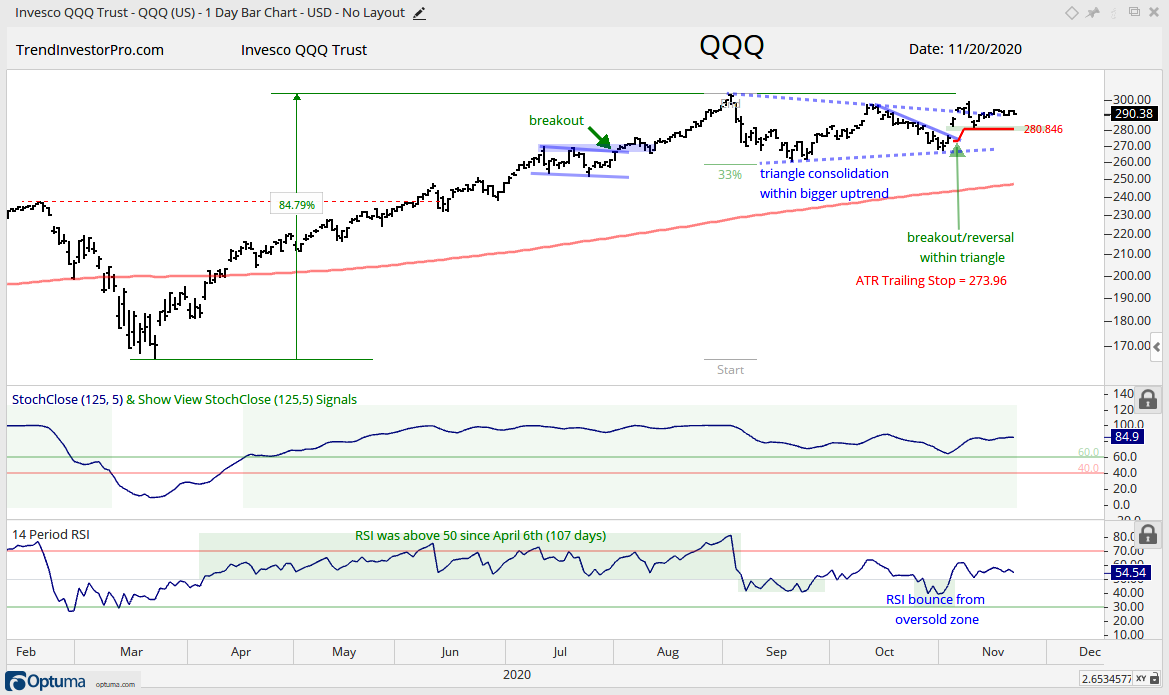
The Nasdaq 100 ETF (QQQ) and Technology SPDR (XLK) turned real quiet the last seven days with very narrow ranges. Both are trying to break out of triangle consolidations and this odds favor an upside resolution because … you know why. Both are in long-term uptrends and the weight of the market evidence is bullish. A close below the November 6th lows would signal a failed breakout and put these two back into corrective mode.
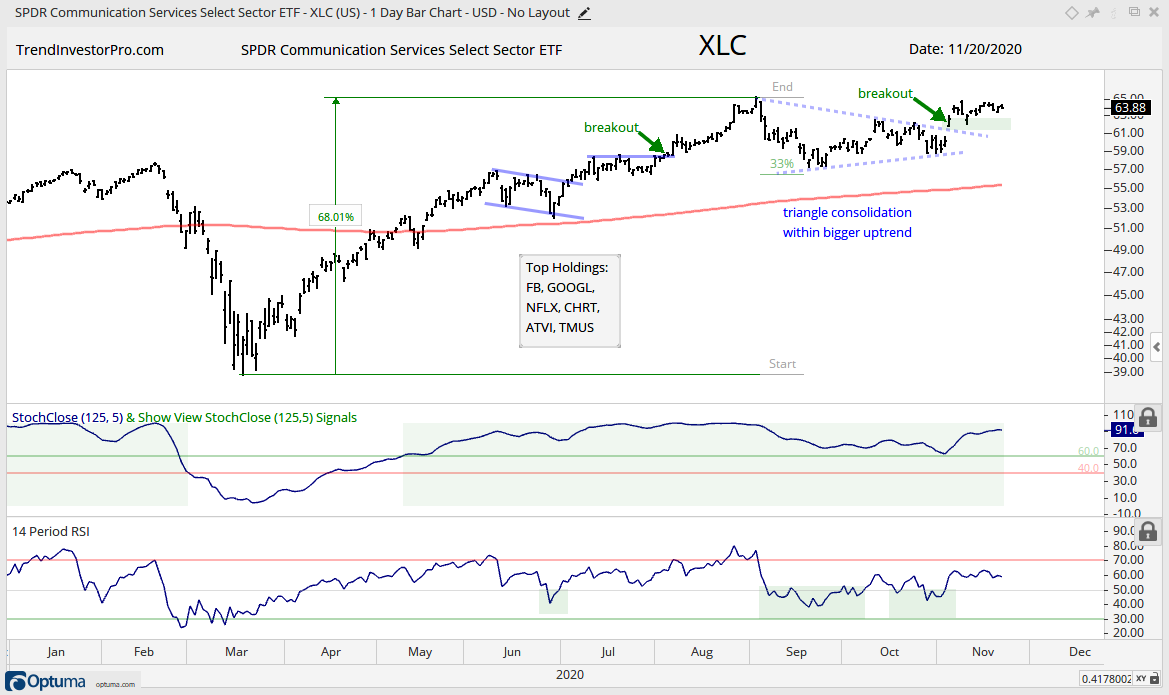
In fact, the November 6th lows are important for many tech-related ETFs, including the Communication Services SPDR (XLC). Yes, I consider this ETF more tech than anything else.
The Healthcare SPDR (XLV) and Biotech ETF (IBB) consolidated the last two weeks. XLV has a bull flag working and IBB has a pennant within a larger triangle consolidation. This is the classic pattern within the pattern. A pennant breakout would lead to a bigger triangle breakout and project a move to new highs.
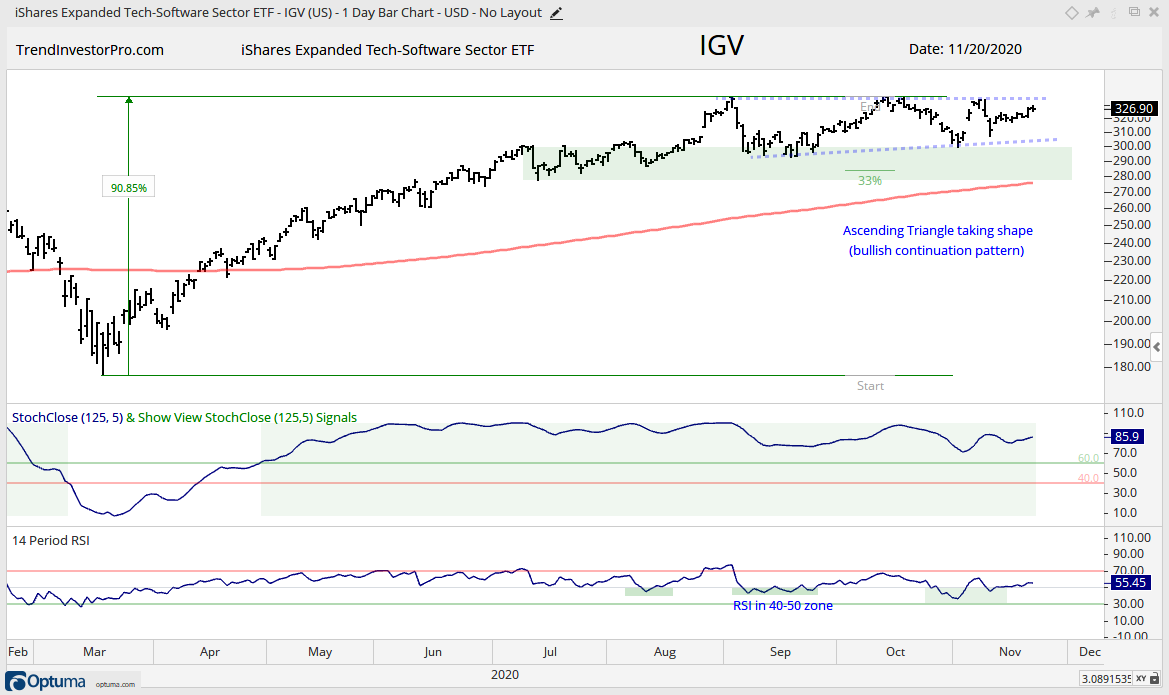
The Internet ETF (FDN) and Software ETF (IGV) have bullish Ascending Triangles working.
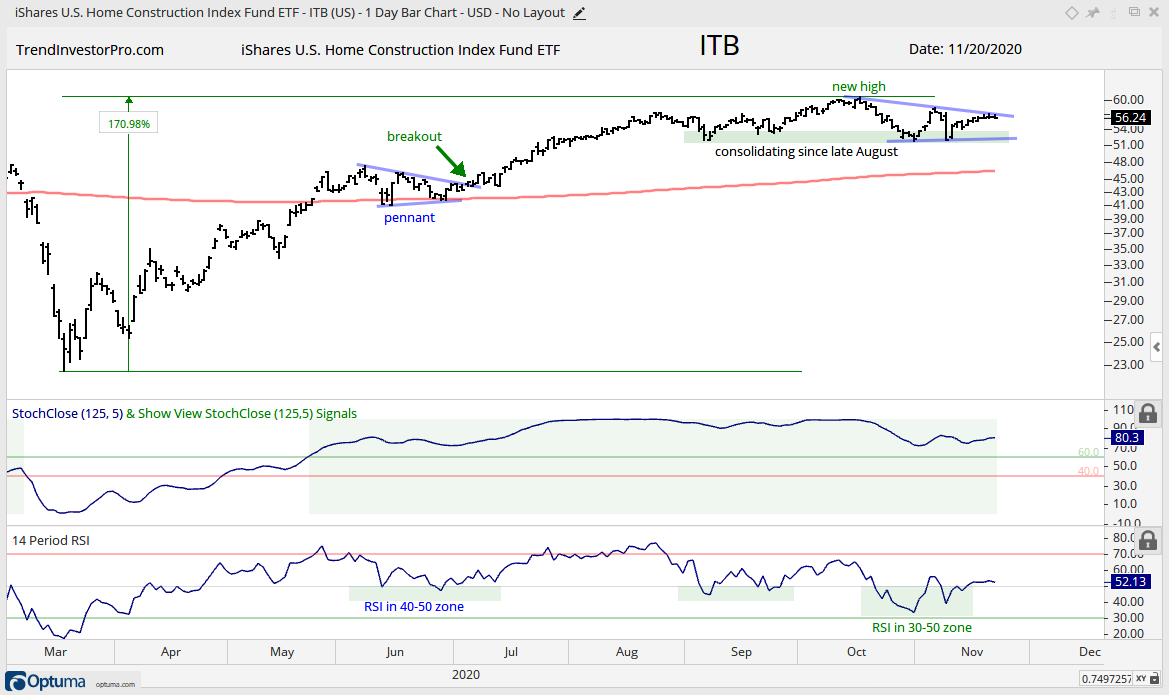
The Home Construction ETF (ITB) also turned quiet the last five days as it formed a bullish triangle within a bigger uptrend.
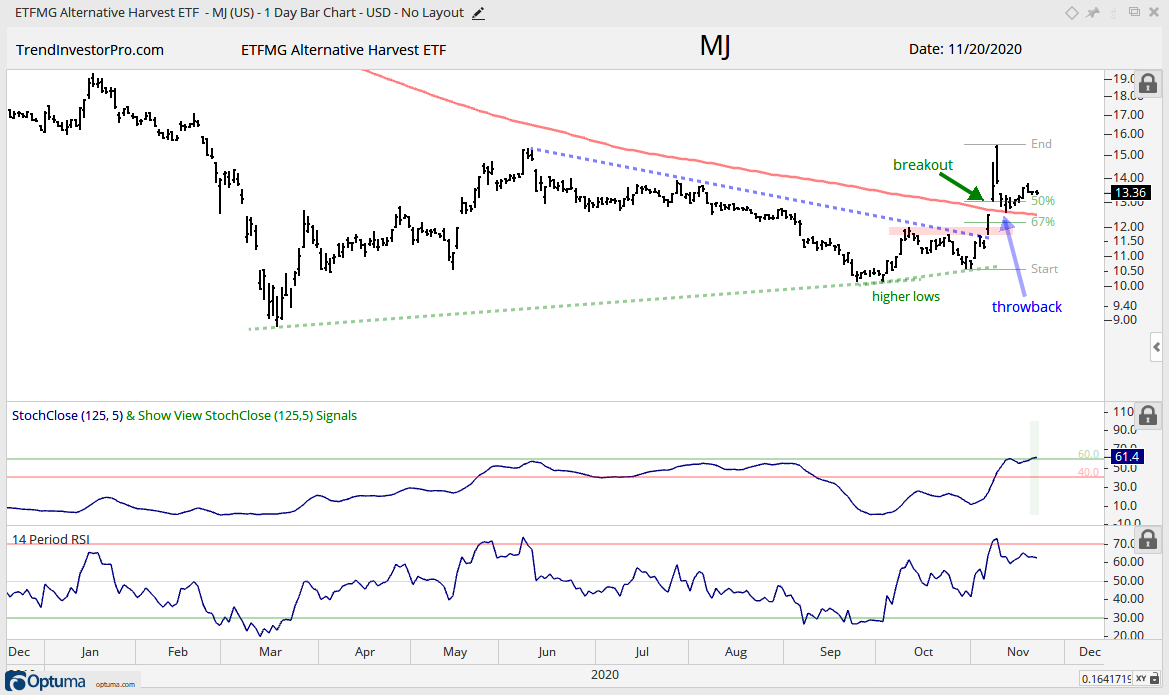
StochClose (125,5) turned bullish for the Alternative Harvest ETF (MJ) this week with a move above 60. See the StochClose series on the Premium Page for details.[1]
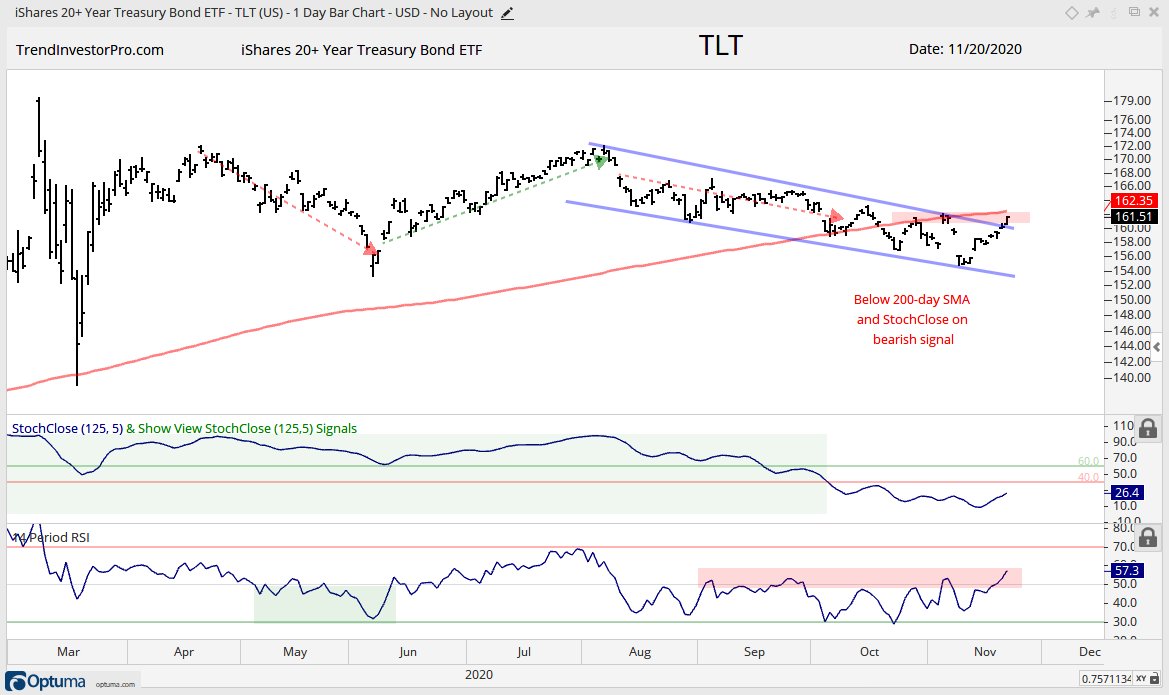
The 20+ Yr Treasury Bond ETF (TLT) came to life this week with an advance to the resistance zone from the October highs and the Aggregate Bond ETF (AGG) broke out. The Corporate Bond ETF (LQD) led the way with a breakout on November 4th and higher high this week.
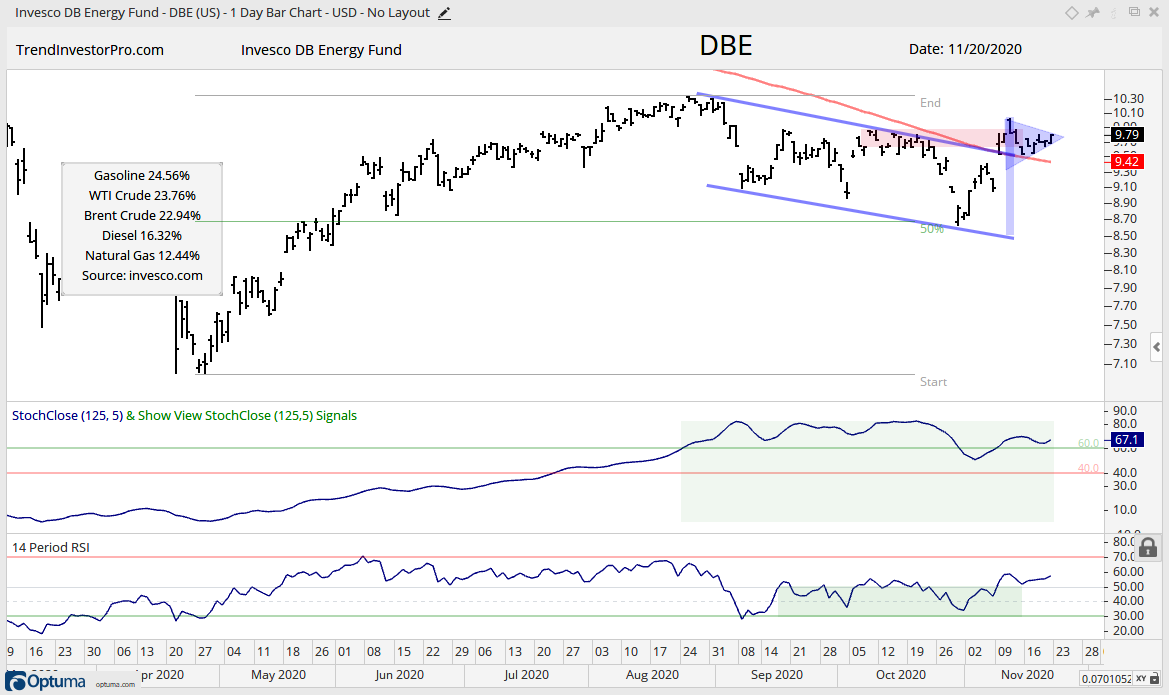
The DB Energy ETF (DBE) is holding its channel breakout with a small consolidation this last two weeks. Watch for a continuation breakout. Alternatively, a break back below 9.50 would be negative.