Posted By
Arthur Hill, CMT
On
In
Archive |
No Comments
The bulk of the evidence remains bullish for stocks, but we are seeing a short-term non-confirmation from QQQ and continued relative weakness in IWM. SPY remains the leader of the group with a new high this week. However, the current leg up is also getting quite extended because we have not seen a decent correction in six months. Even though the risk appetite returned to QQQ and some big techs, it has yet to return to the smaller high-beta ETFs, such as the ARK ETFs. All six ARK ETFs are performing like IWM: lagging and down since mid March.
Report Summary
EW sectors show broad strength within S&P 500
Large-caps and commodities lead as small-caps lag.
All ARKs are down since the ides of March.
SPY: long-term uptrend and short-term uptrend (extended).
QQQ: long-term uptrend and short-term uptrend (non-confirmation).
IWM: long-term uptrend and short-term breakout (still lagging).
Composite Breadth Model: bullish since May 29th (bull market).
TLT breaks wedge line as RSI fails in overbought zone.
Oil breaks out of triangle and challenges long-term resistance.
The Fed Balance sheet contracts as yield spreads flatten.
Broad Strength since mid March
I changed the performance timeframe on the comparison chart to March 15th, the ides of March. This is when the Russell 2000 ETF peaked and started underperforming. There were also minor peaks in SPY and QQQ, but they have since exceeded their mid March highs. IWM has not. The first chart shows performance for the equal-weight sectors since mid March. Keep in mind that these are the equal-weight S&P 500 sectors. The S&P 500 EW ETF (RSP) is up 4.59% and nine of eleven sectors are up between 4 and 6.6 percent. This shows broad strength within the S&P 500 since mid March. The EW Communication Services ETF (EWCO) and EW Energy ETF (RYE) are the only two losers.
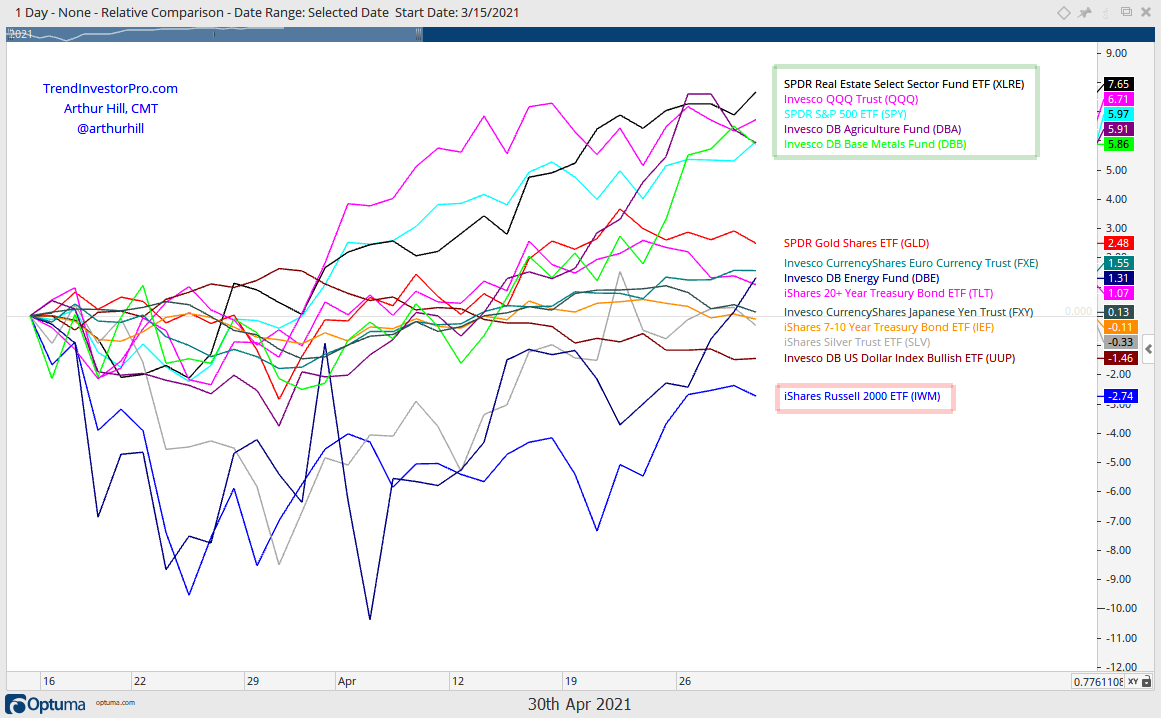
Large-caps and Commodities Lead
The next chart shows performance for 14 intermarket ETFs since March 15th. REITs, large-caps, Metals and Agriculture are leading with the biggest gains by far (5.86% to 7.65%). Gold, Energy and the Euro are positive. Bonds are split with TLT up and IEF down. The Russell 2000 ETF (IWM) stands out on the downside with a 2.74% decline since mid March. This is a big performance discrepancy with large-caps.
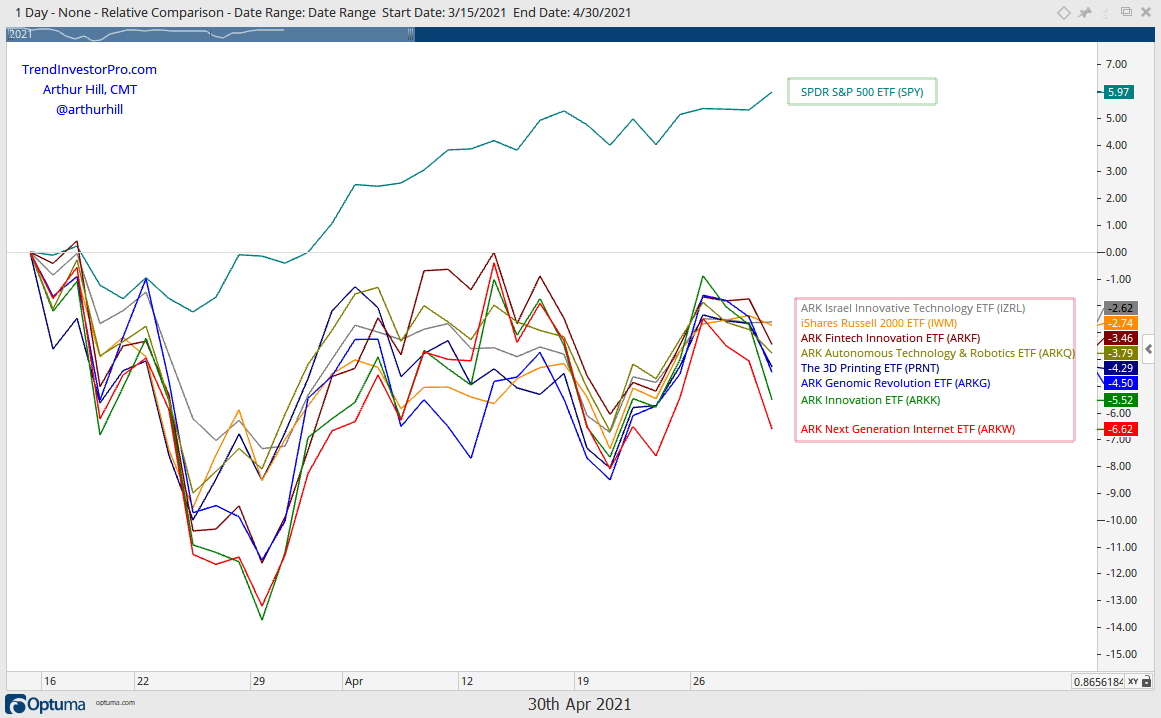
High-Beta Names Down and Underperforming
The next chart shows performance for the six ARK ETFs, IWM and SPY since March 15th. SPY is up 5.97%, IWM is down 2.74% and the performance differential is a whopping 8.71%. All six ARK ETFs are below their mid March highs (down). These ETFs represent the ultimate risk-on trade (high beta). Relative and absolute weakness in these shows less risk appetite in the stock market right now. Also note that that the clean energy ETFs (TAN, PBW, ICLN) and cannabis ETFs (MJ, YOLO) are also down since mid March.
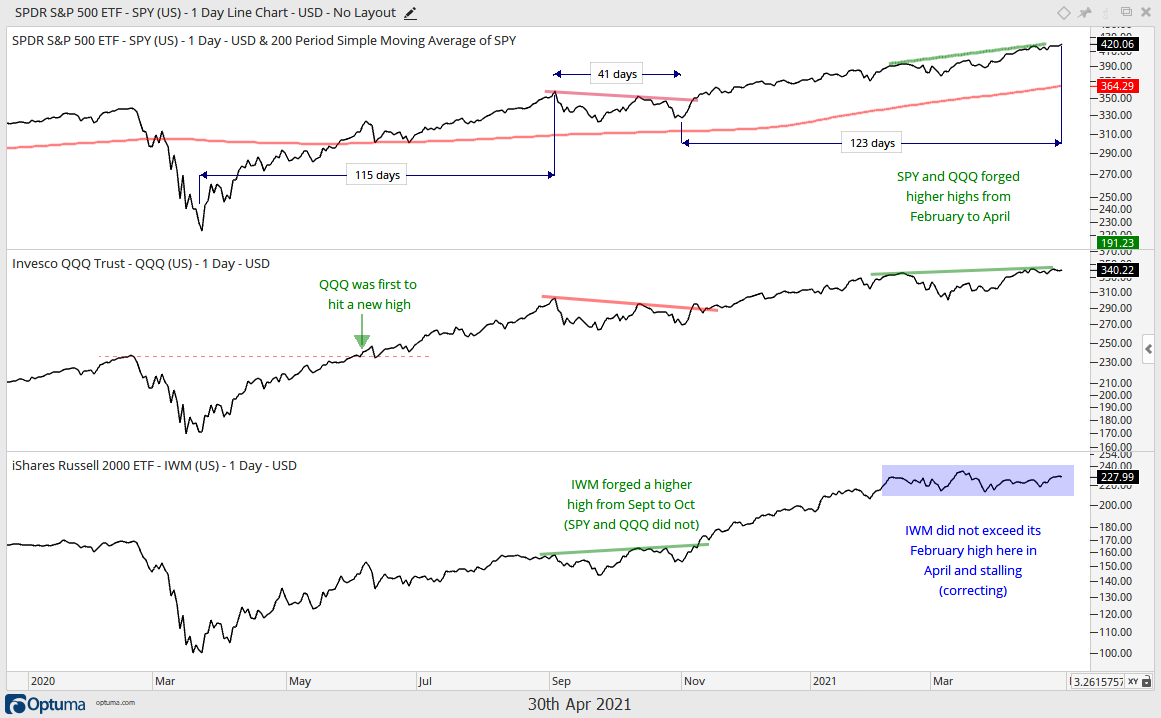
SPY Extends to New High
The top window shows SPY hitting a new high and the current advance notching up 123 days. Note that the first advance lasted 115 days before SPY moved into a 40+ day corrective period (September-October). SPY is currently up around 29% since the late October low, but shows no signs of letting up. Even so, this move is getting quite extended.
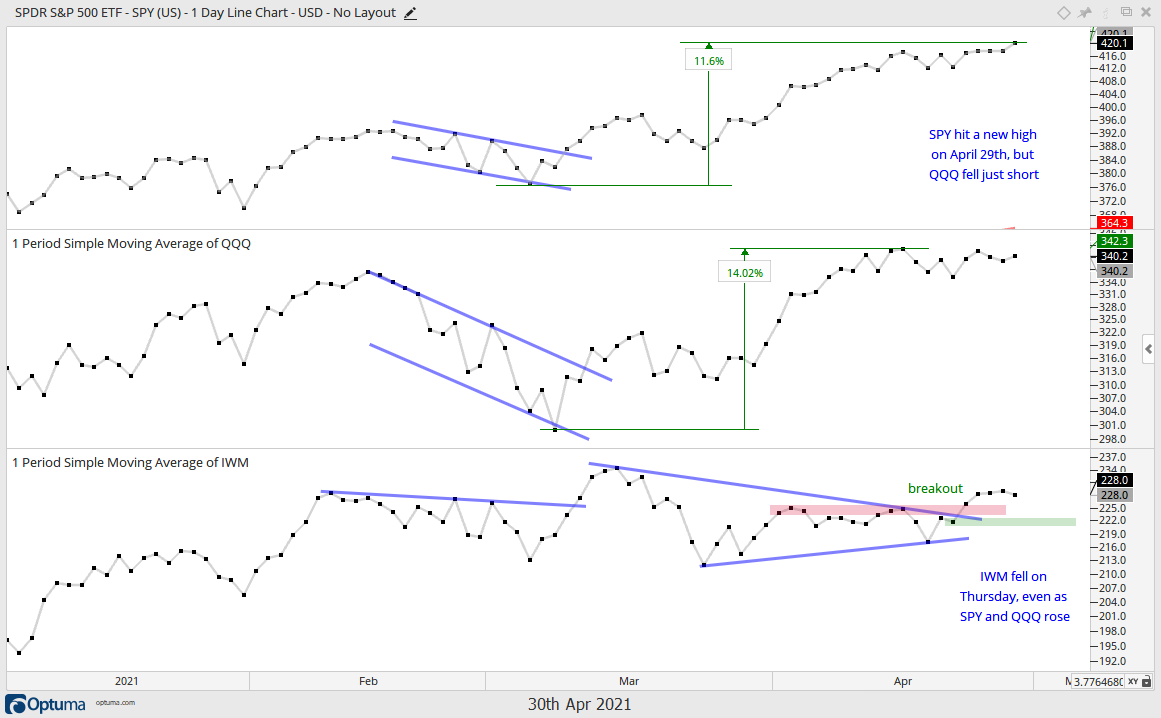
QQQ Fails to Confirm
SPY hit a new high this week, but QQQ fell just short of its mid April high and IWM remains well short of its mid March high. The non-confirmation in QQQ is not a major issue just yet. Also notice that QQQ and SPY advanced on Thursday and IWM declined. IWM broke out last Friday and this breakout is bullish until proven otherwise. I would, however, not give this breakout much wiggle room because IWM is lagging, SPY is extended and QQQ did not confirm this week. A close below 221 (IWM) would call for a re-evaluation.
Composite Breadth Model: Bull Market
There is no change in the Composite Breadth Model, which remains on a bullish signal since May 29th, 2020. This signal is 234 days old and SPY is up around 40%.
The model and indicator charts can be found on the Market Regime page[1]. These include the Thrust Models for the S&P 500 and S&P 1500, and the Trend Models for these indexes. Declines and consolidations for the major index ETFs are considered corrections within the bigger uptrend as long as the Composite Breadth Model is net bullish. Note that this model is designed to absorb corrections and not turn bearish until the weight of the evidence is bearish
You can learn more about the methodology and historical performance for these breadth models in this article.[2]
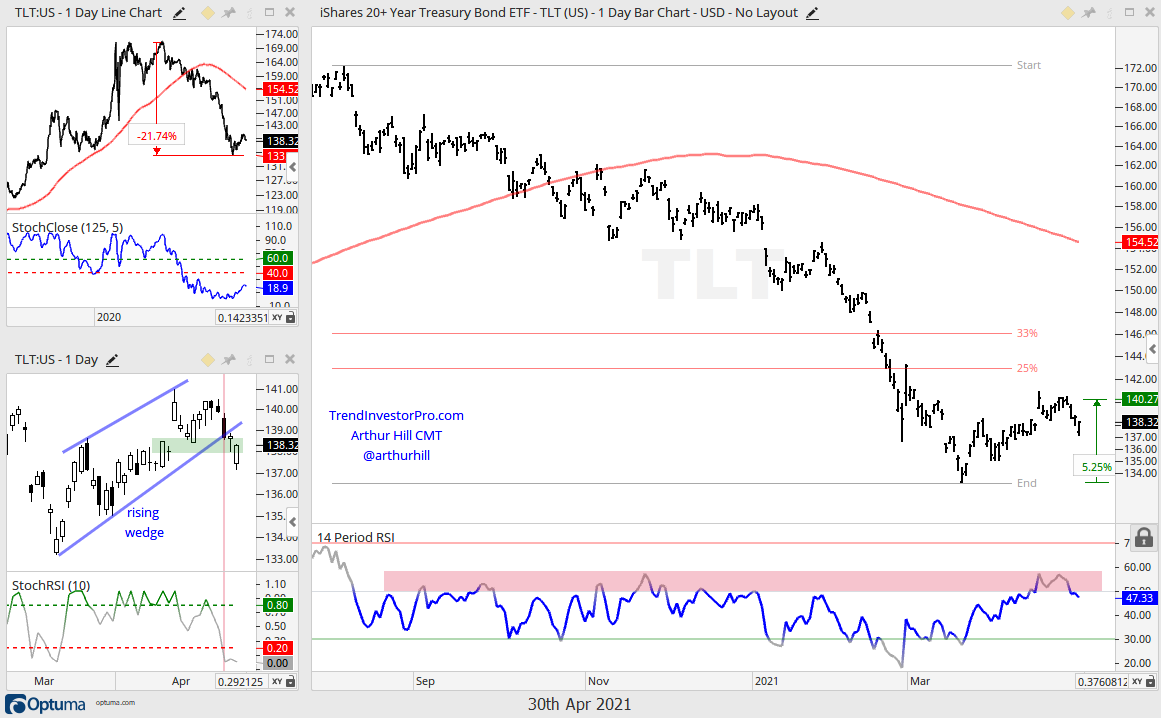
TLT Breaks Wedge Line
The 20+ Yr Treasury Bond ETF (TLT) got an oversold bounce with a move from 134 to 141 and then reversed with a breakdown. The bar chart shows RSI moving into the momentum resistance zone (50-60) and turning down this week with a move below 50. The candlestick chart shows TLT breaking the wedge line and StochRSI plunging below .20 on Tuesday. You may have already guessed, but this setup is the reverse of a bullish setup (long-term downtrend, RSI in overbought zone and StochRSI plunge). This argues for lower bond prices and higher Treasury yields.
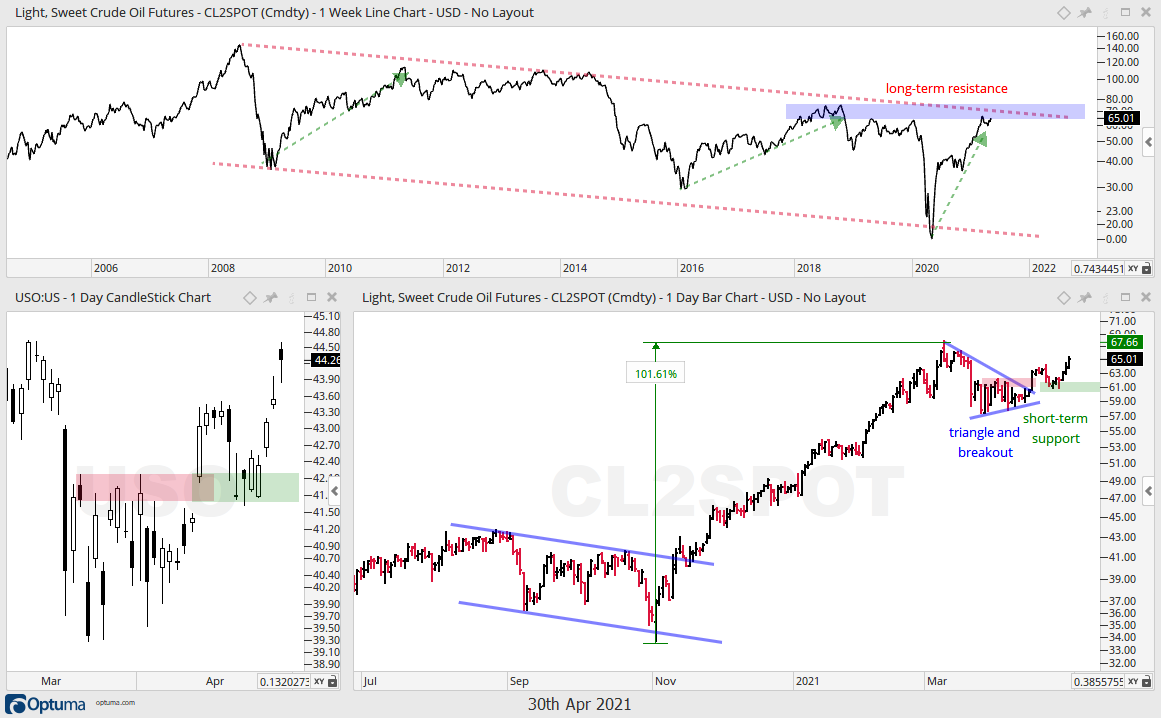
Oil Challenges Resistance with Short-term Breakout
The chart below shows Spot Crude ($WTIC) in a secular downtrend since 2008 and price bumping against resistance from the 2018-2019 highs (blue zone). The lower window shows price doubling from November to early March and then a triangle consolidation. Crude broke out with a surge in mid April, fell back to the breakout zone last week and surged again this week. The triangle breakout is bullish until proven otherwise and I will set support at 60. A close below this level would be bearish for crude and energy related stocks. A decline in oil could also cause junk bond spreads to widen. It hasn’t happened yet, but is something to watch.
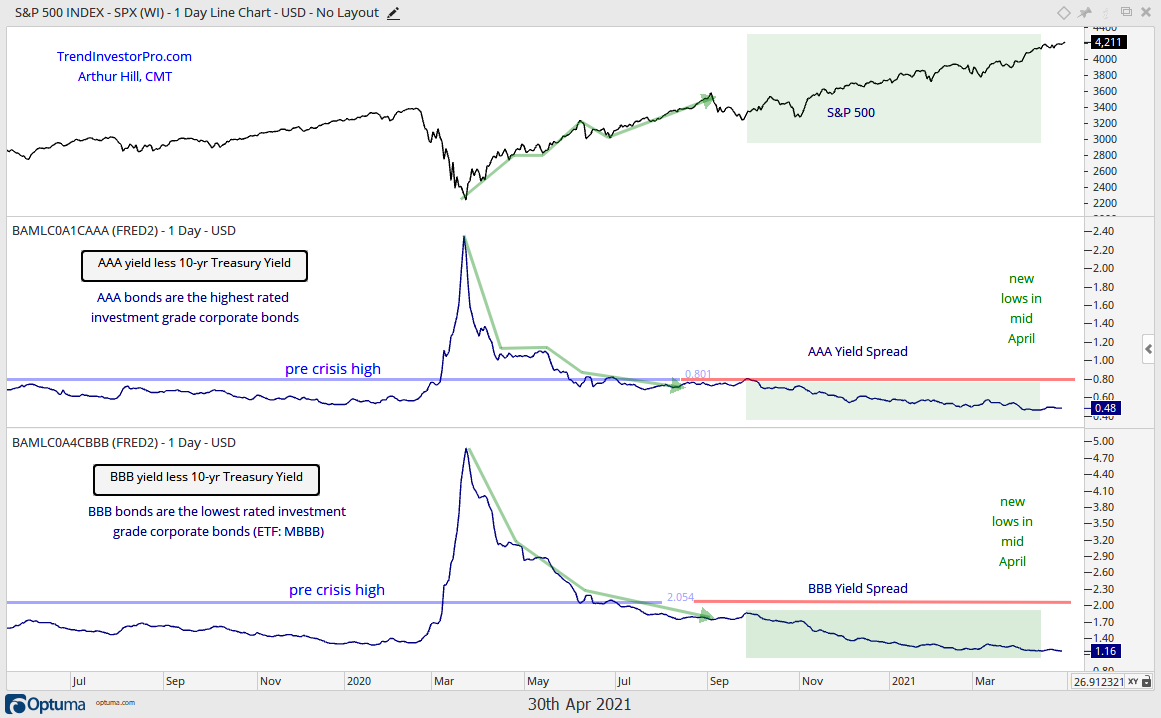
Yield Spreads and Fed Balance Sheet
Investment grade yield spreads narrowed from late September to mid April (green shading) and then flattened over the last few weeks. Overall, these spreads are at very low levels and not showing any signs of stress in the credit markets. We could see some ebb and flow at low levels. In other words, the BBB spread could widen a little, perhaps to the 1.50 area, and this could coincide with a correction in stocks. A move above 1.2 could signal the start of an uptick.
Junk and CCC yield spreads narrowed from late September to early April (green shading) and then flattened over the last few weeks. They remain at very low levels and there are no signs of stress at the junk end of the credit markets.
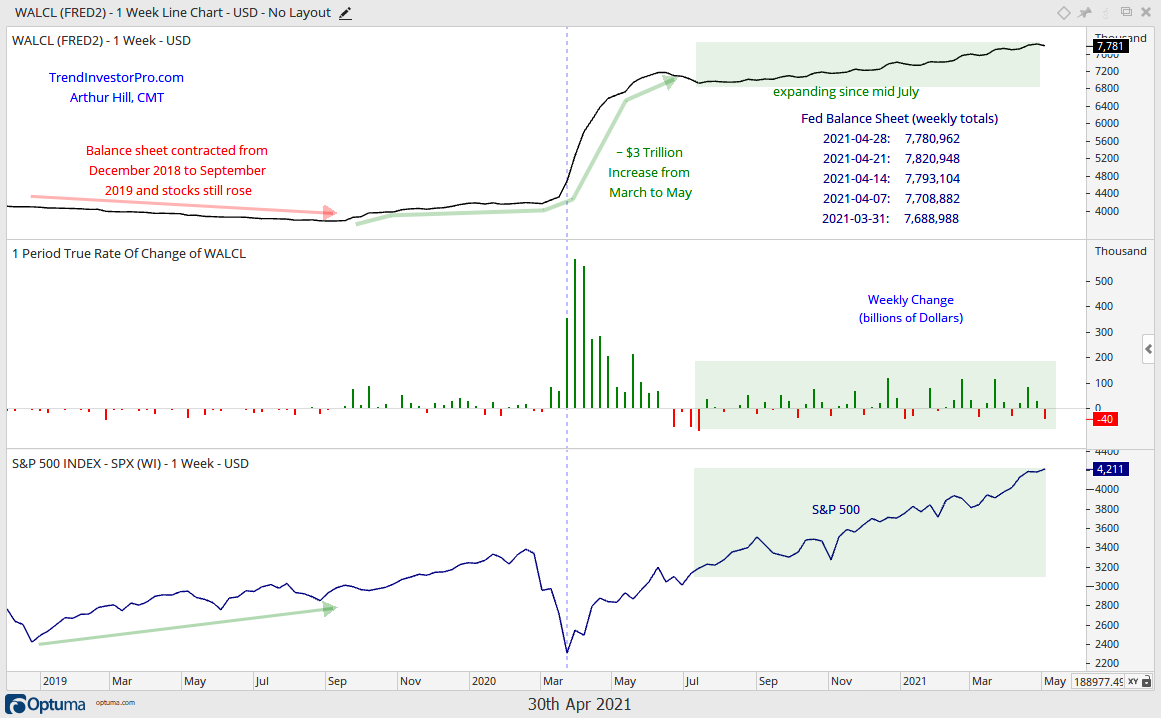
The Fed balance sheet contracted by $40 billion this past week, but the overall trajectory shows expansion since mid July. There is a clear positive correlation between the $3 trillion expansion and the S&P 500 surge off the March lows. There is also a positive correlation between the steady expansion since mid July and the stock market advance, although this was interrupted with a corrective period from September to October. The Fed still has the market’s back, but corrections are still possible.