Stocks have been mixed since summer with the major index ETFs trading in ranges the last three months. The S&P 500 SPDR and Nasdaq 100 ETF hit new highs before embarking on their trading ranges, while the S&P MidCap 400 SPDR and Russell 2000 ETF have been range bounce since spring. There is no denying that the broad market environment has been challenging the last few months, but it is certainly not bearish. As always, it is important to look at both sides of the coin when analyzing the market and take a weight of the evidence approach. That is just what we will do today.
Momentum ETF Underperforms, but Remains Bullish
The S&P 500 Minimum Volatility ETF (USMV) is outperforming the S&P 500 Momentum ETF (MTUM), but this is not necessarily bearish for the stock market as a whole. The chart below shows MTUM stalling the last few months and holding above its rising 200-day SMA. Stalling signals a stalemate between buying pressure and selling pressure. The trouble starts when/if MTUM breaks its August low and 200-day. This has not happened yet though.
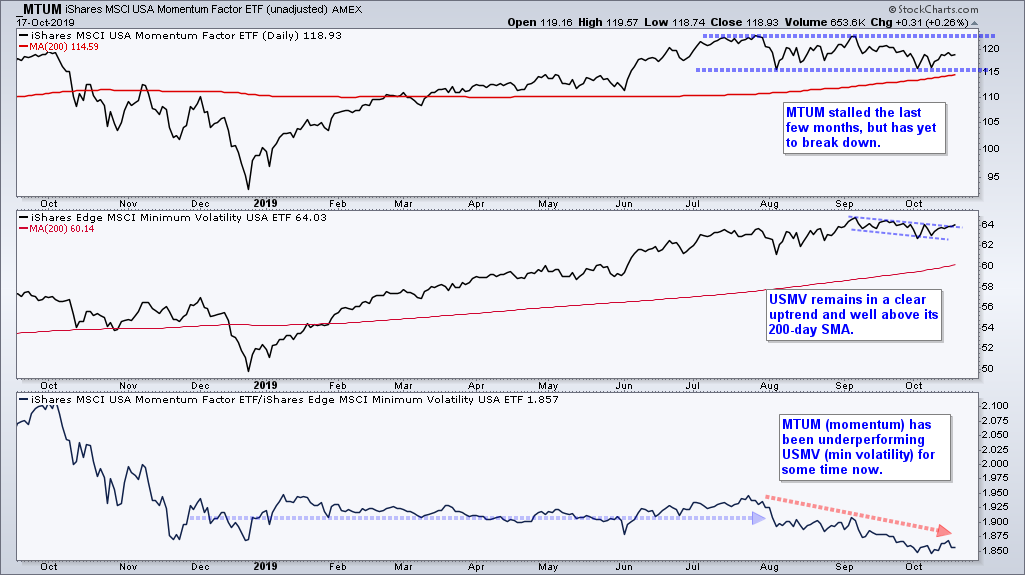
USMV hit a new high in September and edged lower the last five weeks. This is a flag-like consolidation within an uptrend and a bullish continuation pattern. The lower window shows the MTUM:USMV ratio flat-lining from December to July and then hitting new lows in August. Even though MTUM is underperforming USMV, I do not consider this negative for the broader market because MTUM is holding up on the price chart (top window). The MTUM price chart is one side of the coin, while the MTUM:USMV ratio is the other. This ratio simply tells us that low volatility stocks are outperforming momentum stocks. Low volatility stocks include Utilities, REITs and Staples, while momentum stocks include Technology, Healthcare and Industrials.
Waning Upside Momentum is Normal
The S&P 500 SPDR (SPY) hit a new high in July and then moved into a trading range the last few months. This is a consolidation within an uptrend and you know what I am going to say next. A consolidation after an advance is a bullish continuation pattern. Sure, not all bullish consolidations resolve higher, but the odds favor a bullish resolution when the bigger trend is up. Moreover, with a higher low from August to October and equal highs in July and September, this consolidation looks like a classic Ascending Triangle, which is a bullish continuation pattern.
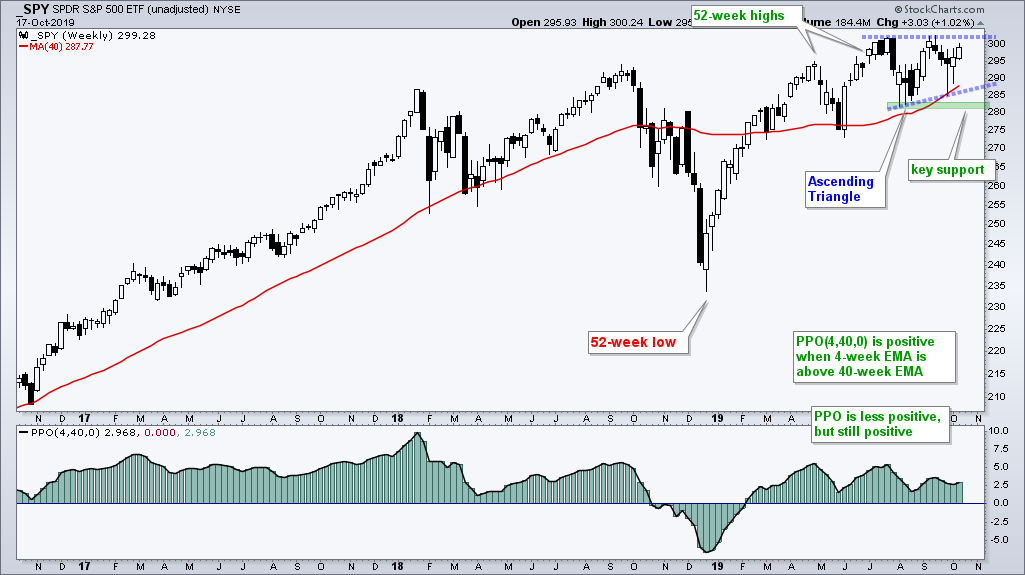
The indicator window shows the weekly PPO(4,40,0) to measure momentum. One side of the coin shows waning upside momentum, while the other shows upside momentum outpacing downside momentum. Momentum is clearly slowing, but less upside momentum is not outright bearish, especially when it comes after a new high. Momentum indicators flatten or even decline during consolidation phases because prices are moving sideways. Duh! The indicator window shows the PPO failing to exceed its April high this summer and forming a lower high in September. Yes, upside momentum is slowing. However, the PPO is still positive and this means there is more upside momentum than downside momentum. Again, look at both sides of the coin.
QQQ vs MDY vs IWM
The next chart shows the Nasdaq 100 ETF (QQQ), S&P MidCap 400 SPDR (MDY) and Russell 2000 ETF (IWM) for comparison. QQQ has a triangle working over the last few months and is challenging the upper line. QQQ is also less than 1% from a 52-week high. MDY is clearly not as strong as QQQ, but an Ascending Triangle could be taking shape with higher lows in July and October. A breakout near 360 would be quite bullish. IWM is the weakest of the three with a slight downtrend in play since April.

Even though IWM is lagging over the last three and six months, it is perking up here in October. Note that IWM is actually down on the three month (-.16%) and six month (-1.08%) timeframes. Stocks are in the midst of a pretty strong upswing the last 11 trading days with QQQ and IWM leading the charge. Yes, IWM is up 4.14% and slightly outperforming SPY. This is a positive start to October. Let’s see if we can get follow through and a breakout.
The Oversold Triple 20 Play
The major index ETFs are in some sort of trading range the last few months and an upswing the last two weeks. The chart below shows SPY with the mean-reversion triple play using an indicator combo to generate signals, which is a technique I learned from Rob Hanna at QuantifiableEdges.com [1]. An oversold triple play occurs when RSI(5) moves below 20, the Stochastic Oscillator (14) moves below 20 and the S&P 500 %Above 20-day EMA ($GT20SPX) moves below 20. Keep in mind that I am only interested in short-term oversold conditions because the bigger trend is up for SPY. I only want mean-reversion setups in the direction of the bigger trend.
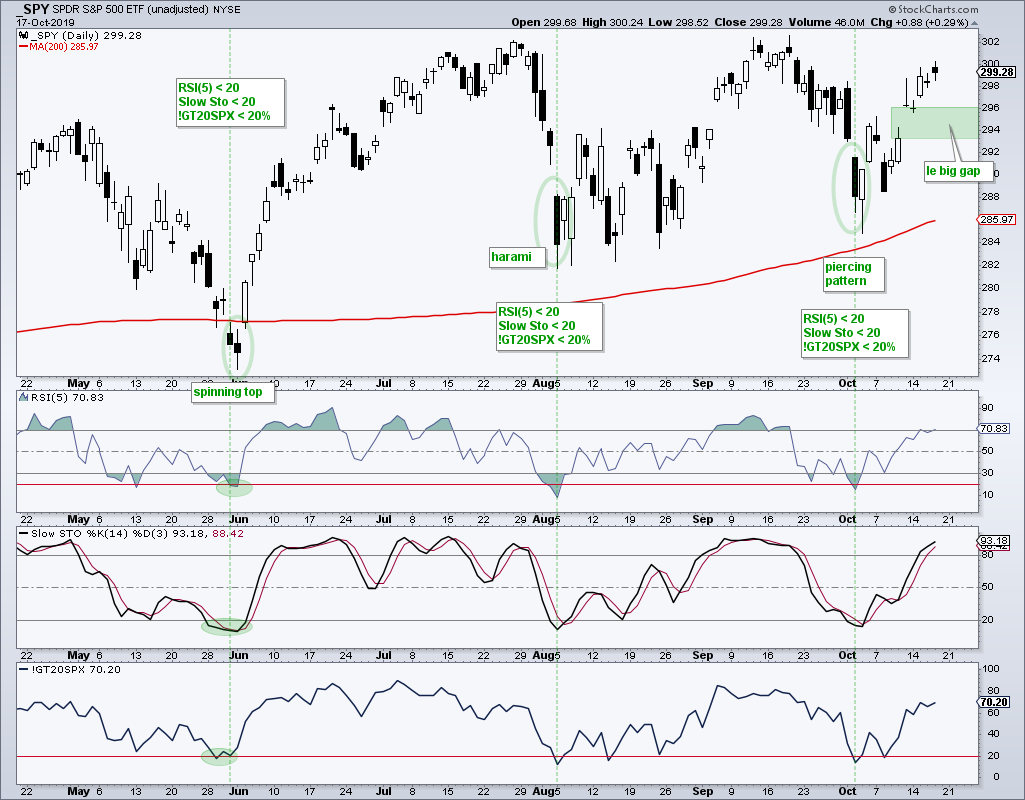
The green lines above show when all three indicators dipped below 20 over the last six months. I am also marking three candlestick patterns at each low. The harami and spinning top show indecision and both were followed by gaps. The piercing line is a bullish reversal pattern and SPY also gapped up the next day.
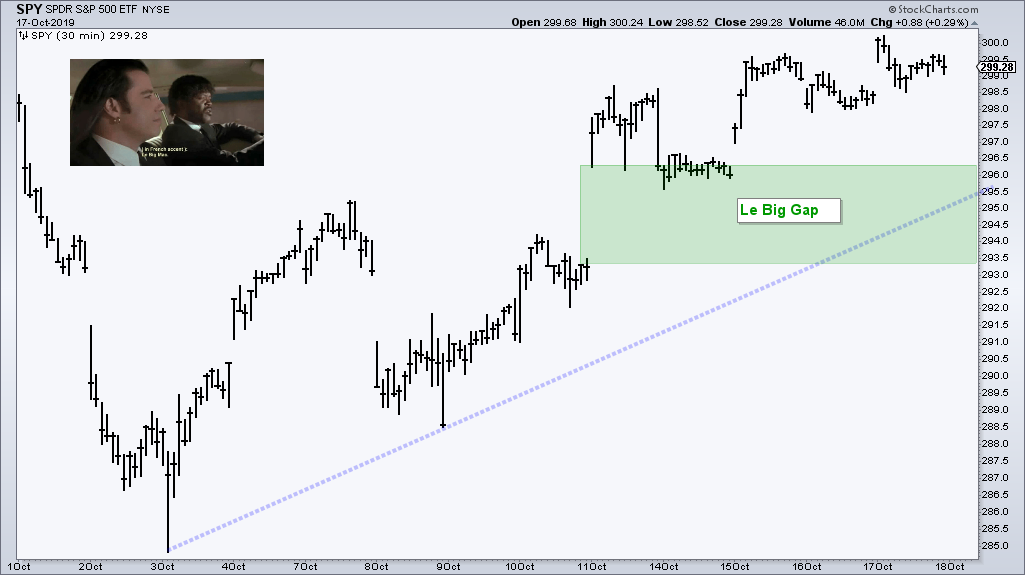
At this stage we are currently in the midst of an oversold bounce or upswing and I am watching the gap on October 11th, which is called “Le Big Gap” to channel a little Pulp Fiction. A close below 293 would fill this gap and keep SPY bound within a trading range. As long as this gap holds and the upswing remains, I expect a challenge to resistance and even a breakout.
Index and Sector Breadth Models Remain Bullish
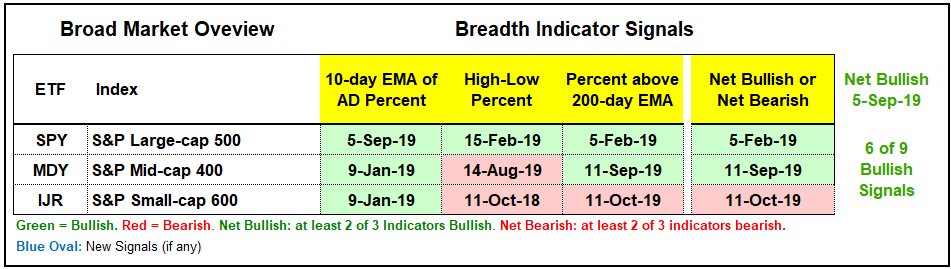
There is no change to the index breadth model, which reflects the state of the broader market right now. Large-caps and the S&P 500 are leading, small-caps and the S&P 600 SmallCap Index are lagging, and mid-caps and the S&P 400 MidCap Index are somewhere in between. Overall, all three S&P 500 indicators are on active bullish signals, while three of the other six are on active bullish signals. $SML turned net bearish last week, but $MID remains net bullish.
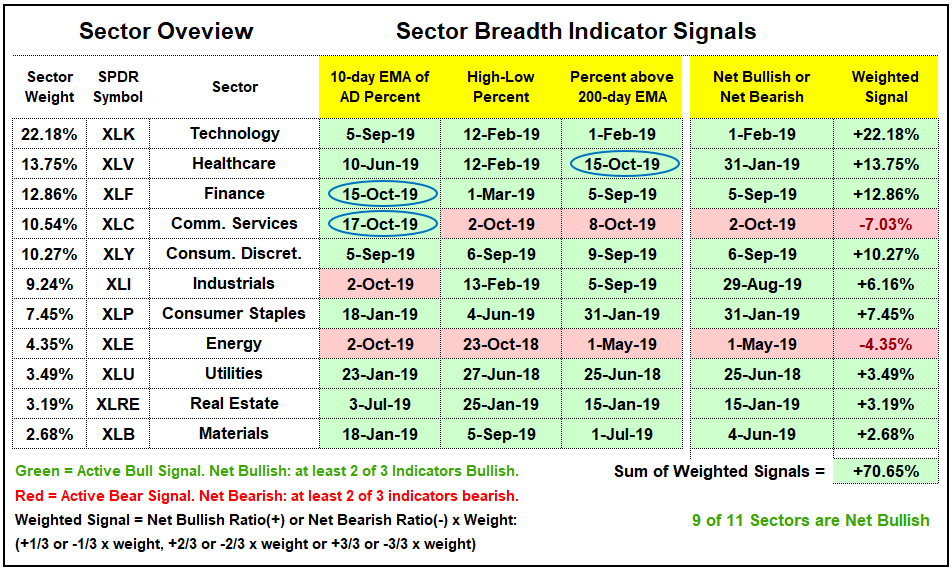
The Sector Breadth Model is channeling the trading range in SPY with two new bearish signals last week and three new bullish signals this week. The model was still firmly bullish last week and obviously improved with three new signals this week. Healthcare %Above 200-day EMA ($GT200XLV) moved above 60% as XLV hit a three month high. The 10-day EMAs for Finance AD Percent ($XLFADP) and Comm Services AD Percent ($XLCADP) surged above 30% for bullish breadth thrusts. XLF was and remains net bullish, while XLF was and remains net bearish. Overall, 9 of 11 sectors are net bullish and the Sum of the Weighted Signals is at strong +70.65%. Note that the scale ranges from -100% to +100%.
Few New Highs, Even Fewer New Lows
The lack of new highs is an argument for the bears right now, but one cannot talk about new highs without considering new lows because there are two sides to the coin here. Sure, the S&P 500 is within 1% of an all time high and there were just 36 new highs on Thursday. There were over 100 new highs in early June, but new highs have not exceeded 50 since early September. There is an upside leadership issue within the S&P 500, but this alone is not enough reason to turn bearish.
Despite a waning number of new highs, new highs are still outpacing new lows. Barely. On balance, there are still more stocks in strong uptrends (hitting new highs) than strong downtrends (hitting new lows). I would not turn long-term bearish until we see a serious expansion of new lows and S&P 500 High-Low% ($SPXHLP) exceeds -10%.
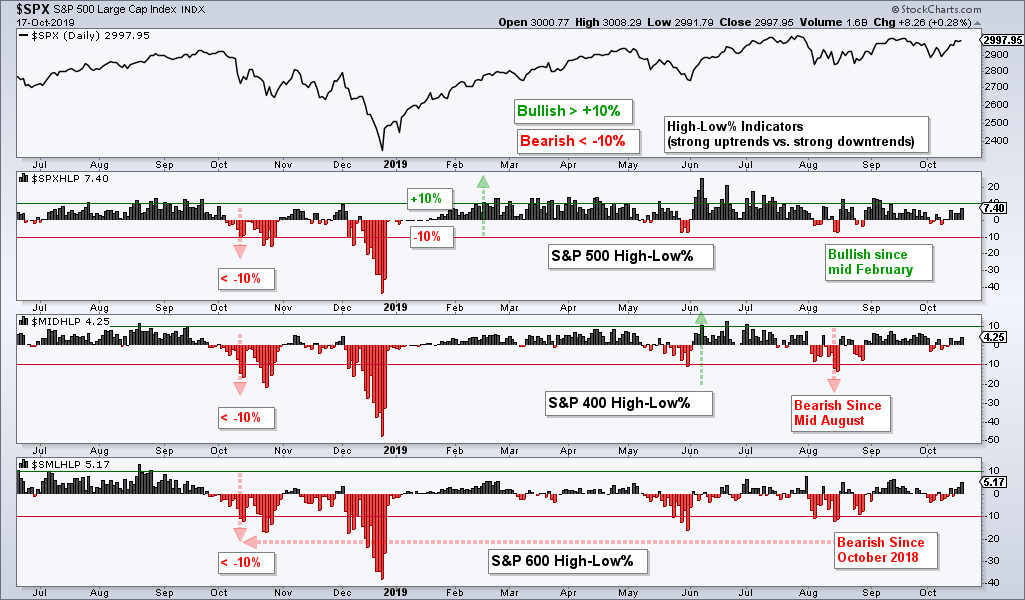
Short-term, I continue to watch the High-Low Lines to define the current upswing. The chart below shows the S&P 500 High-Low Line rising since August 16th and the S&P 400 MidCap High-Low Line rising since September 4th. Look for a move below the 10-day EMAs to signal a downturn and the High-Low Lines, and by extension in the major index ETFs. The S&P 600 SmallCap High-Low Line dipped in early October, but turned back up this week. All three are now pointing up.

Fed Balance Continues Expansion
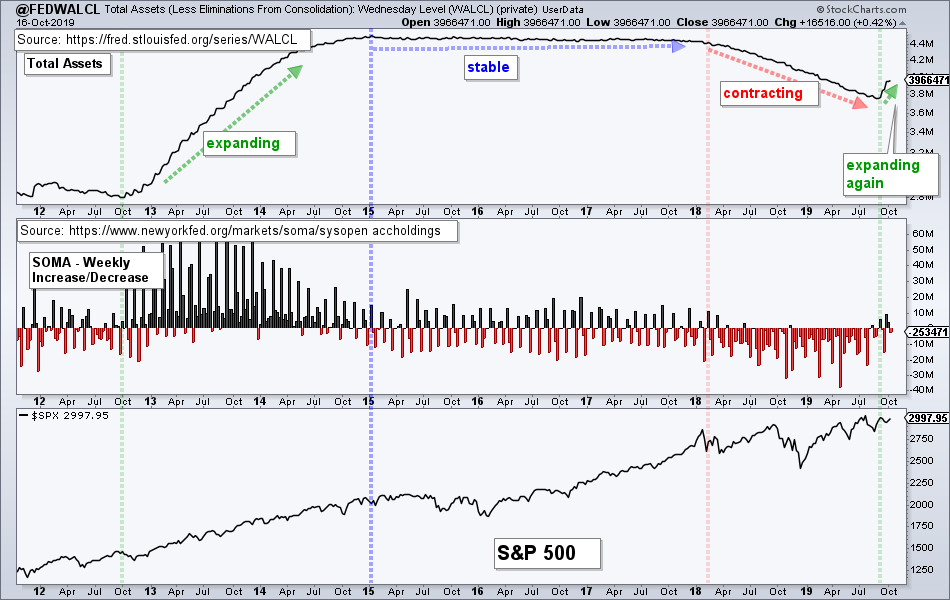
Total Assets at the Fed [2] expanded again this week, but SOMA [3]fell. As the chart below shows, Total Assets decreased from early 2018 until August 2019 and then increased the last six weeks. SOMA increased three of the last six weeks. The Fed is not the be-all end-all for the stock market, but the expansion in the balance sheet suggest easing on the part of the Fed. This is just one more piece to add to the bullish argument for stocks.
Bottom Line: Bull Market
Even though small-caps and mid-caps are dragging their feet, the bulk of the evidence remains bullish for stocks. SPY and QQQ are above their rising 200-day SMAs and within 1% of all time highs. The five big offensive sectors held support from their August lows in early October and surged the last two weeks. These surges affirm support from the August lows and continued leadership in large-caps.
IWM, which has some 2000 stocks, is still double digits below its 2018 highs and has yet to even challenge its summer highs. As far as individual stock and ETF picks are concerned, it is a tough environment because of weakness in small-caps and mid-caps, which account for the majority of stocks. A tough environment, however, is not the same as a bearish environment. It just means there are crosscurrents at work. In other words, we are not in a broad bull market that lifts all boats, as we saw in 2013, 2016 and 2017.