This weekly commentary, featuring the S&P 500, Index Breadth Model and Sector Breadth Model, is designed to deliver an unbiased view of the current stock market environment. Models, while not perfect, provide a clear process driven approach for evaluating the market. Focusing on present signals, instead of future possibilities, models reflect the current state of the market. Models do not tell us what could or might be, they simply tell us the way it is.
There are, of course, concerns out there. The S&P 500 SPDR, Nasdaq 100 ETF and Technology SPDR have yet to take out their July highs. The Russell 2000 ETF, S&P SmallCap 600 SPDR and S&P MidCap 400 SPDR failed at resistance levels that extend back several months. The defensive sectors are leading on the price charts with new highs in September.
Concerns are one thing. Evidence is another. Today I will put the concerns on the back burner and focus on the current evidence. Market assessments, after all, should be based on actual signals, not concerns.
The Trend Evidence for SPY
When looking at charts, it is also important to focus on what IS, not what MIGHT be. Let’s try this on the weekly chart for the S&P 500 SPDR. Here is what IS happening right now. SPY hit a new all time high in July, the ETF is above the rising 40-week SMA and the PPO(4,40,0) is positive. Furthermore, the index sports higher highs and higher lows in 2019. SPY is in an uptrend and this chart remains bullish. The August lows mark most recent important low and this is key support level to watch going forward.
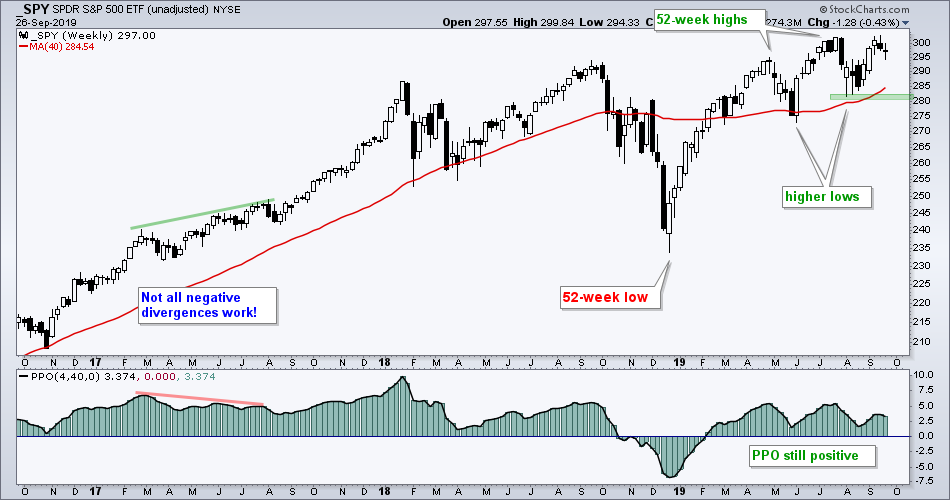
I should probably just stop right there, but there are several possibilities out there to sow the seeds of doubt and confusion. SPY is trading near its July high so a Double Top is possible. The July high also marks the mother of all resistance levels (tongue planted firmly in cheek). Indecisive candlesticks formed the last three weeks so a reversal near the July high is possible. The PPO formed a lower high and momentum is waning. This uptrend is doomed, just not right now.
I know it is hard to unread something you just read, but forget the preceding paragraph. A Double Top would not be confirmed unless SPY breaks its August low. SPY surged 6% in three weeks so a little stalling is perfectly normal. The PPO may not be as strong as it was, but it is in positive territory so the momentum cup is half full, not half empty. A downtrend is impossible without a lower low and SPY remains well above the August lows.
The Index Breadth Model Remains Bullish
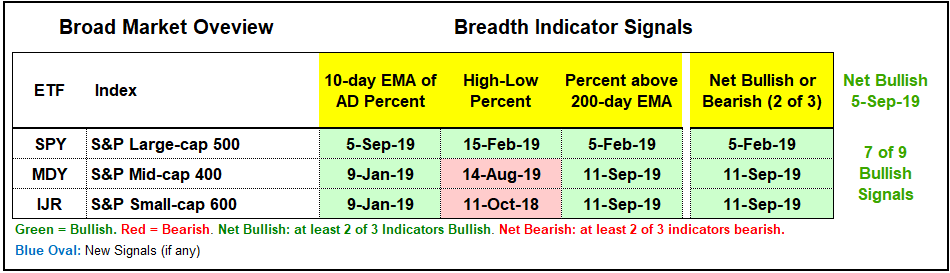
There is no change in the Index Breadth Model, which has been net bullish since September 5th. All three indexes are net bullish and seven of nine indicators are on bullish signals. The S&P 600 SmallCap High-Low% ($SMLHLP) and S&P 400 MidCap High-Low% ($MIDHLP) remain on active bearish signals since October 2018 and August 2019, respectively. Nevertheless, the S&P 500 has been net bullish since February 5th and all three indicators are on active bullish signals.
High-Low Lines Still Rising
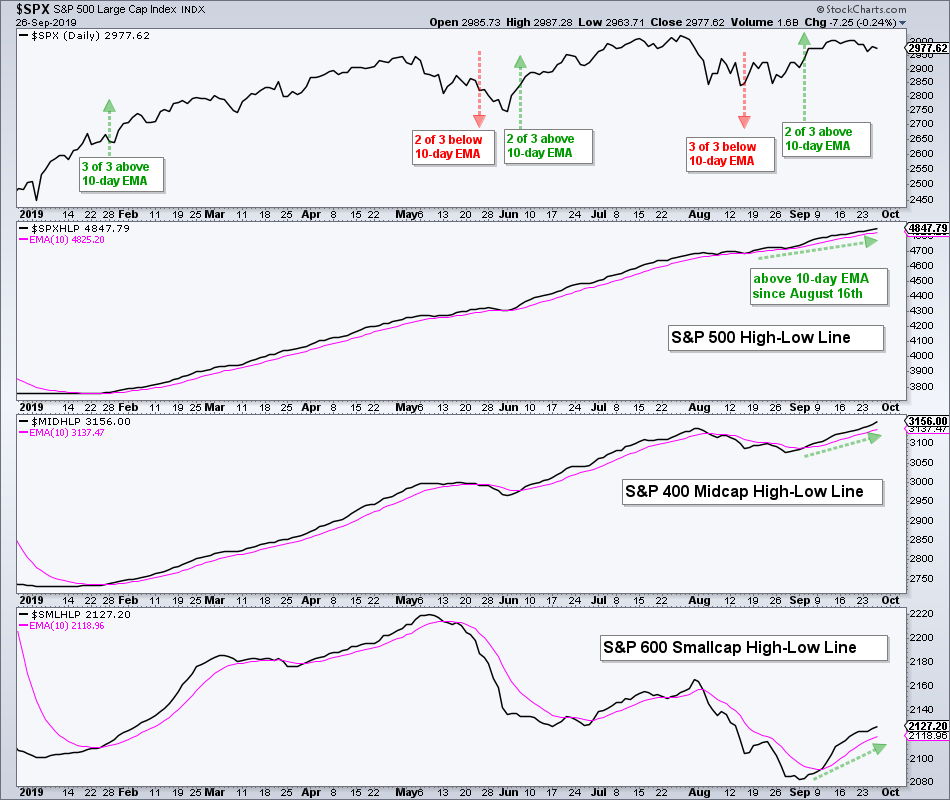
Even though the High-Low Percent indicators for small-caps and mid-caps are dragging their feet, both indexes are recording more new highs than new lows here in September. Chartists can also use the High-Low Line to measure the high-low differential. The chart below shows the High-Low Lines for the S&P 500, S&P 400 MidCap Index and S&P 600 SmallCap Index. All three turned up in September and are above their 10-day EMAs. These indicators should be considered bullish until they turn down and break below their 10-day EMAs.
Sector Breadth Model Remains Bullish
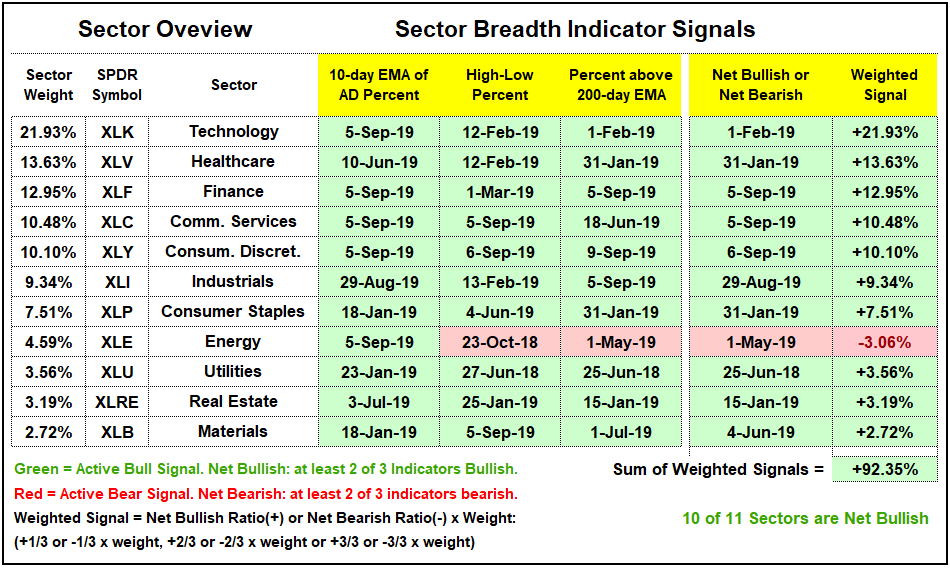
There is no change in the Sector Breadth Model as 10 of 11 sectors are net bullish and 31 of 33 indicators are on active bullish signals. The Energy sector is the only sector that is net bearish and it has been bearish since May. The Technology sector has been bullish since early February and remains one of the leaders. This is important because tech accounts for 22% of the S&P 500.
Healthcare Not So Healthy
The breadth indicators for the Healthcare sector have been net bullish since January 31st, but the Healthcare SPDR (_XLV) is up just 5% since this signal and is the weakest SPDR over this timeframe. The chart below shows XLV crossing the 90 level yet again with a decline on Thursday.
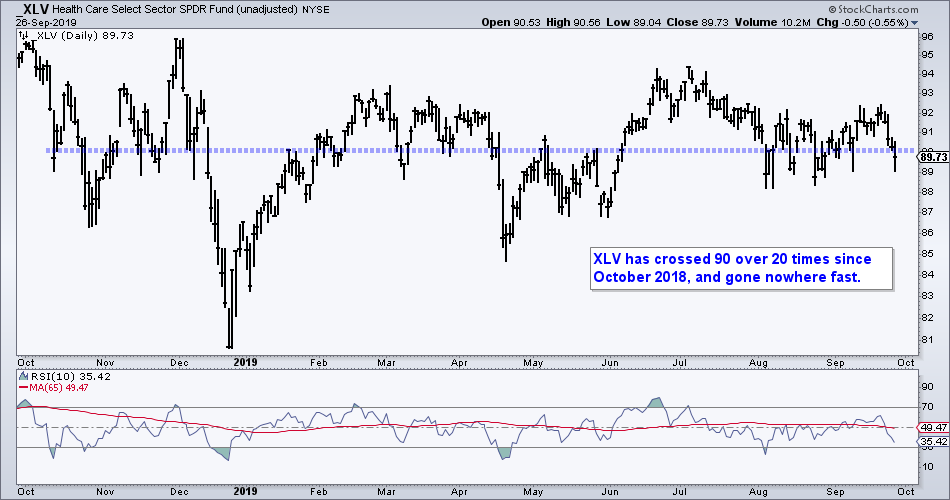
In fact, XLV is the worst performing sector since the late December low (+12.55%). As the PerfChart below shows, seven of the nine sectors are up more than twice as much as XLV during this timeframe. XLK, XLRE, XLI and XLF are leading with 30+ percent gains since December 24th.
XLK, XLI and XLF High-Low Lines
The next chart shows the High-Low Lines for the six biggest sectors in the S&P 500. Note that I use a 20-day EMA for the sector High-Low Lines because sectors are not as broad as indexes. All six are above their 20-day EMAs and three have been above their 20-day EMAs since February! The Technology, Finance and Industrials sector High-Low Lines have been consistently rising and this is bullish. The trouble starts when/if these High-Low Lines turn down and break their 20-day EMAs. Wait for the signal before thinking bearish.

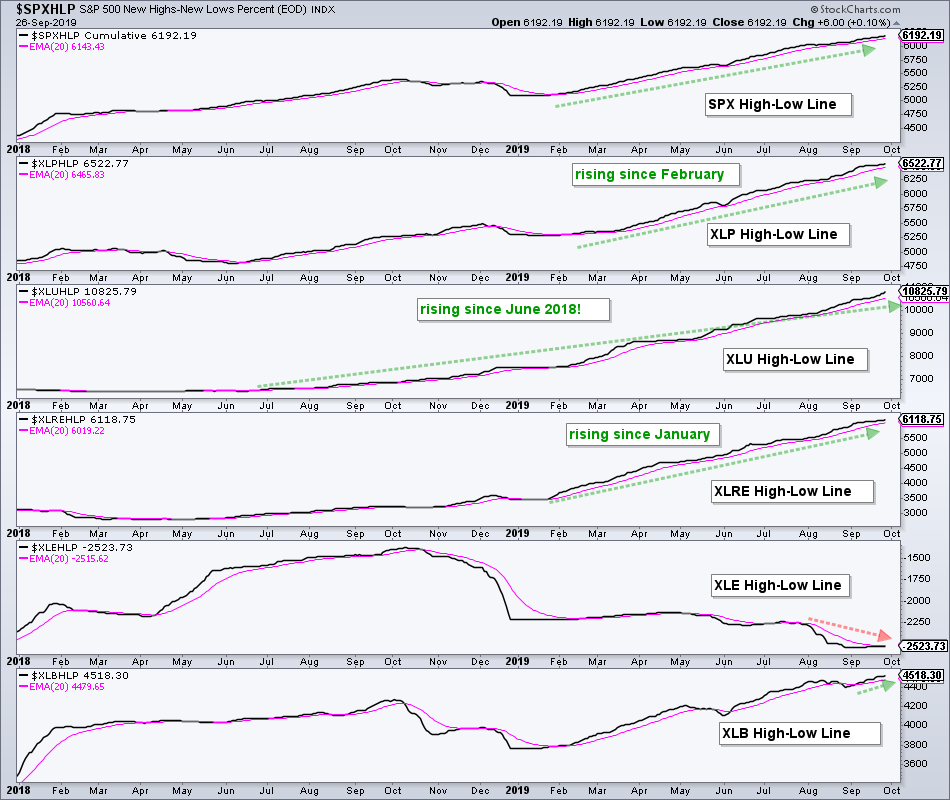
XLU, XLRE and XLP High-Low Lines
The next chart shows the High-Low Lines for the other five sectors. The XLU High-Low Line has been rising since June 2018 and this is the longest streak of the 11 sectors. The XLP High-Low Line has been rising since February, while the XLRE High-Low Line has been rising since January. These three are the strongest High-Low Lines, and sectors, in the market right now.
Bottom Line
The broad market environment remains bullish. Even though there are pockets of weakness within the stock market, the pockets of strength outweigh the pockets of weakness. There is almost always something for concern. The key is taking a weight of the evidence approach.
The S&P 500 is leading the Index Breadth Model and this index accounts for some 80% of the total US stock market. Bear markets are impossible as long as the S&P 500 remains bullish. Furthermore, SPY remains in a clear uptrend on the price chart. Even though it has yet to take out its July high, there are clearly more positives than negatives on the price chart.
The Sector Breadth Model is also firmly bullish. Even though the defensive sectors are leading, all five offensive sectors are in bull mode on the breadth table. These offensive sectors might not be as strong as the defensive sectors, but they are not showing underlying weakness. Less strength is not the same as weakness.
And that's the way it is … Friday, September 27th, 2019.
Have a great weekend!