SPY Correction, QQQ and Tech Weakness, IWM Fails, KRE Holds Breakout, TLT Fails to Bounce, Bearish Setup for Bitcoin (Premium)
Posted By
Arthur Hill, CMT
On
In
Archive |
No Comments
Correlation Rise When Broad Market Weakens
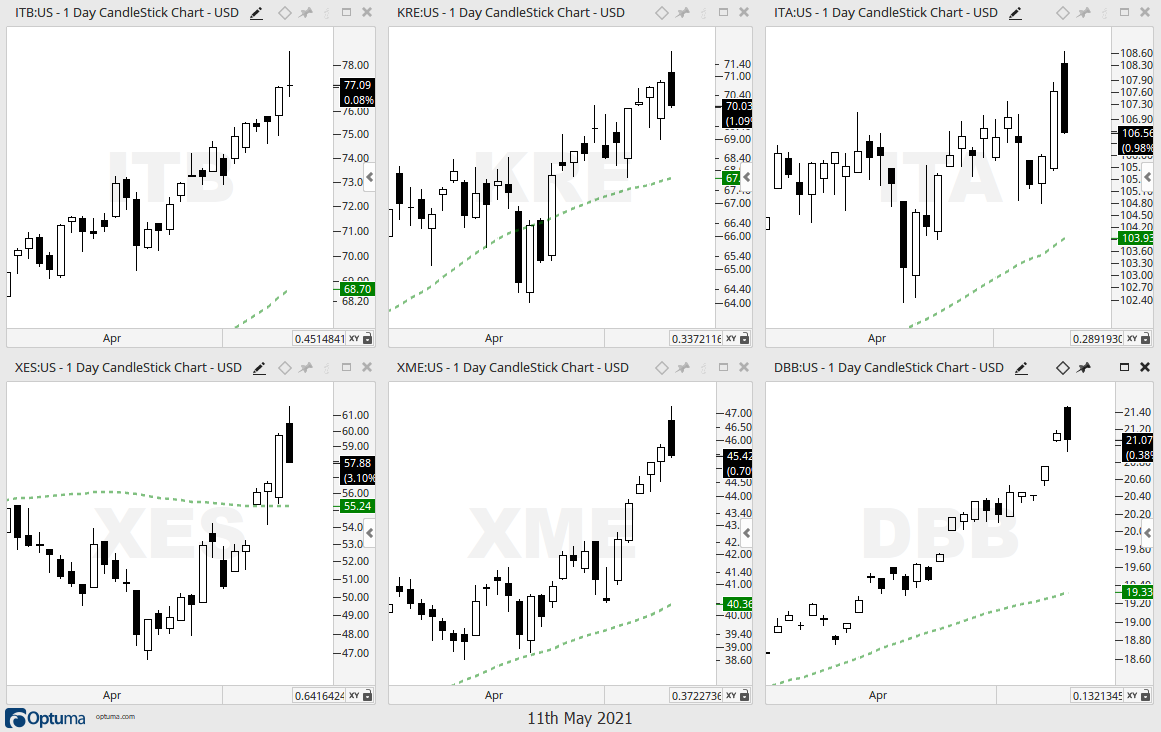
Tech and high-growth took another beating on Monday and followed through on last week’s breakdowns. Even though other areas are still holding up, many non-tech stocks and ETFs closed lower after being up during the day. The chart below shows the Home Construction ETF (ITB), Regional Bank ETF (KRE), Aerospace & Defense ETF (ITA), Oil & Gas Equipment & Services ETF (XES), Metals & Mining SPDR (XME) and DB Base Metals ETF (DBB) closing weak after being up. A one-day reversal does not a trend make, but it reflects the broadness of selling pressure on Monday.
Correlations tend to rise when the broad market indexes weaken. While there will be groups that hold up better than others, a correction in the S&P 500 could affect three quarters of the market. Broad market weakness at this stage would still be considered a correction within a bigger uptrend. Note that SPY advanced pretty much uninterrupted for six months and corrections are a normal part of the process. The last decent correction was September-October and lasted around two months. Today’s commentary will show some correction targets for SPY, review the seasonal patterns and highlight the breakdowns in tech. We will also cover small-caps, regional banks, bonds and bitcoin.
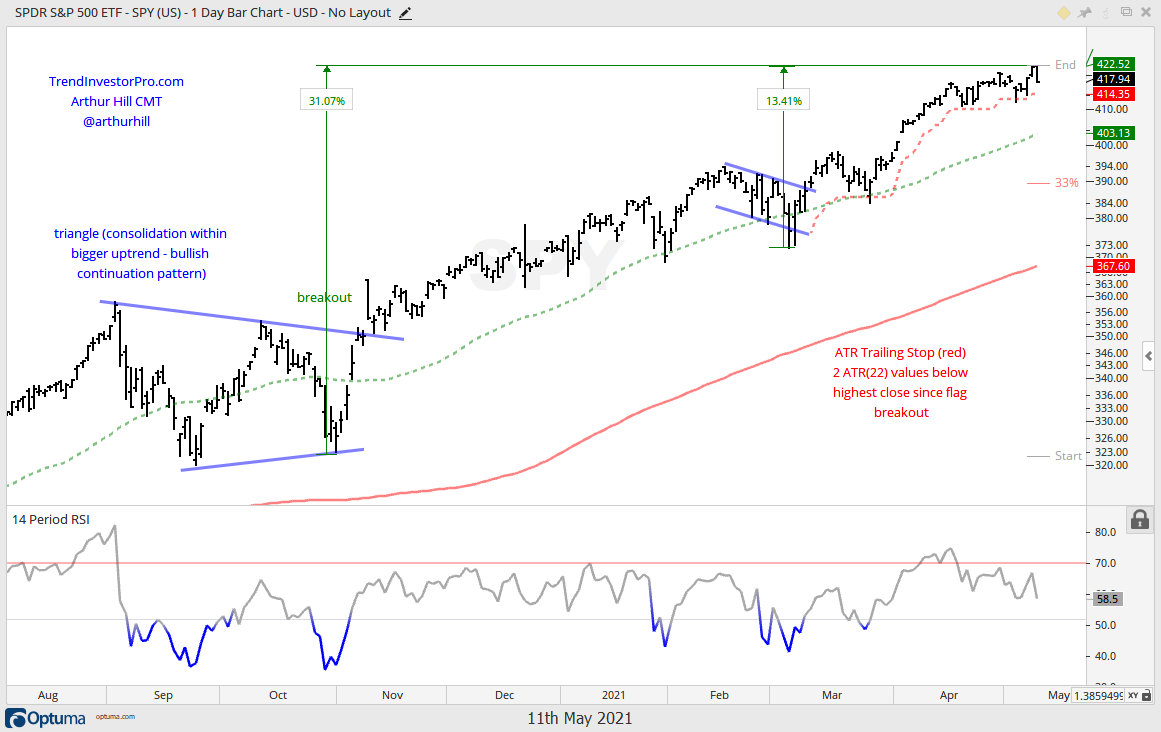
SPY Ripe for a Test of the 50-day SMA
The first chart shows the S&P 500 SPDR (SPY) with a 31% advance from late October to early May (~6 months) and a 13.4% advance from early March to early May (two months). These monster moves make SPY vulnerable to a corrective period. A 5% garden-variety haircut would put SPY back to the rising 50-day SMA, while a 1/3 retracement of the October-May advance would extend to the 390 area (8% decline). An 8% decline after a 31% advance is still in the two-steps forward and one step backward camp, and fits as a normal correction.
QQQ is already on its way to a correction after last week’s breakaway gap. The ETF bounced back into the gap zone on Friday and then fell below last week’s low on Monday. The long-term trend remains up, but the breakaway gap and support break are short-term bearish.
Non-Confirmations and Seasonal Weakness
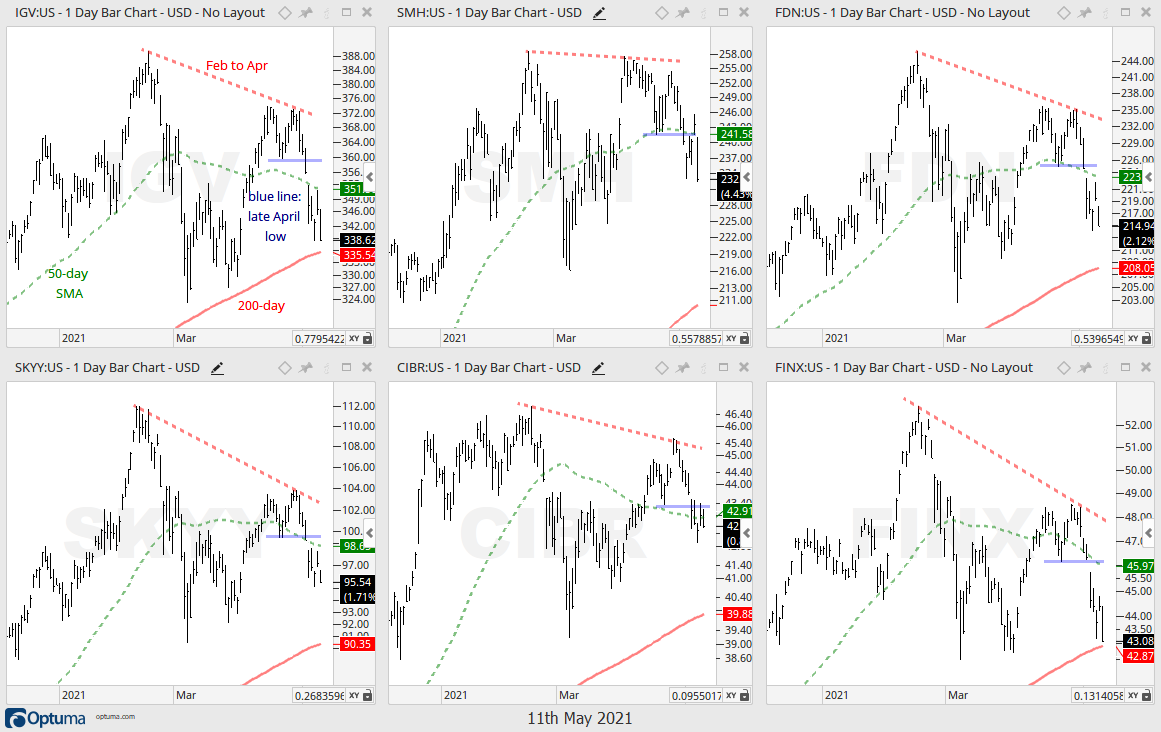
Overall, SPY was alone at the top last week because it was the only major index ETF to record a new high. The closing high for QQQ occurred on April 16th and the closing high for IWM was on March 15th. In addition, several of the tech-related ETFs peaked in mid February and formed lower highs from February to April (IGV, SMH, FDN, SKYY, CIBR, FINX). These tech ETFs also broke down last week and are heading towards their 200-day SMAs.
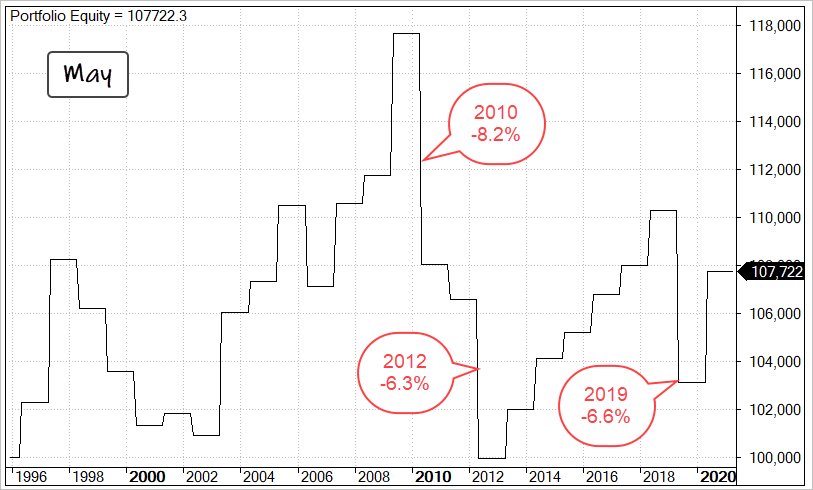
Even though energy, finance, industrials, materials and housing are still strong, they are also extended and ripe for corrective periods. Also keep in mind that the tech sector still accounts for 26.23% of the S&P 500 and is the biggest sector by far. Thus, weakness in tech will weigh on the S&P 500. And finally, I noted in last week’s seasonality report[1] that May and June are not strong months for the S&P 500. In addition, the S&P 500 fell six percent or more in May 2010, May 2012 and May 2019.
IJR Looks Shaky as IWM Fails
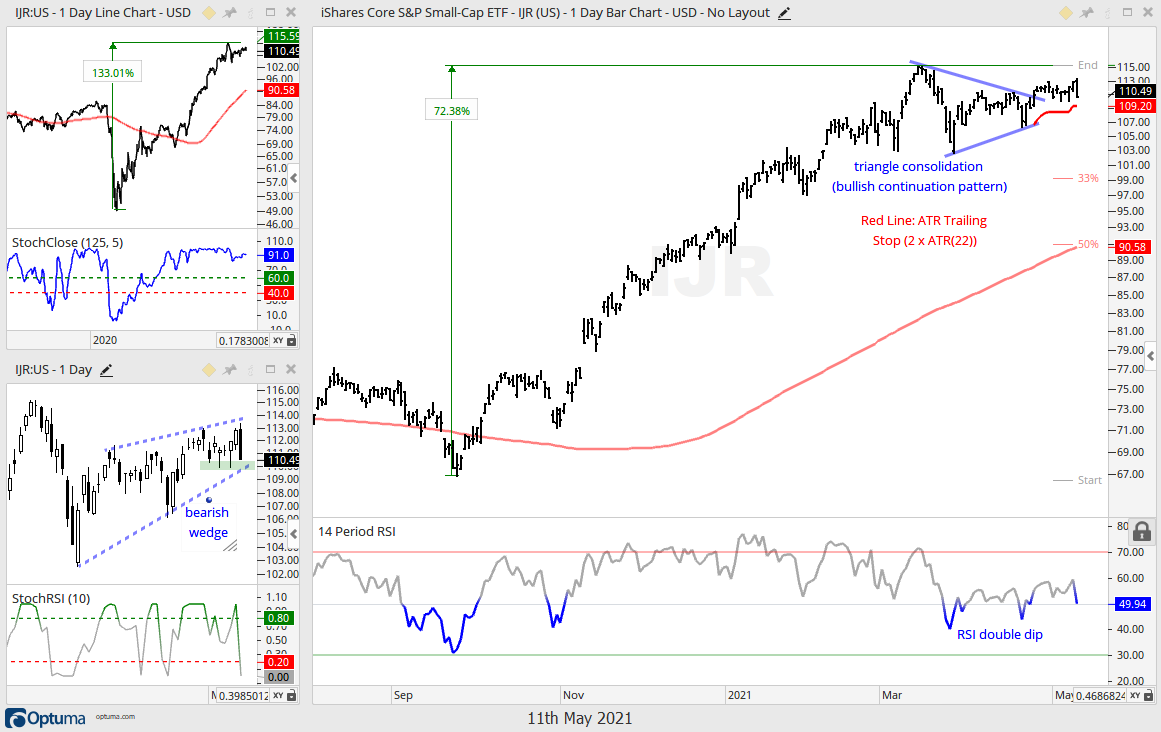
I noted the triangle breakouts in the S&P SmallCap 600 SPDR (IJR) and Russell 2000 ETF (IWM) two weeks ago and it looks like these will fail. The bar chart shows the triangle breakout in IJR and the ATR Trailing Stop at 109.20. This breakout is still holding, but I am concerned that a bearish wedge is now forming (see candlestick chart lower left). IJR fell sharply in mid March and then retraced a good portion of this decline with a rising wedge, which is a bearish continuation pattern. A break below last week’s low would confirm the pattern and argue for another leg lower. The bar chart shows that a 33% retracement of the prior advance (72%) would extend to the 99 area.
You can learn more about ATR Trailing stops in this post[2], which includes a video and charting option for everyone.
The next chart shows IWM failing to hold its breakout and breaking below the ATR Trailing Stop.
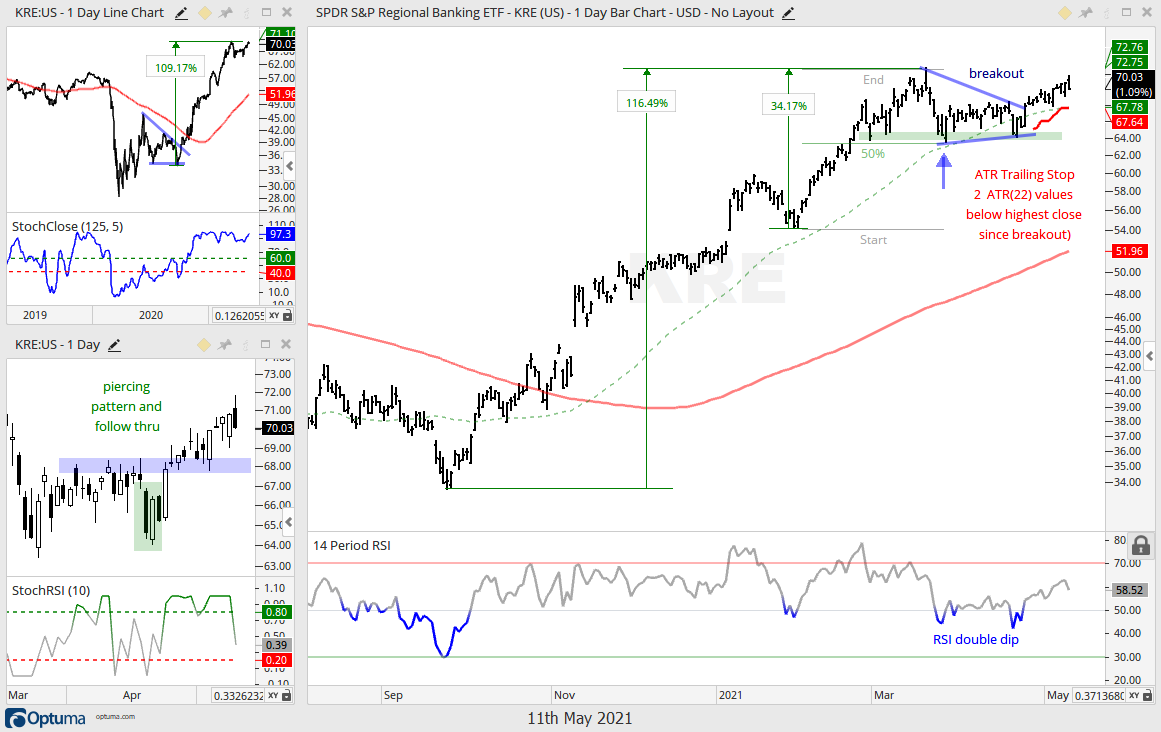
KRE Still Holding Breakout
The finance sector is important to IJR and IWM because it is the SECOND largest sector in for each ETF (17-18 percent according to ishares.com). Note that ETFDB.com lumps REITs with financials and shows financial services as the largest sector (24-25 percent). The devil is certainly in the details. The Regional Bank ETF (KRE) is holding its triangle breakout and the ATR Trailing Stop is at 67.64. This level also coincides with the breakout zone on the candlestick chart (blue shading). A close below 67.64 would trigger the stop and signal a failed breakout.
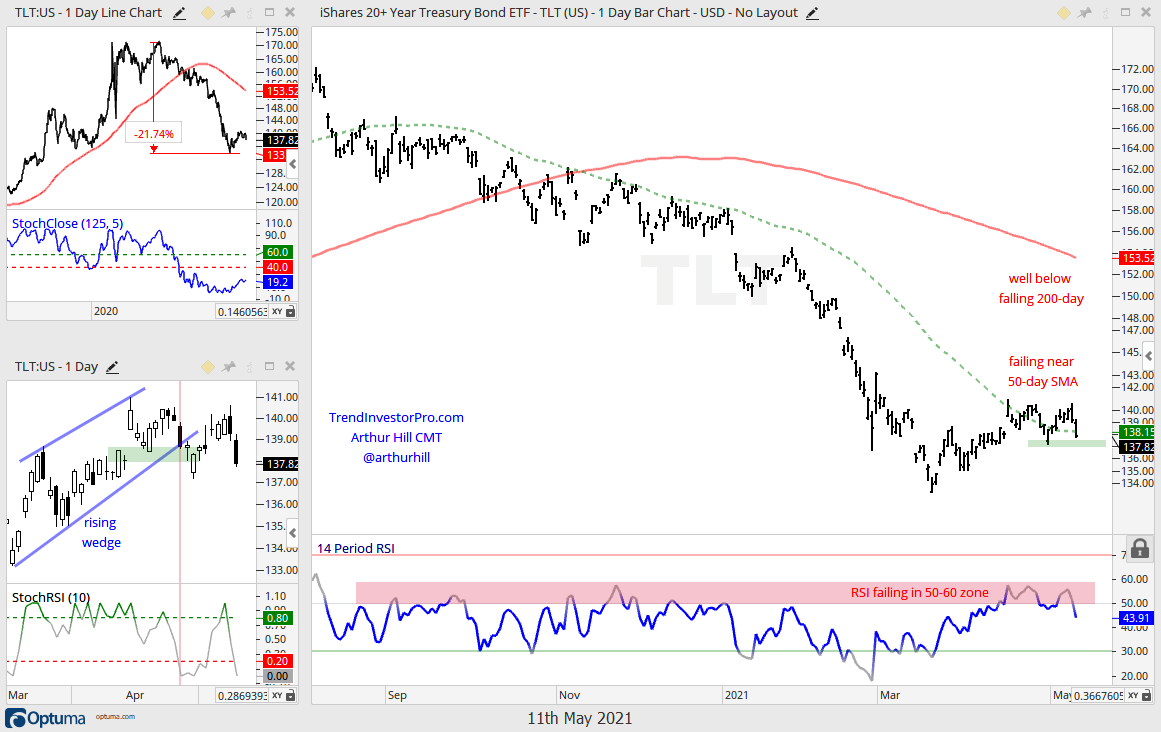
TLT Did Not offer a Safe Haven
The 20+ Yr Treasury Bond ETF (TLT) tanked along with the stock market on Monday. Treasury bonds are the natural alternative to stocks and also considered a relative safe haven. However, whiffs of inflation are in the air with the DB Agriculture ETF (DBA), DB Energy ETF (DBE) and DB Base Metals ETF (DBB) hitting new highs. Bonds loathe inflation because it means the real yields are lower (yield less inflation rate). The bar chart shows TLT in a long-term downtrend and well below the falling 200-day SMA. TLT got above the 50-day SMA in late April and early May, but the 50-day SMA is better suited as a mean-reversion indicator. In other words, start leaning bearish when price moves above the 50-day and is below the falling 200-day. Also notice that RSI is turning down in the 50-60 zone, which acts as momentum resistance in a downtrend.
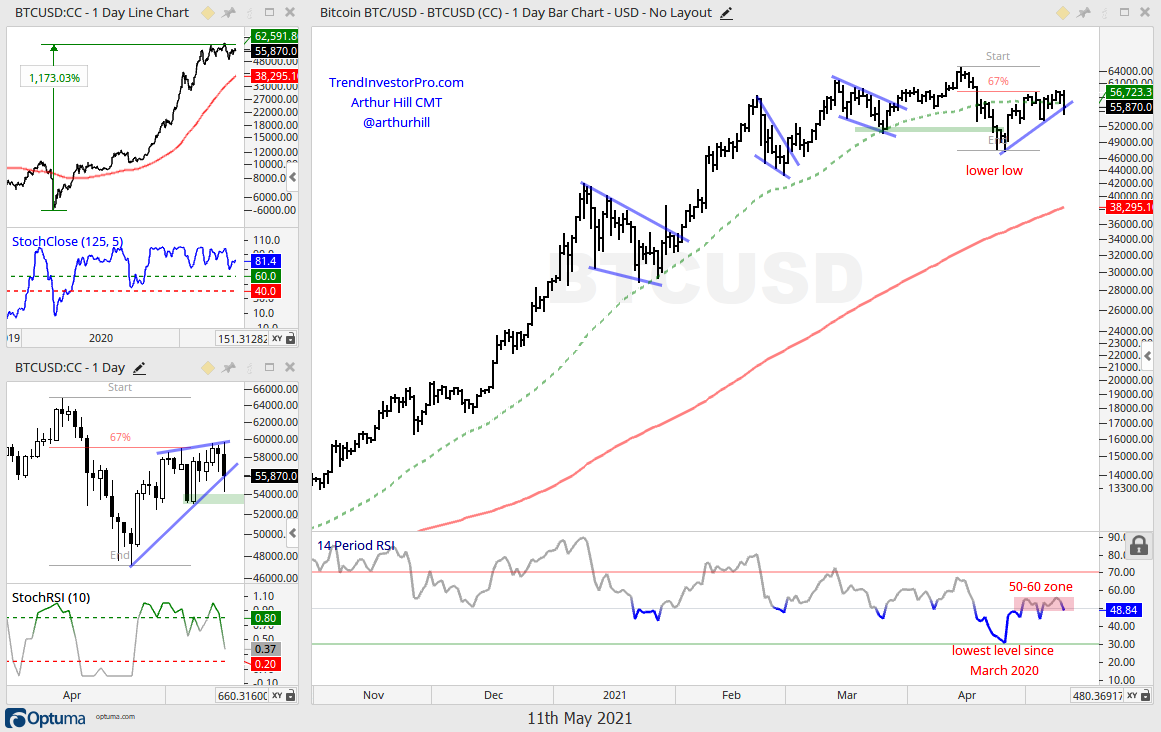
BitCoin Forms Bearish Pattern
I do not trade crypto or the crypto ETFs, but I follow the charts and am seeing a bearish setup in Bitcoin. The bar chart shows Bitcoin breaking the March low with a sharp decline in April. This decline pushed RSI to its lowest level (30.64) since March 2020. Thus, momentum accelerated on the decline. After breaking the low, Bitcoin bounced with a 2/3 retracement and formed a rising wedge on the candlestick chart. Both the retracement amount and pattern are typical for counter-trend bounces. Also note that RSI is stalling in the 50-60 zone, which acts as momentum resistance. As far as triggers, a StochRSI plunge below .20 would show a downward momentum thrust and a move below the early May low would break rising wedge support.