Sentiment Indicators Suggest Caution as Seasonally Weak Period Begins
Posted By
Arthur Hill, CMT
On
In
Archive |
No Comments
The next report will be on Wednesday, July 23rd.
Report Headlines
Seasonal Patterns Weak Into October
Smart Money vs Dumb Money
Call Volume is Getting Elevated
This report will focus on seasonal patterns and sentiment, but with a caveat. Seasonal patterns and sentiment are not the best market timing tools because they can reach extremes and remain at extremes. This is why we need to combine seasonality and sentiment with breadth and price action. We are entering a seasonally weak period for the stock market, smart money is turning cautious and call volumes are elevated. Stocks are up sharply since early April with some of the tech-related ETFs looking very frothy. The odds for a correction within the next three months are increasing so I will remain extra vigilant.
Seasonal Patterns Weak Into October
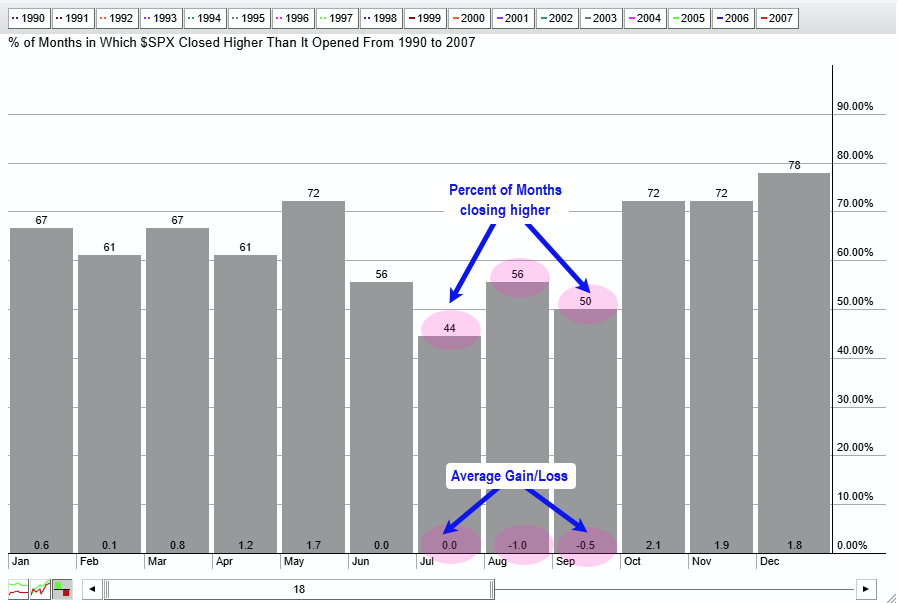
The three month stretch from July to September is historically the weakest period for stocks. The next chart shows S&P 500 seasonality from 1990 to 2007. July, August and September were the weakest months during this stretch.
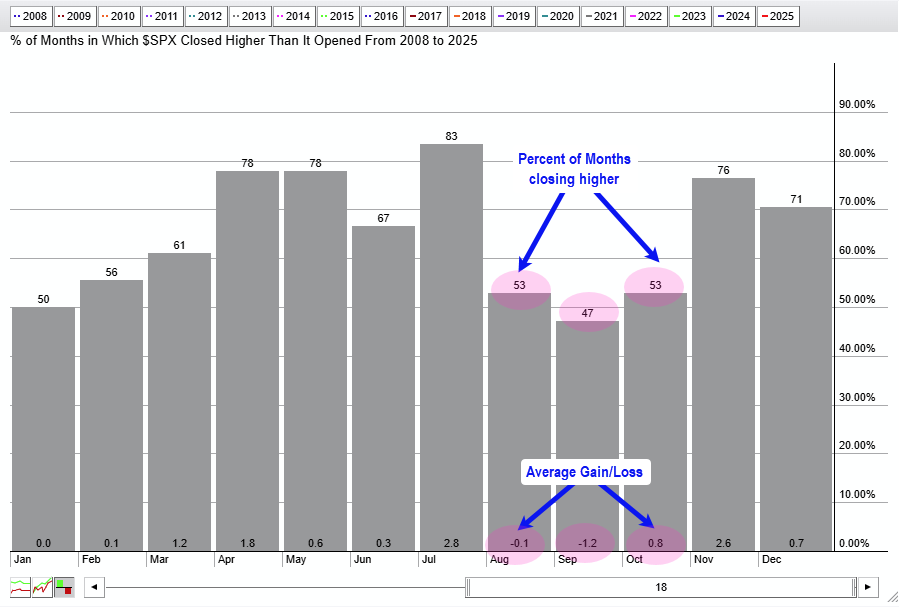
The next chart shows S&P 500 seasonal patterns from 2008 to 2025. There is a shift here with the weakest three month stretch extending from August to October.
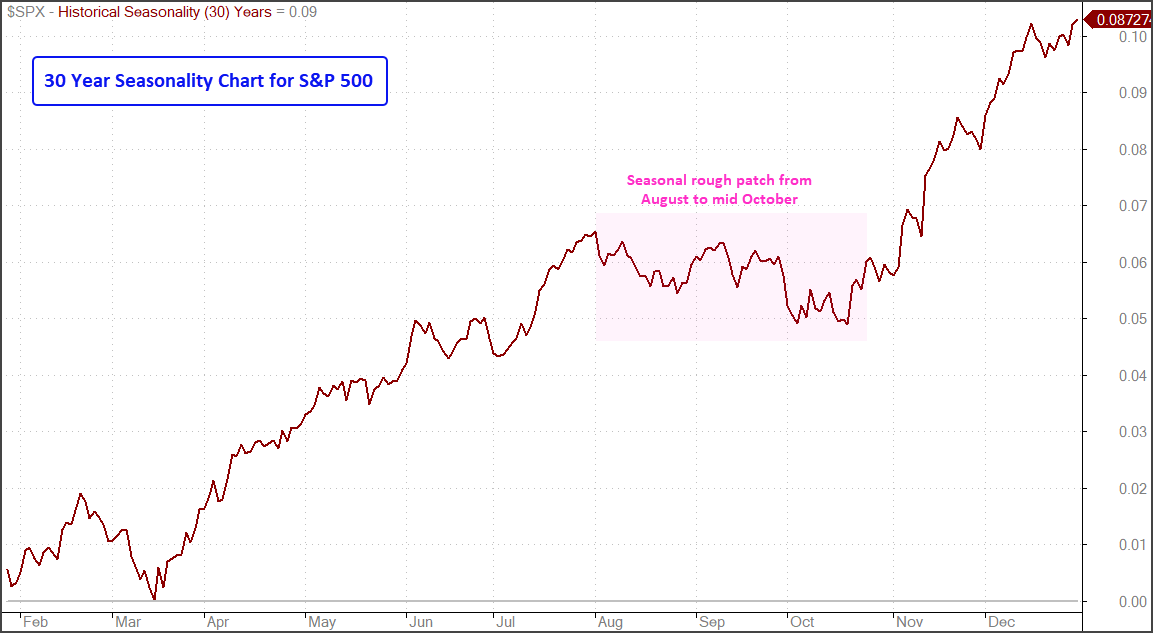
The next chart was made with Amibroker and shows the seasonal pattern over the last 30 years. The weakest stretch extends from August to mid October. Note that November and December are exceptionally strong months.
Smart Money vs Dumb Money
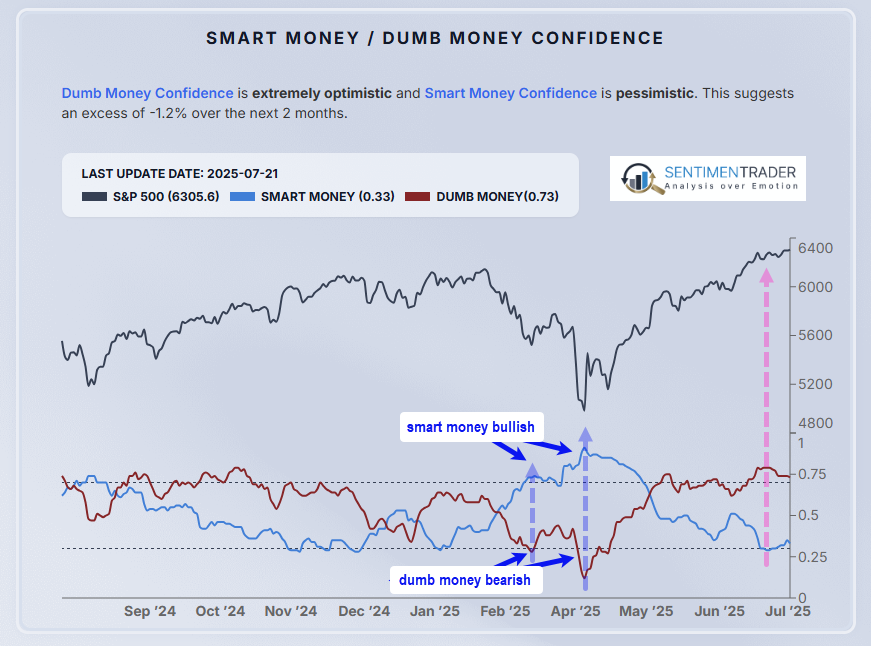
SentimenTrader[1] tracks Smart Money / Dumb Money Confidence and shows this chart on their home page. Smart money[2] refers to institutional activity, while dumb money[3] refers to retail traders/investors. In theory, institutions are “in the know” and have more resources than retail traders. In contrast, retail traders are often late to the party. They become excessively bullish near tops and bearish near bottoms. Don’t be offended by the term “dumb money”. Most of us are retail traders!
The chart below plots these two sentiment indicators: Smart Money is red and Dumb Money is blue. Readings above .75 show strong bullishness, while readings below .25 reflect strong bearishness. Notice that Smart Money was very bullish in April and Dumb money was very bearish. The tides turned over the last three months with Smart Money dipping below .25 in late June and Dumb Money above .75. This suggests that institutions are turning cautious as retail investors remain strongly bullish. As a contrarian indicator, the Smart Money / Dumb Money Confidence indicator is flashing a caution flag.
Call Volume is Getting Elevated
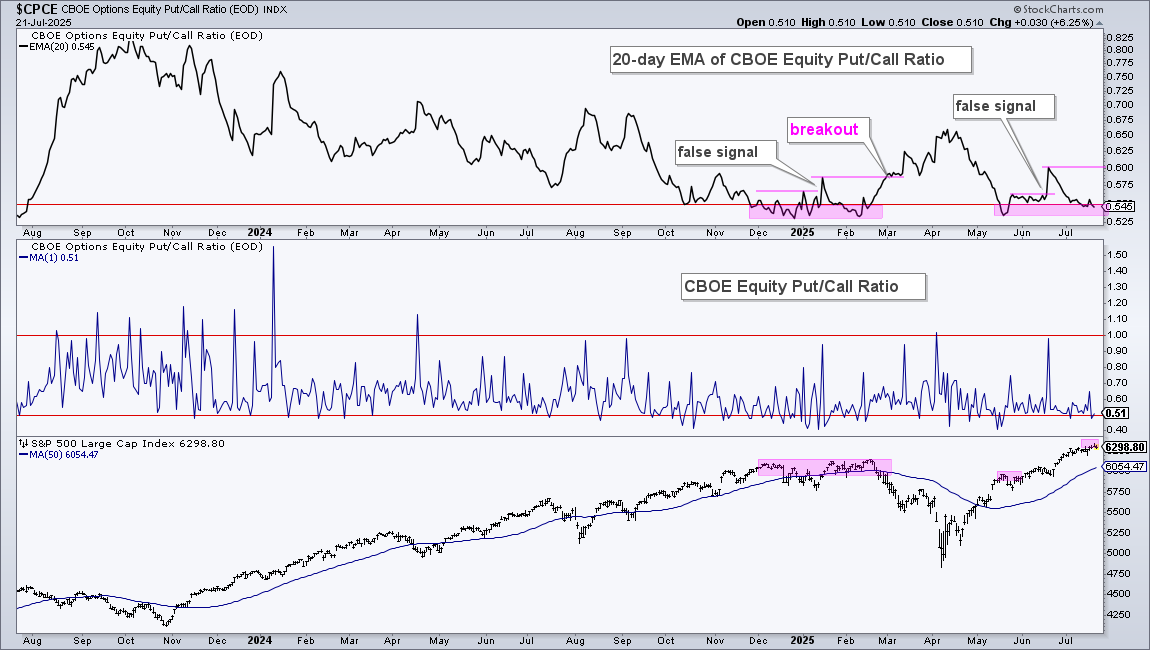
The CBOE Equity Only Put/Call Ratio is at relatively low levels, which suggests elevated call volume. Option traders buy calls when they expect the stock to rise, and puts when they expect the stock to fall. A reading above 1 means put volume exceeds call volume, and excessive put volume suggests excessive bearishness. As a contrarian indicator, excessive bearishness is considered bullish. Conversely, readings near .50 mean call volume is almost double put volume. Excessive call volume suggests excessive bullishness and this is considered bearish (from a contrarian standpoint).
The chart below shows the 20-day EMA of the CBOE Equity Put/Call Ratio dipping below .55 in July, which means call volume is getting elevated. Larry McMillan of the Option Strategist[4] notes that an upward breakout is needed to move from signs of excess to a bearish signal. There was a false breakout in January and then a breakout in late February, which foreshadowed the market decline into April. There was also a false breakout in June as the S&P 500 moved higher into July. Another setup is brewing and a breakout at .60 would trigger a bearish signal. In addition to this signal, I will be following McMillan’s signals.[4]
Send feedback to support(at)trendinvestorpro.com or use the contact form. [5]