Ranking and Grouping ETFs – Defensive and Risk-Off ETFs Suffer as Bull Market Broadens
Posted By
Arthur Hill, CMT
On
In
Archive |
No Comments
We have seen a pronounced shift over the last few weeks. ETFs that were lagging and in downtrends are breaking out and starting to lead. Conversely, ETFs that were leading a few months ago are correcting and lagging. Add ETFs that were already strong and leading to the mix, and we have the recipe for a broadening bull market in stocks.
The S&P MidCap 400 SPDR (MDY) and the Bank SPDR (KBE) joined the new high parade with breakouts and new 52-week highs this week. Meanwhile, the Real Estate SPDR (XLRE) broke below its August lows and the Gold SPDR (GLD) failed to hold last week’s breakout attempt.
In addition to a group of emerging leaders, we are also seeing new highs in several of the “old” leaders. SPY, QQQ, XLK, XLI, XLF and SOXX hit new highs again this week. The bull market reignited itself in early September when the Index Breadth Model turned net bullish (5 of 9 indicators) and has steadily improved the last two months.
With the stock market clearly in bull mode and participation broadening, this makes alternatives, such as bonds and gold, less attractive. Gold is also looking less attractive as the Dollar Bullish ETF (UUP) gets a mean-reversion bounce within an uptrend.
The only negative is the short-term overbought condition in several ETFs. Overbought, however, is a double-edged sword. Overbought conditions bode well for returns three to six months out, but increase the odds of a pullback when looking 1-3 weeks out.
I am still closely watching four tech-related ETFs that have lagged over the last three months. The Semiconductor ETF (SOXX) is still leading and the Cyber Security ETF (HACK) broke out with a big surge the last two weeks. The Internet ETF (FDN), Software ETF (IGV), Mobile Payments ETF (IPAY) and FinTech ETF (FINX) are still in downtrends, but the patterns look corrective and breakouts would be bullish. I also have my eye on XLY because it is holding its upswing breakout within the triangle consolidation.
Uptrend, Consolidation Breakout, New High
SPY, EFA, RSP, QQQ, XLK, XLB, SOXX
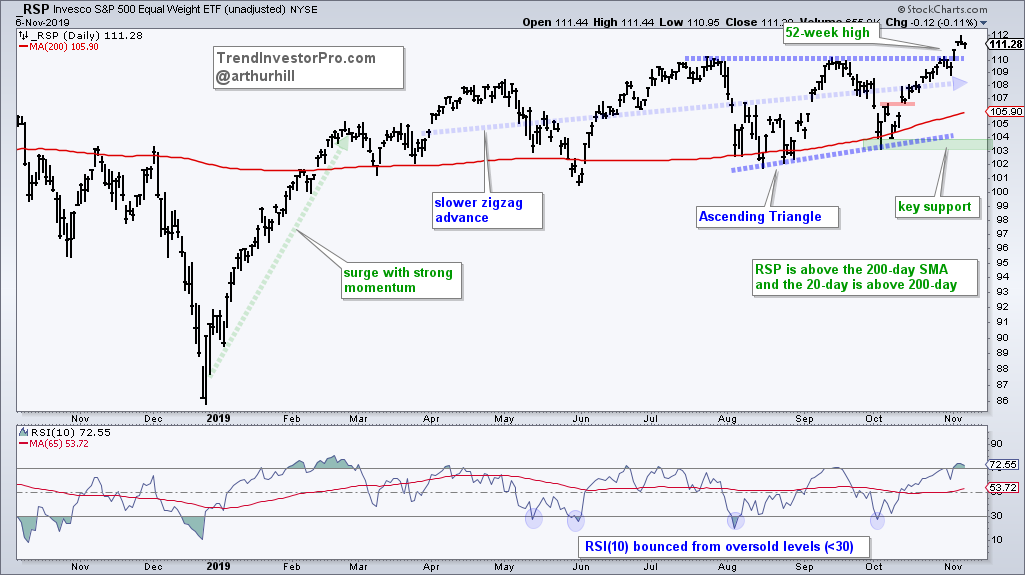
The bull market is broadening because the S&P 500 EW ETF (RSP) broke out with a surge last Friday and hit new highs this week. RSP has the same components as SPY, but RSP weights them equally to reflect performance for the “average” stock. A new high in this equal-weight index reflects broad strength within the S&P 500.
Even though I am highlighting the Ascending Triangle on the chart below, RSP has been zigzagging higher since March with a series of higher highs and higher lows. This is pretty normal price action after a surge with strong momentum (late Dec to late Feb). Momentum typically slows after such a surge, but the advance continues at a more sustainable rate.
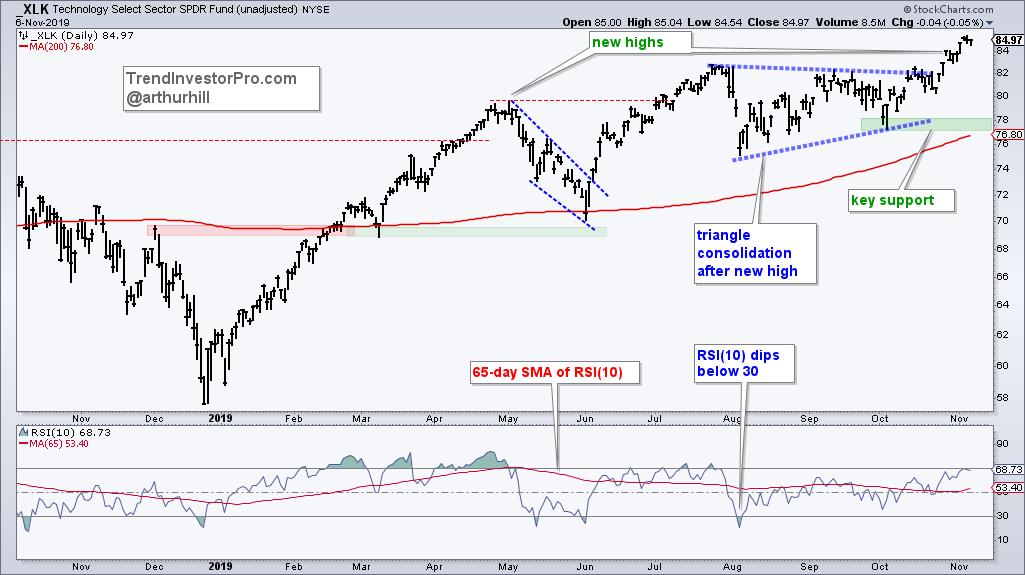
The Technology SPDR (XLK) is leading the sector SPDRs with a breakout in mid October, a new high on October 25th and more new highs in November. XLK accounts for around 22% of the S&P 500 and new highs in this big sector bode well for SPY. Also note that XLK is hitting these new highs without help from software (IGV), mobile payments (IPAY) and fin tech (FINX).
2) Uptrend (zigzag) and New High
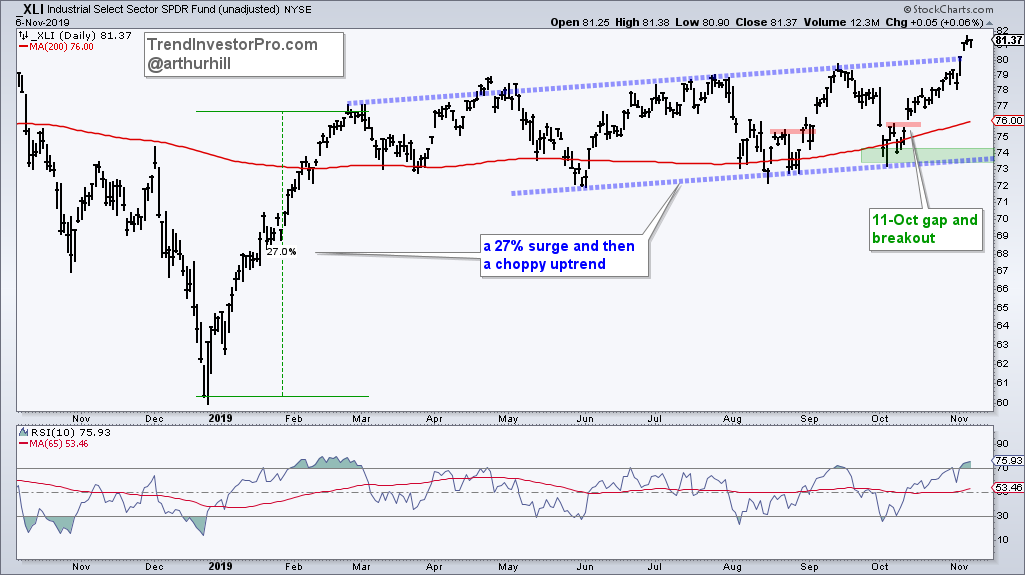
XLF, XLI, XLV
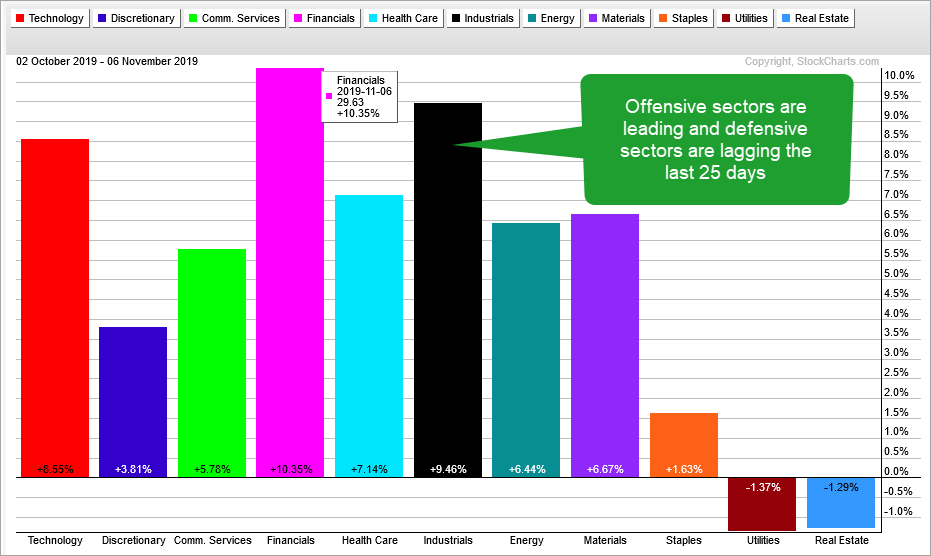
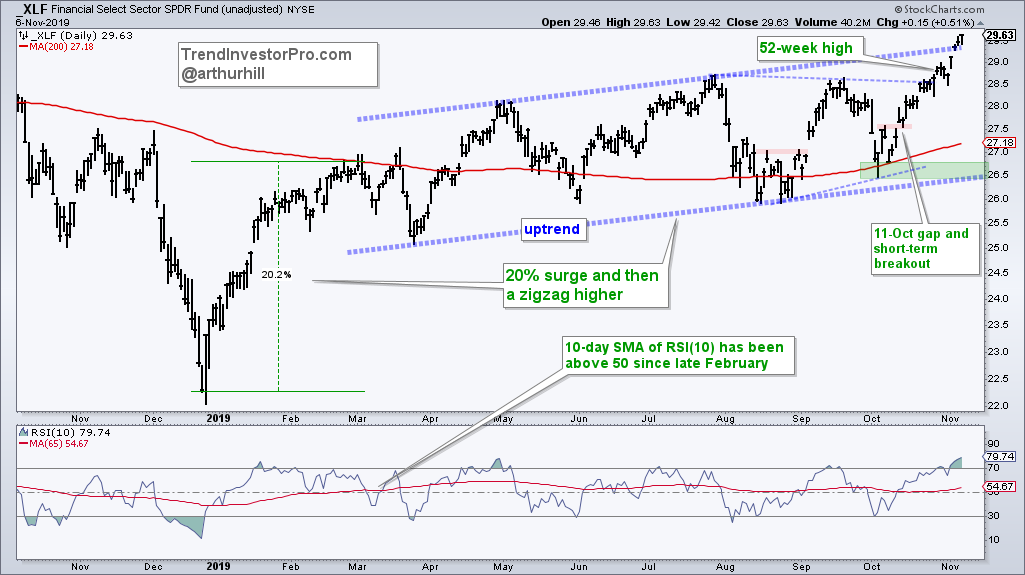
The Finance SPDR (XLF) and Industrials SPDR (XLI) are also leading because they hit new highs this week, and they are the sectors with the largest gains over the last 25 days. XLF is up 10.35% and XLI is up 9.46%. These sector leading gains may be surprising, but the new highs are not because these two were already in uptrends and broke short-term resistance levels with gaps on 11-Oct. Double digit gains and short-term overbought conditions warrant caution short-term (a few weeks), but bode well for the medium-term (a few months).
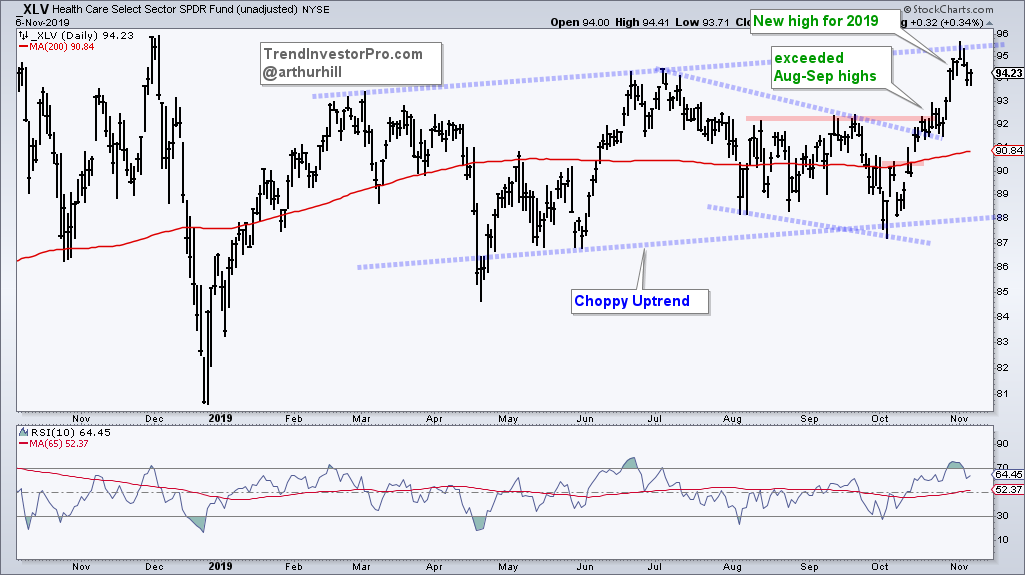
The Healthcare SPDR (XLV) hit a new high for 2019 and is currently less than 2% from a 52-week high. I am also classifying this ETF in group 2 with a zigzag uptrend because it has been in place since March with higher highs and higher lows. XLV is the fourth best performing sector over the last 25 days with a 7.14% gain. Again, XLV is short-term overbought and vulnerable to a corrective period, but the big trend is up and short-term momentum thrust bodes well longer-term. I highlighted Abbot Labs (ABT) last Saturday and this chart still looks good.
3) Steady Uptrend, but Short of New High
ITB, XHB, PFF
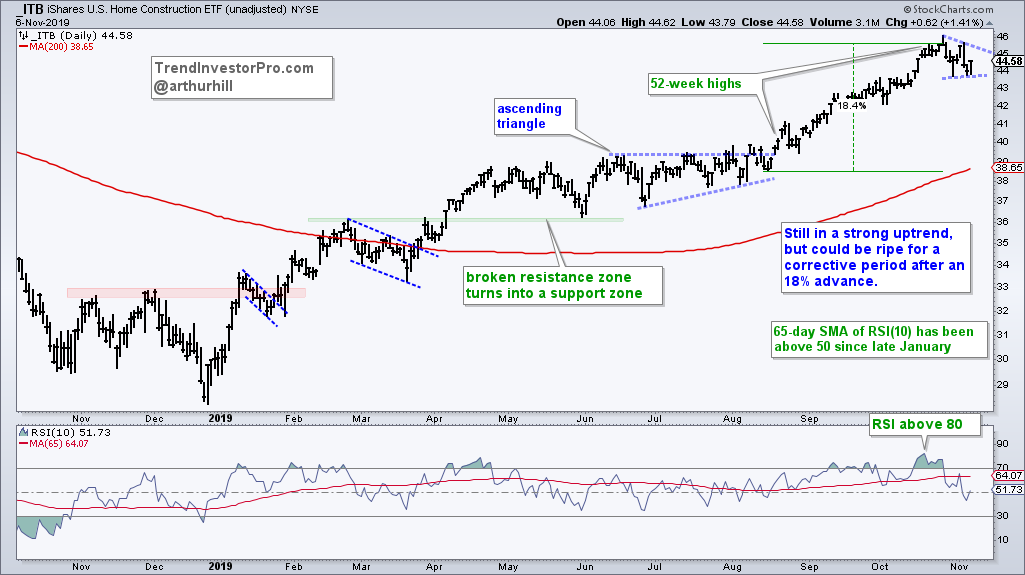
Even though the three ETFs in group three did not hit new highs this week, they are in uptrends overall and simply corrected with very mild pullbacks the last eight or so days. The Home Construction ETF (ITB) became short-term overbought in mid October as RSI(10) moved above 80 and stalled out the last two weeks. ITB was, perhaps, in the same situation as XLI, XLK, XLV and XLF are in now: long-term bullish, but short-term extended and ripe for a rest.
4) Uptrend, Short-term Bullish Pattern, Upturn
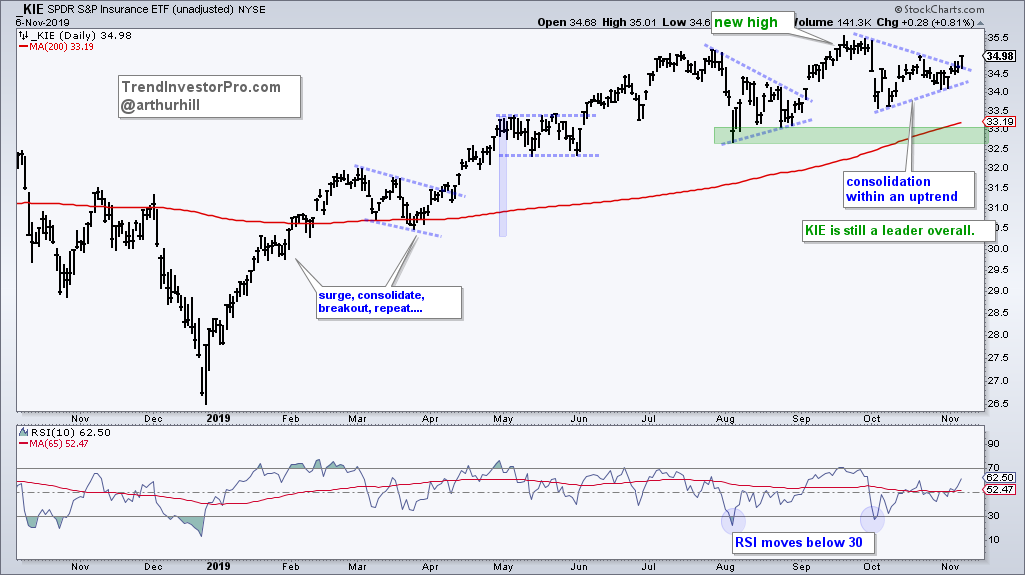
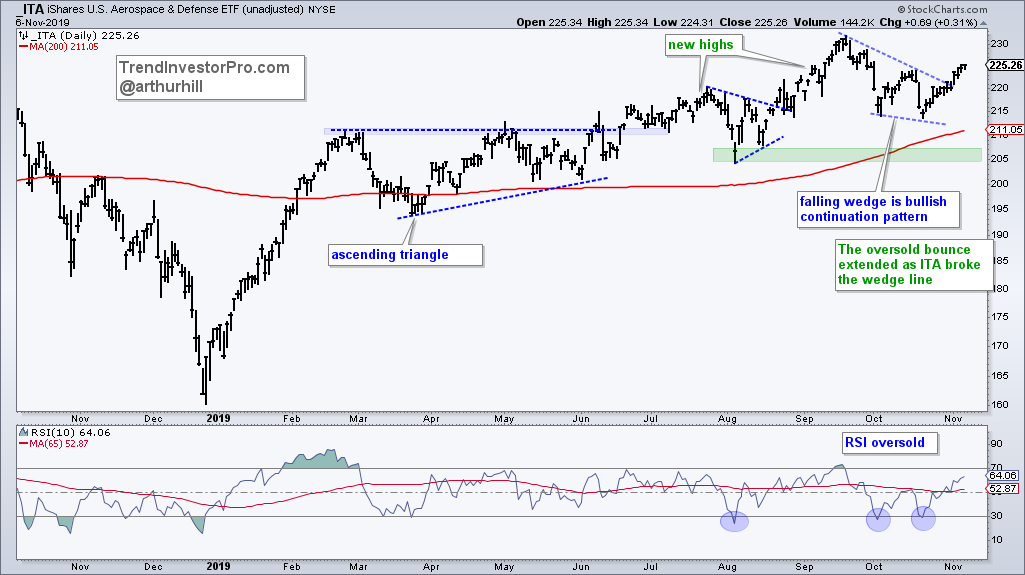
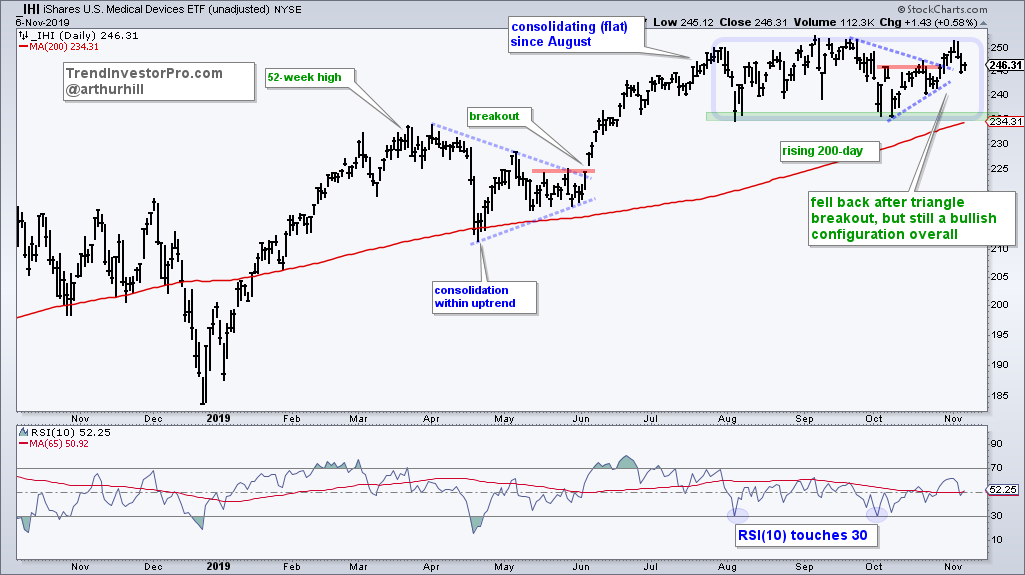
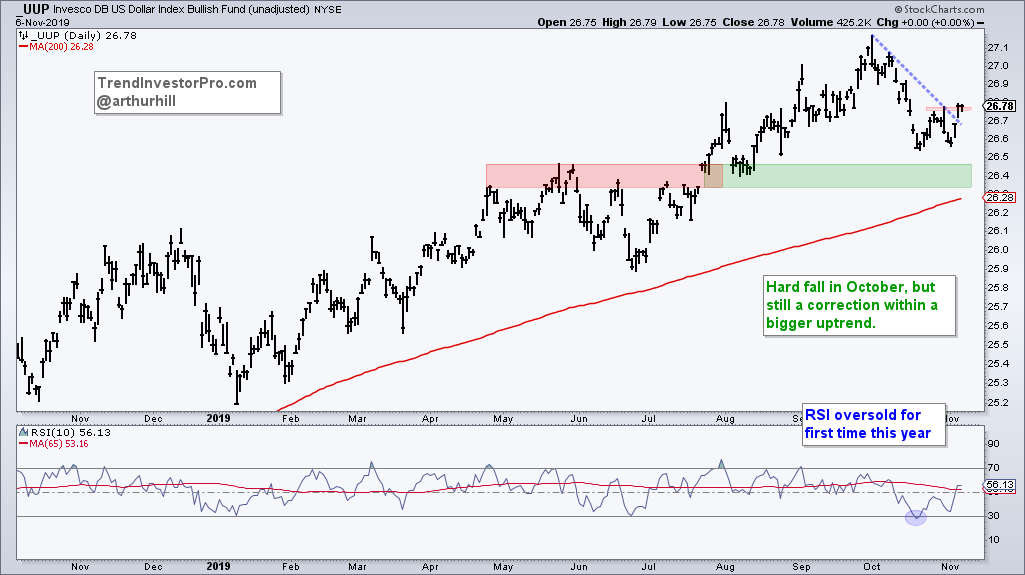
KIE, ITA, IHI, VIG, UUP
The next group of ETFs have been in uptrends for months and recently turned up after a short-term correction. The Insurance ETF (KIE) formed a triangle consolidation and broke out, the Aerospace & Defense ETF (ITA) formed a falling wedge and broke out, and the Medical Devices ETF (IHI) broke out of a triangle last week. The triangle and wedge are classic consolidations within an uptrend and the breakouts signal a continuation of the uptrend. IHI remains stuck in a larger consolidation, but is within 2% of a 52-week high and by no means weak.
In contrast to a bullish continuation pattern, the Dollar Bullish ETF (UUP) became short-term oversold as RSI(10) dipped below 30 and turned up. The three ETFs above became short-term oversold in October, and then the patterns unfolded. We never know what course a mean-reversion bounce will take or if it will be successful. The strategy is to become interested when the long-term trend is up and RSI(10) dips below 30. The signal triggers when RSI moves above 30 or we see a bullish catalyst on the price chart. RSI turned up in mid October and UUP broke the late October high this week. This is bullish and an upturn in the Dollar could be negative for gold, silver and GDX.
5) Breakout and New High
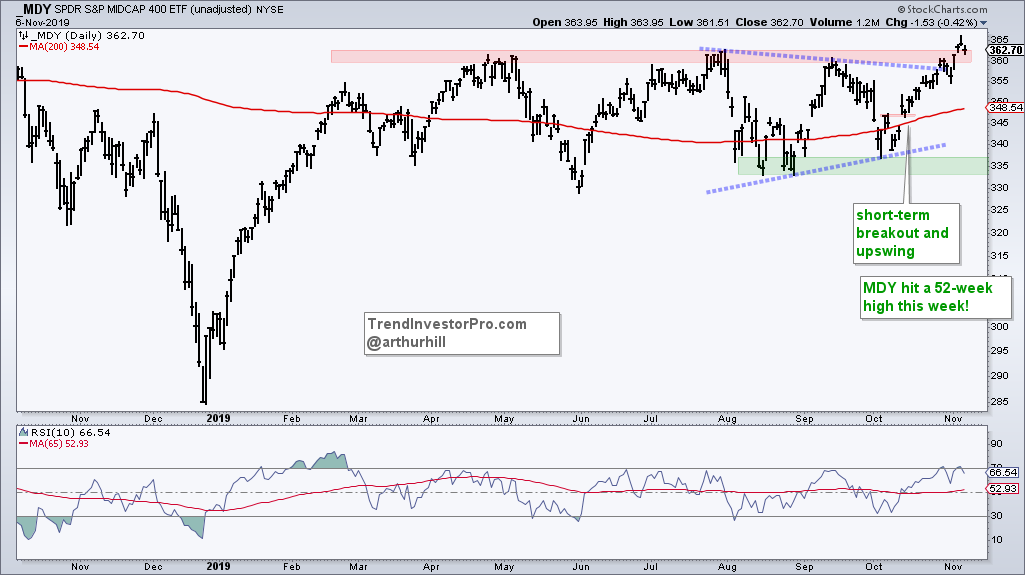
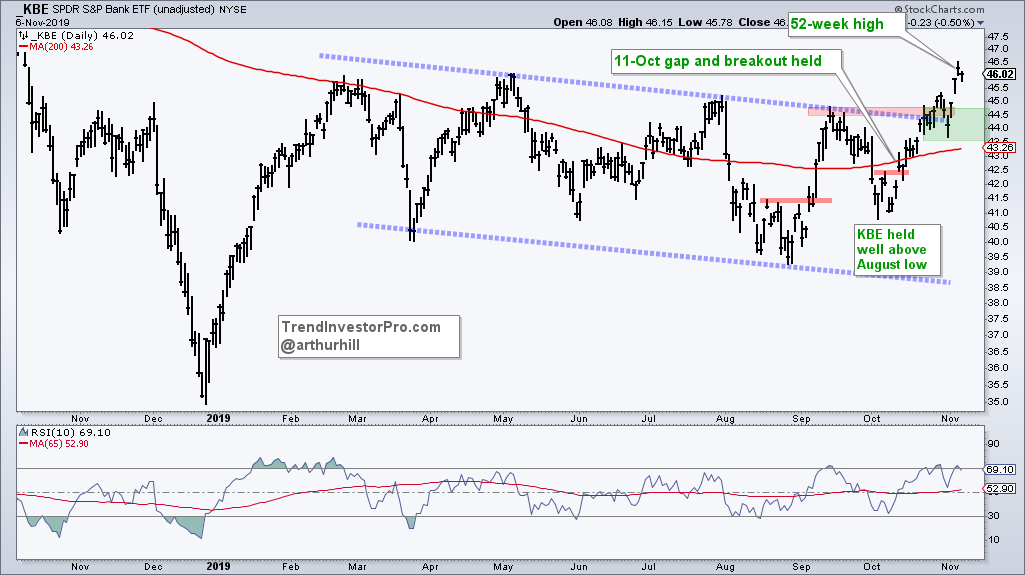
MDY, KBE
The S&P MidCap 400 SPDR (MDY) and Bank SPDR (KBE) stand out from their counter-parts because they broke resistance zones and recorded 52-week highs. In contrast, the S&P SmallCap 600 SPDR (IJR), Russell 2000 ETF (IWM) and Regional Bank ETF (KRE) remain short of new highs.
The chart below shows MDY surging from late December to late February and then embarking on a long trading range. The range narrowed from August to October and the ETF broke out with a move to new highs the last two weeks. As with RSP above, the breakout in MDY means the bull market is broadening and this is bullish.
KBE showed relative strength in October with a higher low and reversed its falling channel with a breakout over the last few weeks. The ETF is up over 10% the last 25 days and short-term overbought. While the momentum thrust and overbought condition are medium-term bullish, short-term caution is warranted because the odds of a corrective period are high. The breakout zone in the 43.5-44.5 marks first support to watch should we see a pullback.
6) Uptrend, Consolidation, Short of New High
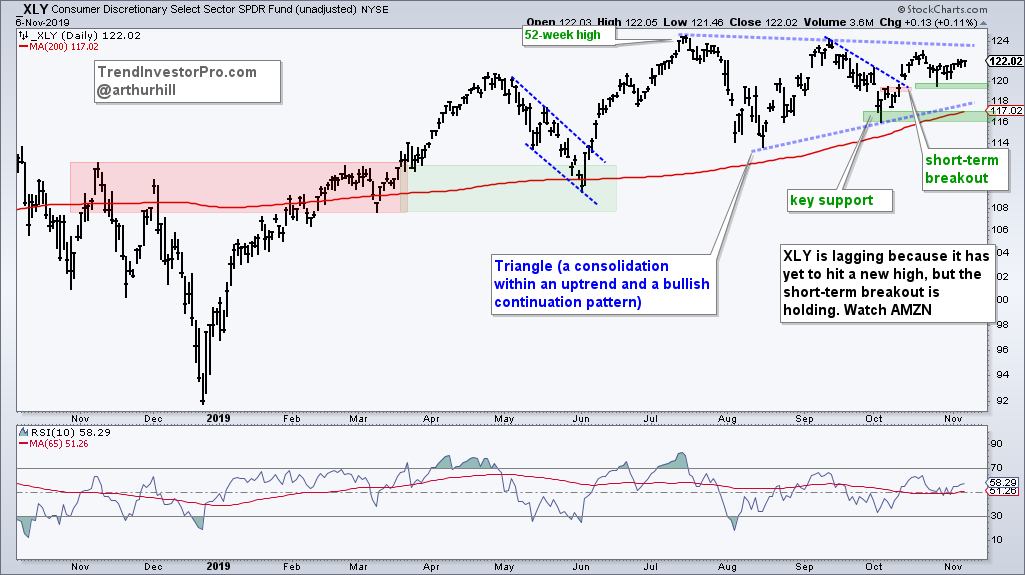
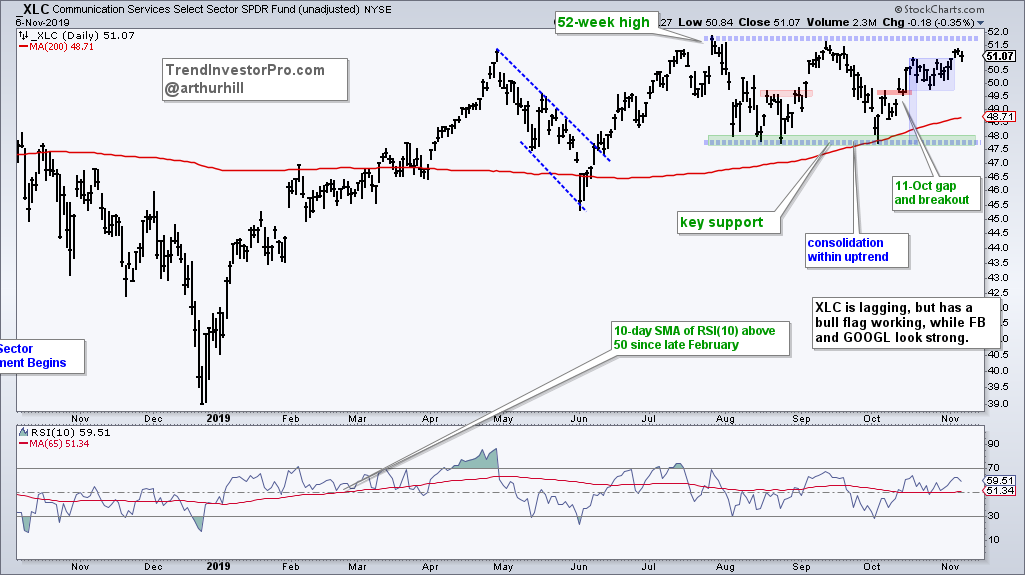
MTUM, XLY, XLC, HYG
The Consumer Discretionary SPDR (XLY) and Communication Services SPDR (XLC) are big sectors that each account for around 10% of the S&P 500. They are also two offensive sectors that remain short of breakouts, but I expect breakouts and new highs for three reasons. First, we are in a bull market environment and this means bullish resolutions are more likely than bearish resolutions. Second, the long-term trends are up and the ETFs are consolidating within these uptrends. Third, the swing within the consolidation patterns is up. XLY is holding its mid October gap-breakout and XLC broke out of a bull flag.
The emerging leadership group is the second biggest group in this week’s ranking and reflects the recent broadening of the bull market. As you will see next, the “correction within uptrend” group is the largest as defensive groups, gold and bonds extend their corrections.
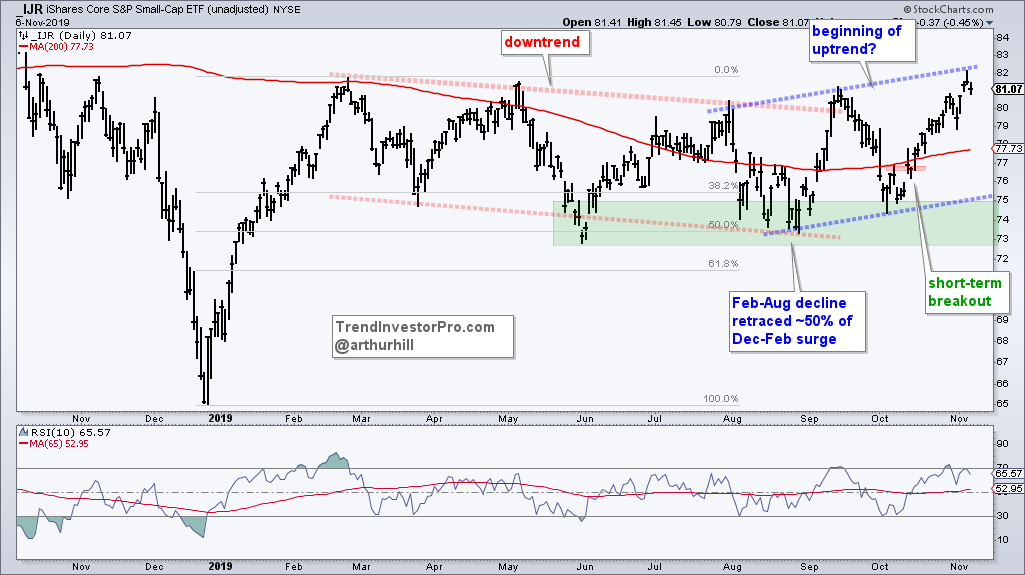
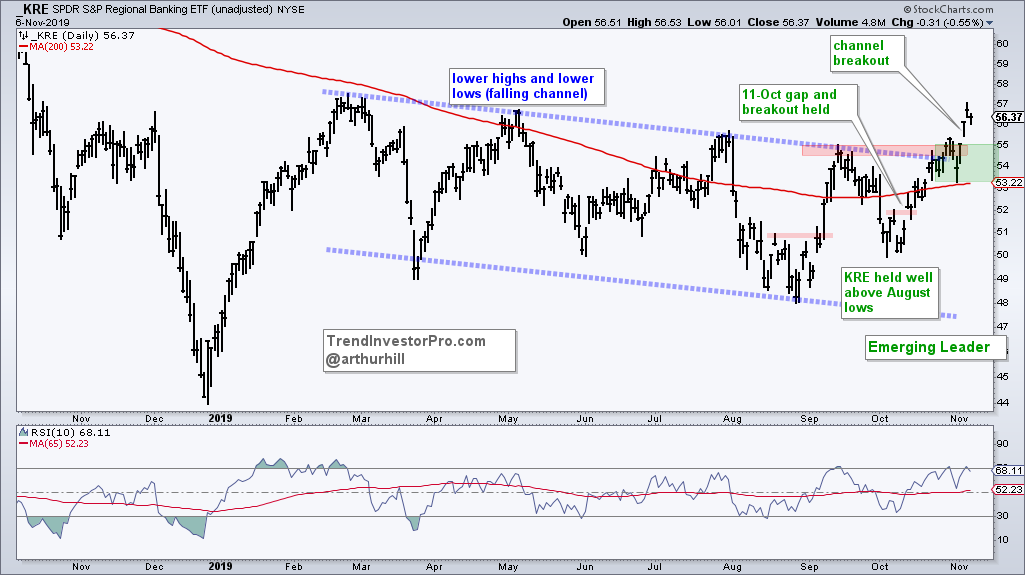
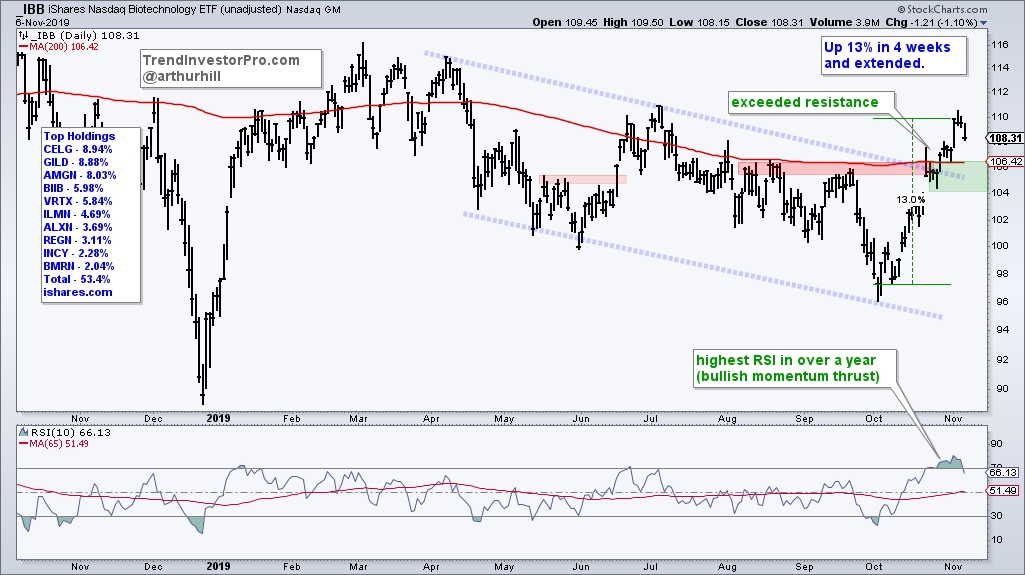
The emerging leadership group is still emerging because these ETFs remain well short of 52-week highs and their uptrends are not as established. Nevertheless, it is positive to see the S&P SmallCap 600 SPDR (IJR), Retail SPDR (XRT), Regional Bank ETF (KRE) and Biotech ETF (IBB) with breakouts and uptrends.
The first chart shows IJR trending higher since June, yes, June. The low was in early June as the ETF formed higher lows in August and October. Throw in higher highs in September and November, and we have an uptrend in this small-cap ETF.
The Regional Bank ETF (KRE) broke out of its falling channel with a 12% surge the last 25 days. The momentum thrust is bullish for the next few months, but we could see a correction or rest in the next few weeks. The green zone marks first support to watch on a pullback.
The Biotech ETF (IBB) surged some 13% on its way to a channel breakout and then fell back the last three days. Picking support after such a surge is a challenge and a guestimate. For now, I am using the breakout zones to mark first support. Chartists can also watch RSI(10). Sometimes we do not get a dip below 30 for a true short-term oversold condition. We may want to be on alert for a mean-reversion setup when/if RSI nears the 40 area.
Now we get to the weaker part of the ETF universe. ETFs that declined over the last few weeks or months are not partaking in the stock market advance and lagging. The degree of lagging, steepness of the decline or type of correction may vary, but there is no denying that these ETFs are not benefitting from a broadening bull market. Unsurprisingly, Utilities, REITs, precious metals, and bonds are in this group.
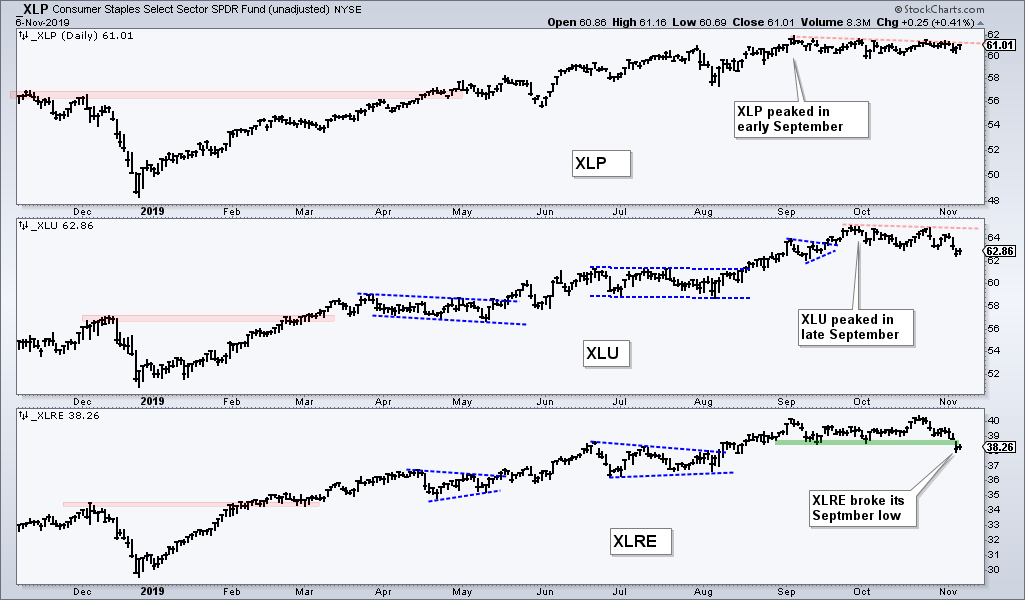
The Utilities SPDR (XLU) moved below its October low, while the Real Estate SPDR (XLRE) moved below its September low. The Consumer Staples SPDR (XLP) peaked first in early September and edged lower the last nine weeks. Even though these declines are not drastic and the long-term trends are still up, there are clearly stronger ETFs out there and these defensive sectors have gone out of favor.
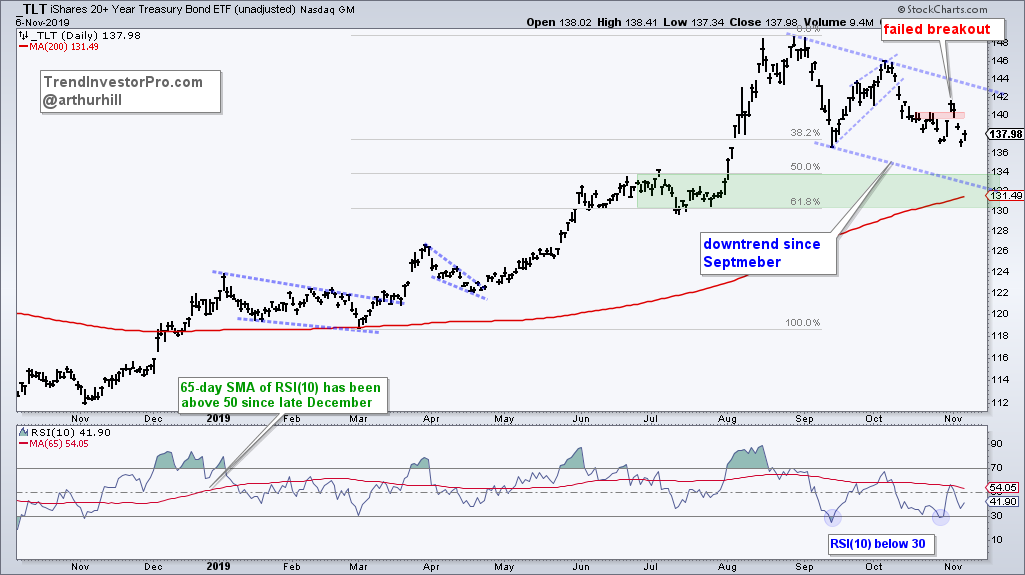
The 20+ Yr Treasury Bond ETF (TLT) peaked in early September after a huge advance from March to August, and a blow-off top in August. A corrective period was expected after the August surge and it appears that this correction remains in play. I thought TLT was breaking out last week, but this breakout failed to hold as the ETF fell below last week’s low. The green zone marks my target in the 130-134 area.
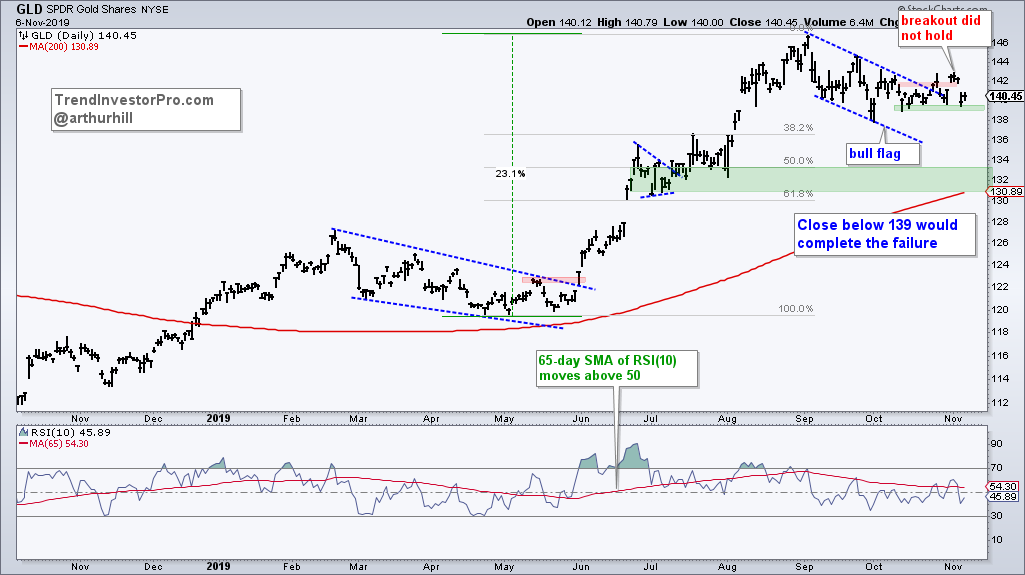
The Gold SPDR (GLD) surged some 23% from May to August and hit a new high. The ETF then embarked on a correction that formed a falling flag, which is typically bullish. It looked like GLD was breaking out with a move above the flag line on October 25th and another surge last week, but the ETF fell back hard on Tuesday. This breakout is in jeopardy and further weakness below 139 would mark a complete failure. I would then target a move to the low 130s.
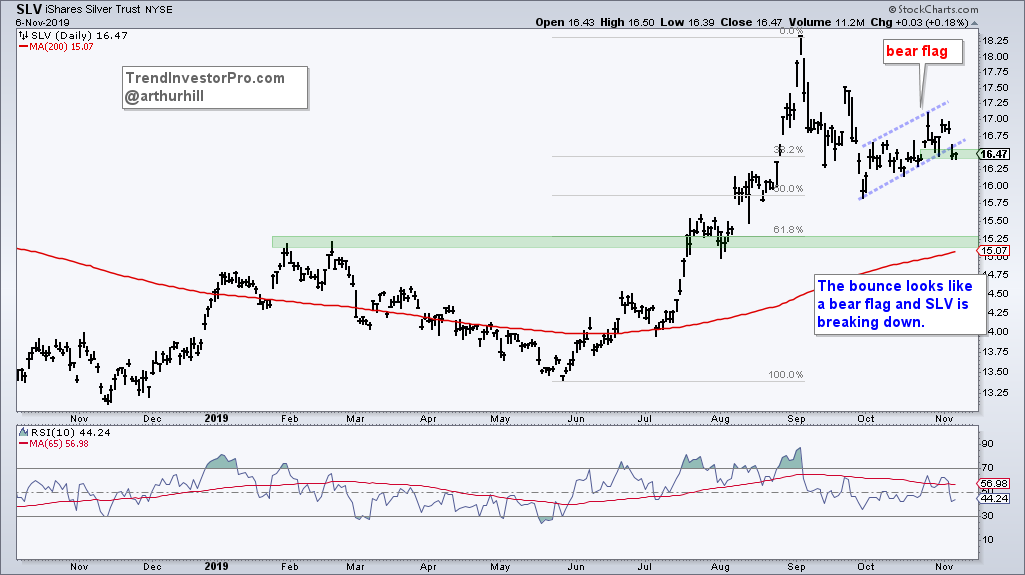
The next chart shows the Silver ETF (SLV) with a different perspective. I replaced the falling wedge and breakout with a rising flag and breakdown. SLV fell sharply from early September to early October and then rebounded in October with a rising flag, which is a bearish continuation pattern. SLV is in the process of breaking flag support to signal a continuation lower. The downside target is in the 15.25 area.
9) Extended Correction (3+ month Downtrend)
SKYY, FINX, FDN, IPAY, IGV
The next group of ETFs peaked ahead of the broader market and have yet to reverse their downtrends. Even though these downtrends could still be corrections, they have also extended more than three months and we have yet to see breakouts. I put this group below the prior group because their corrections/downtrends are longer. Note however, that the prior group (GLD, TLT …) could correct for another month.
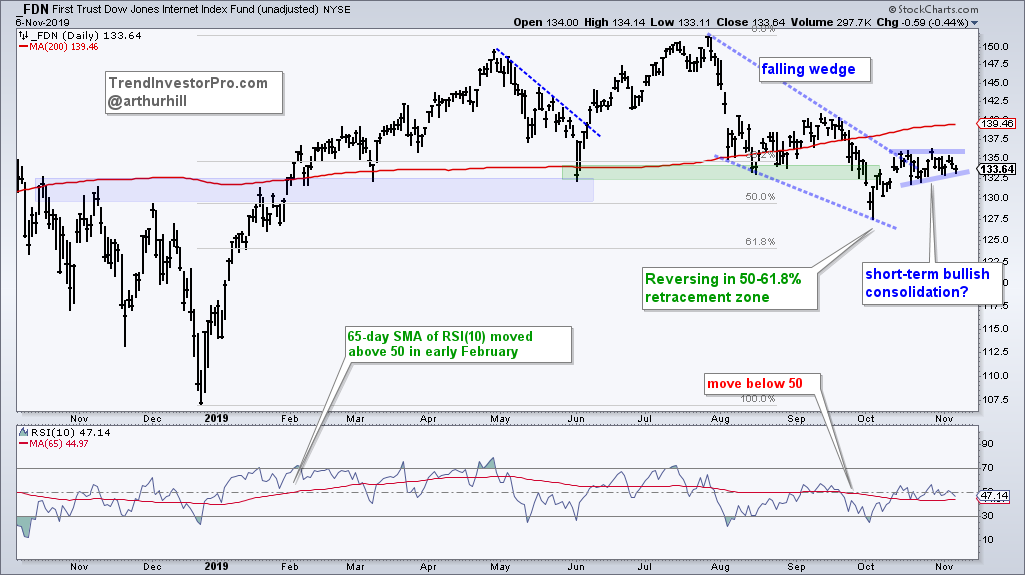
The Internet ETF (FDN), Mobile Payments ETF (IPAY), FinTech ETF (FINX) and Software ETF (IGV) remain the most interesting of this group. FDN showed some relative strength because it held well above the early October low in late October by forming a short-term consolidation, which looks like a bullish continuation pattern. A breakout at 137 would be bullish.
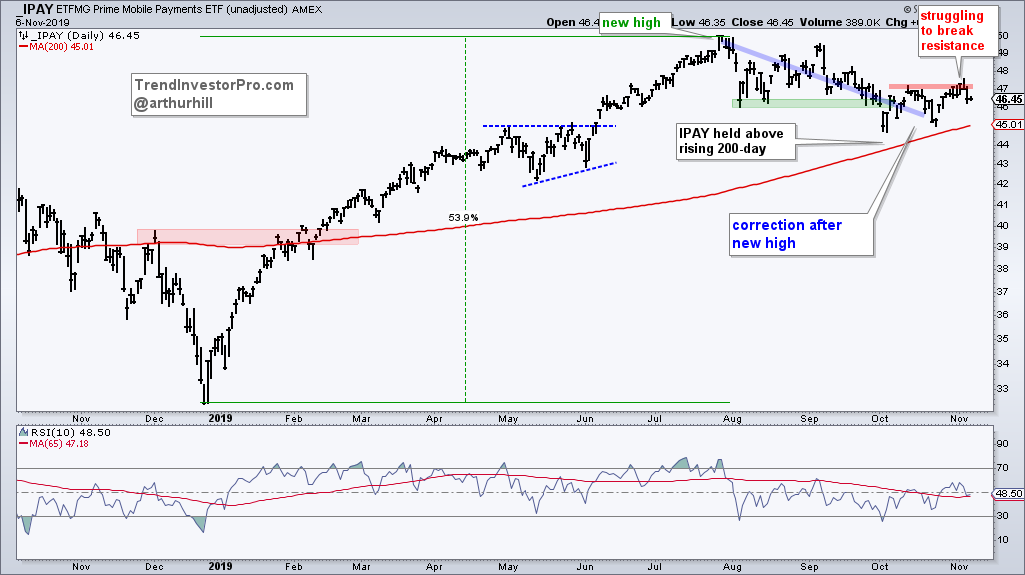
IPAY held above the 200-day SMA during its pullback, but the decline did not form an easily identifiable corrective pattern, such as a falling wedge or channel. Nevertheless, the three month decline looks corrective and I am watching for a breakout. The ETF attempted a breakout last week, but failed. Another push above 47.5 would break resistance and reverse this three month slide.
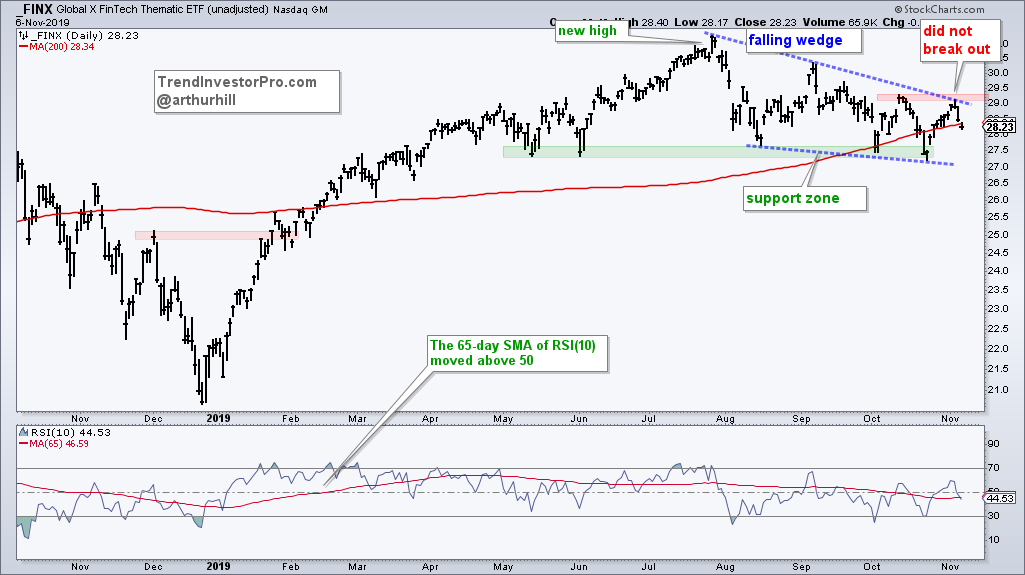
In contrast to IPAY, FINX formed a clear falling wedge that retraced around 38% of the prior advance. The pattern and retracement are typical for corrections. Moreover, the ETF established support in the 27.5 area with lows in May, June, August and October. Look for a break above the mid October high to reverse the three month slide.
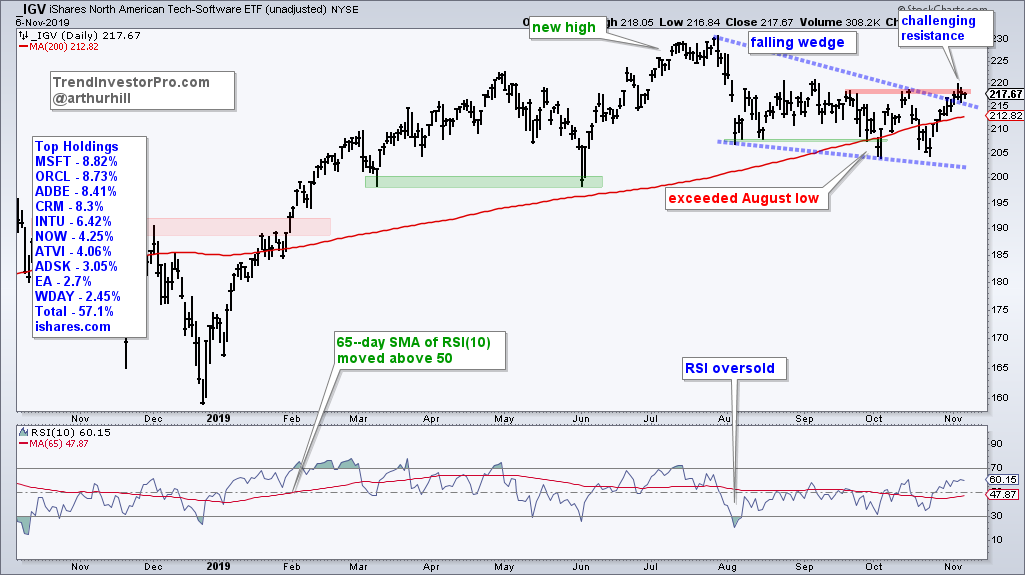
IGV also has a falling wedge working and the ETF broke above the upper line last Friday. Resistance from the mid October high remains so I am looking for a little follow through here. Note that IGV held above the early June low in October and is back above the rising 200-day with the recent bounce.
10) Downtrends and Lagging
XME, TAN, XLE, MJ, XBI, FCG, XES, XOP, AMLP, REMX
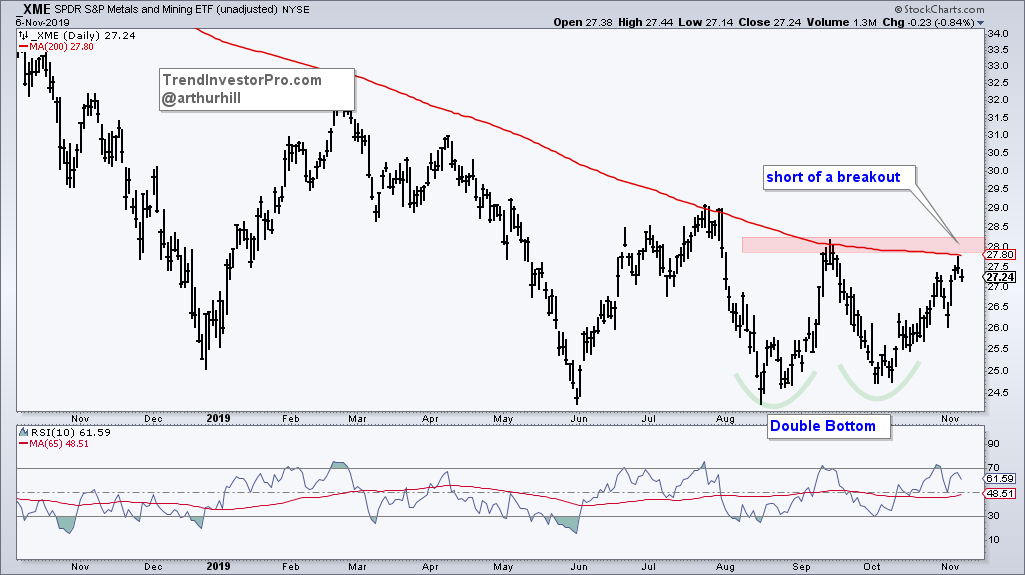
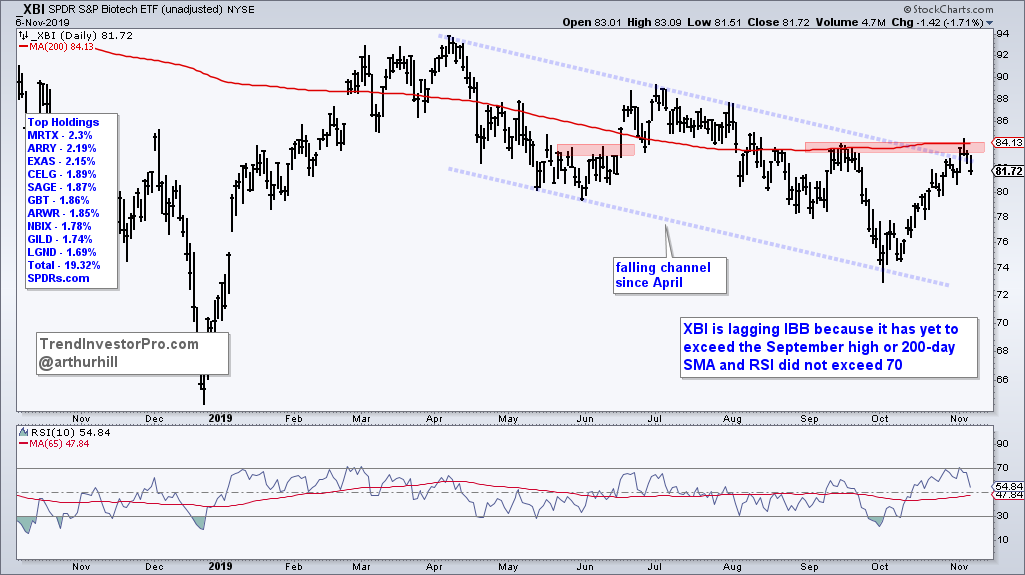
The Metals & Mining SPDR (XME) and the Biotech SPDR (XBI) are the strongest of this group because they are the closest to resistance. XME has been range bound the last three months and is near range resistance with the bounce over the last five weeks. A break above resistance would confirm the Double Bottom and reverse the downtrend. XBI is lagging its big brother, IBB, because it has yet to break the September high or 200-day SMA. Nevertheless, the October low held well above the December low and the falling channel could be a big correction. A break above resistance would reverse this seven month decline.
Bottom Line
We saw a big shift within the stock market and this may also be affecting non-stock ETFs, such as TLT and GLD. ETFs representing defensive groups within the stock market edged lower over the last one-two months, while a new group of leaders emerged. These new leaders join the old leaders to show a broadening of the bull market in stocks.
Bonds and gold joined the shift away from defensive groups because they represent alternatives to stocks, at least that is my interpretation. Regardless of the reasoning, gold and bonds are still in corrective mode and these corrections may have further room to run.
My eyes are on the Consumer Discretionary and Communication Services SPDRs. This is not because they are lagging, but because they may be poised to play catchup and are not short-term overbought. The same goes for the four tech-related ETFs in group 8 (extended corrections). These were the darlings of the stock market this summer, but they have not participated in the broad market advance move over the last two months.