Posted By
Arthur Hill, CMT
On
In
Archive |
No Comments
Even though junk bonds bounced and the most oversold ETFs surged this week, the high beta end of the stock market continues to look shaky and this reflects risk aversion. Today’s commentary will look at relative weakness in Advance-Decline Percent for QQQ and QQQJ. We will then show the big pop, drop and bounce in some high beta ETFs. Some are still holding Tuesday’s gaps and breakouts, but I am seeing risk aversion and this looks like a good time for defense instead of offense.
Participation Drags for QQQ
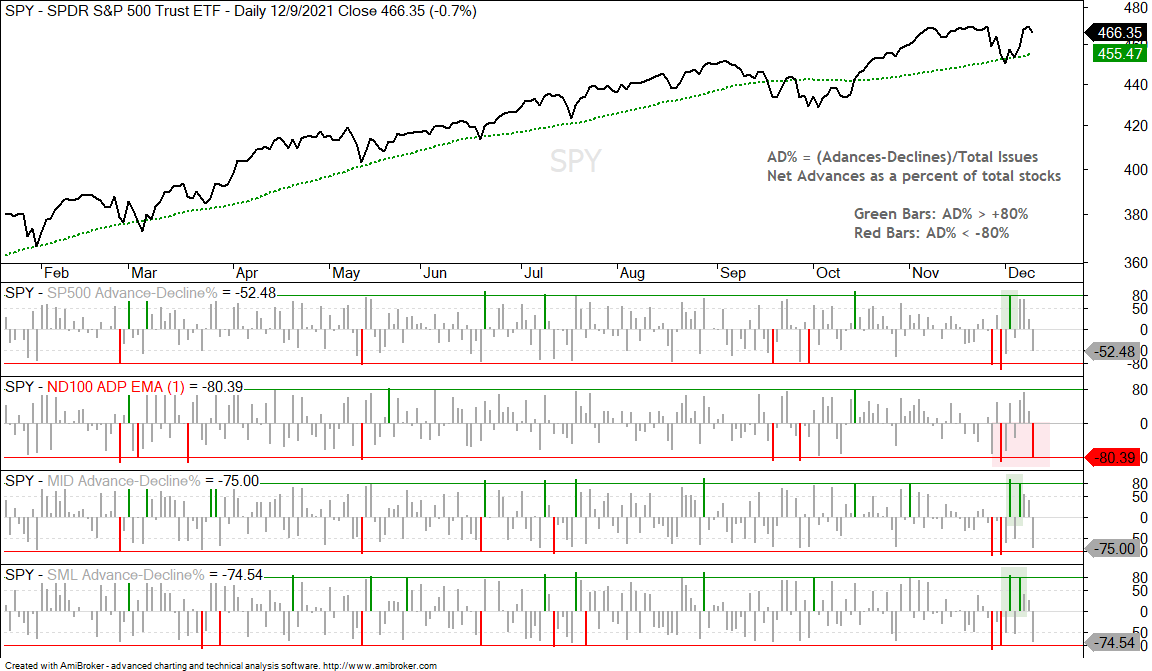
As noted in today’s Market Regime update[1], the bulk of the breadth evidence is bullish, but QQQ is under more pressure than the broad market indexes over the last few weeks. The chart below shows Advance-Decline Percent for the S&P 500, Nasdaq 100, S&P MidCap 400 and S&P SmallCap 600. The red bars show when AD% plunges below -80%, a level that shows broad selling pressure.
All four dipped below -80% on November 30th and three of the four dipped below this level on Black Friday. Nasdaq 100 AD% dipped below -80% again on Thursday and this shows broad downside participation (red shading).
Previously, the market rebounded on December 1st with three of the four surging above +80% to show strong breadth (SPX, MID and SML). The Nasdaq 100 fell well short on December 1st and again fell short on Tuesday. Note that S&P MidCap 400 and S&P SmallCap 600 Advance-Decline Percent surged above 80% on Tuesday.
Big Six Keep QQQ Strong
QQQ is doing fine on the price chart with a new high on November 22nd, a pullback and a gap breakout. The ETF fell rather sharply on Thursday, but the gap-breakout is still holding. A strong breakout should hold so beware if QQQ fills the gap on a closing basis. Note that AAPL (12.21%), MSFT (10.62%), GOOGL (7.79%), AMZN (7.53%), Tesla (5.59%) and NVDA (5.11%) account for around 49% of the ETF. These six large-caps are not always representative of the Nasdaq 100 as a whole.
The next chart shows the Nasdaq 100 Next Gen ETF (QQQJ), which represents the next 100 top stocks in the Nasdaq. These stocks have higher betas. QQQ and QQQJ hit new highs in November, but QQQJ peaked a week ahead of QQQ and fell all the way to its October low, while QQQ held well above its October low. QQQJ broke out along QQQ on Tuesday, but fell back rather hard on Thursday. The indicator window shows QQQJ Advance-Decline Percent plunging to -88% and this shows broad downside participation.
Big Swings with High Beta ETFs
There are a number of ETFs that fit into the high beta and high risk groups, just as QQQJ. These include the Clean Edge Green Energy ETF (QCLN), Global Clean Energy ETF (ICLN), Solar Energy ETF (TAN), Video Games eSports ETF (ESPO)
and Video Game Tech ETF (GAMR). These ETFs also have similar chart features in that they broke out with big moves in October and fell back hard. The CandleGlance chart shows ICLN and TAN moving back below their falling 200-day SMAs (red shading). QCLN and ESPO returned to their breakout zones and are above their 200-day SMAs. GAMR fell below its rising 200-day and retraced around 2/3 of its breakout advance.
The next charts show QCLN, ESPO and GAMR with 20+ percent advances from early October to mid November and double digit declines from mid November to early December. The size of these moves alone tells us that we are dealing with high reward potential, high risk and high beta. In other words, upset stomachs and dizzy heads. QCLN and ESPO already fell back into the gap-breakout zones. GAMR fell on Thursday, but remains above the gap zone for now.
GLD Stalls in Potential Reversal Zone
Gold remains at a juncture of interest because there is evidence of a weird uptrend since March. GLD surged some 13% from early March to late May, corrected into September with a gap-laden decline and then broke out with an 8% surge in October-November. Thus, the higher low from spring to fall and wedge breakout argue for an uptrend, but this uptrend is far from consistent. GLD is at a potential reversal zone because it retraced around 2/3 of the prior advance with a decline back to the 165 area. The ETF firmed the last few weeks and a breakout at 168 would be bullish, provided we do not see another pop and drop. Note that the FOMC meets next week and this means we could see fireworks in bonds, the Dollar and gold.