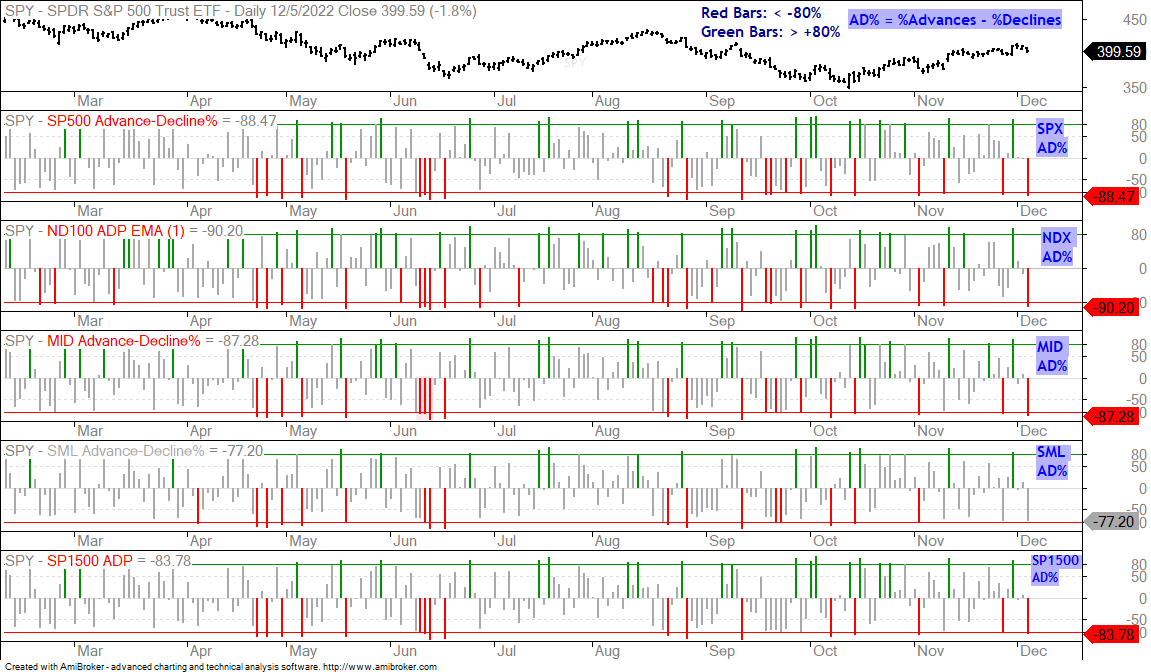
This is a broad market update because we have the Composite Breadth Model saying one thing and the price charts saying something else. The Composite Breadth Model turned positive a week ago, but the price charts still show long-term downtrends and Monday was a 90% down day. Advance-Decline Percent, which equals percent advances less percent declines, finished below -80% for the S&P 500, Nasdaq 100, S&P MidCap 400 and S&P 1500. 10% advances and 90% declines equals -80%. Lone 80% down days are not an issue, but a follow through 80% down day would be an issue because such a move would likely reverse the short-term uptrends.
Programming Note: I will post analysis of individual ETFs in a separate report today (Tuesday, December 6th). This will be published by 10AM ET.
About the ETF Trends, Patterns and Setups Report
This report contains discretionary chart analysis based on my interpretation of the price charts. This is different from the fully systematic approach in the Trend Composite strategy series. In this ETF Trends, Patterns and Setups report, I am looking for leading uptrends and tradable setups within these uptrends. While I use indicators to help define the trend and identify oversold conditions within uptrends, the assessments are mostly based on price action and the price chart (higher highs, higher lows, patterns in play). Sometimes the chart assessment can be at odds with the indicators.
This Week's Publishing Schedule
Tuesday – 6 December: Broad Market Update
Tuesday – 6 December: ETF Report and Signal-Rank Table Update
Wednesday – 7 December Market-ETF Video and Market Regime Update
Thursday – 8 December: Market-ETF Report and Signal-Rank Table Update
Saturday – 10 December: ETF Signal and Rank Table
Composite Breadth Model is Bullish at +1
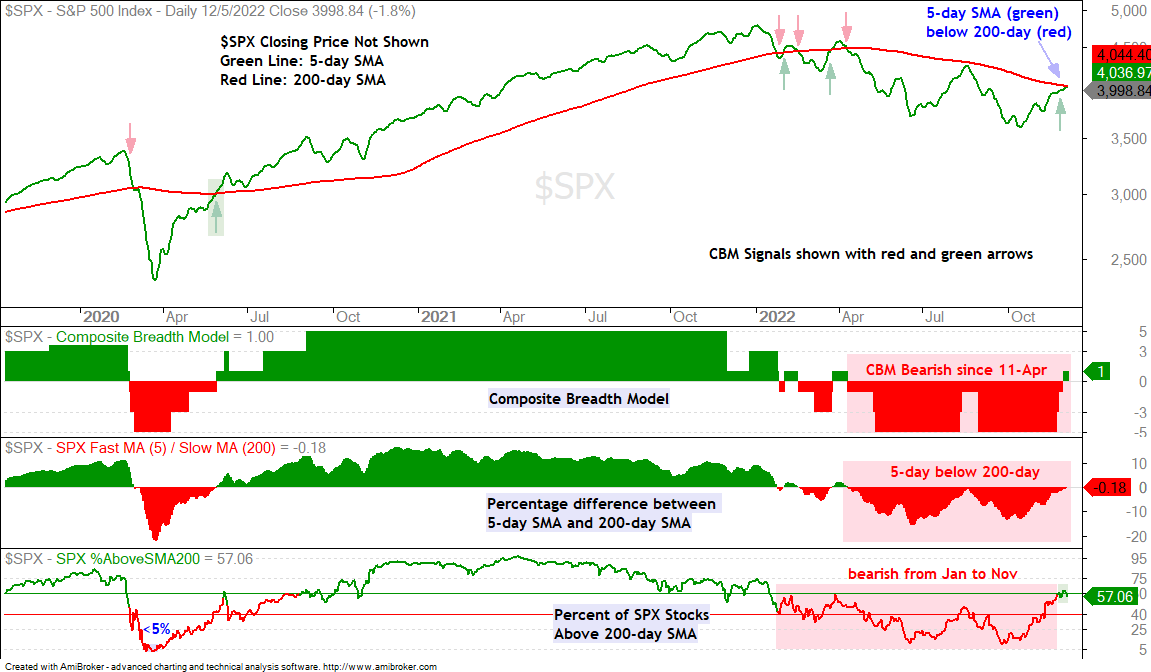
The Composite Breadth Model (CBM) turned net positive (+1) last week as the S&P 500 Trend Model flipped from bearish to bullish. This means three inputs are bullish and two are bearish. The 5/200 day SMA cross for the S&P 500 is one of those inputs and it remains bearish (5-day below 200-day). Note that the CBM turned positive (+1) for 10 days in January-February and 11 days in March-April. I am wondering if this is going to be another one of those bullish signals that gets whipsawed. There is no such thing as a perfect model and whipsaws are unavoidable. For now, the CBM is positive and bullish until proven otherwise.
You can learn more about my chart strategy in this article[1] covering the different timeframes, chart settings, StochClose, RSI and StochRSI.
A Big Counter-trend Bounce for SPY
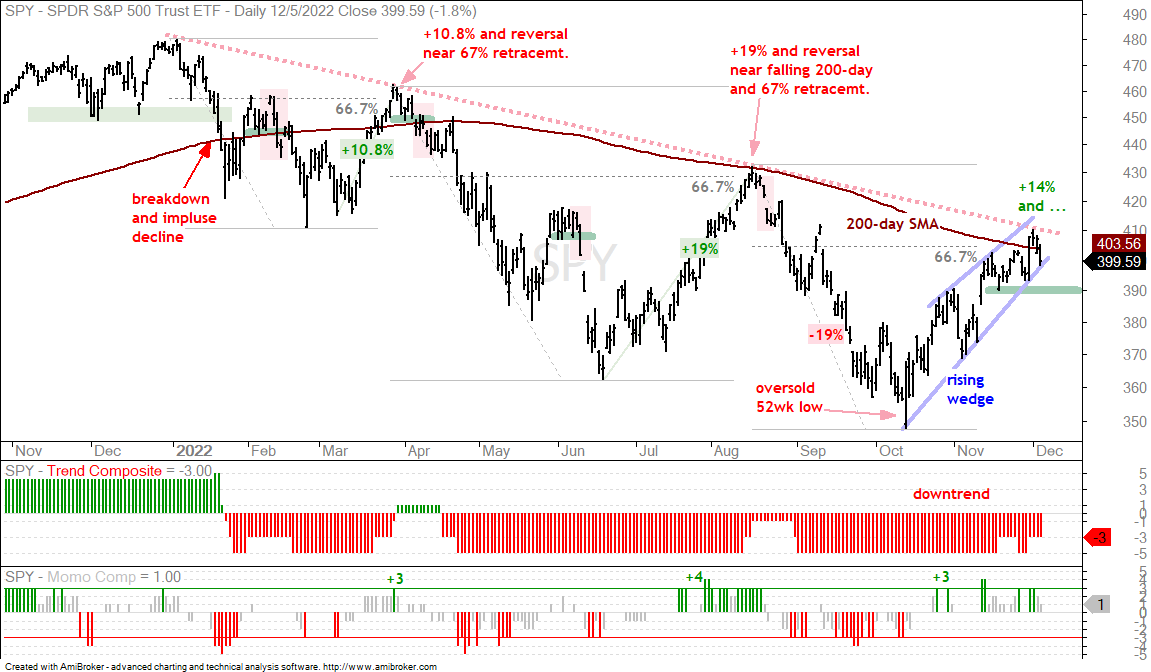
Even though the Composite Breadth Model turned positive, the S&P 500 SPDR (SPY) is clearly in a long-term downtrend. The red dashed line connects lower highs throughout 2022 and the ETF recorded 52-week lows in September-October. There were three double-digit advances in 2022 and the first two failed near the 67% retracement lines (red arrows). SPY advanced some 14% from mid October to early December and is currently at the falling 200-day and 67% retracement line. This is a resistance-reversal zone and a break below short-term support at 390 would reverse the short-term uptrend. Also notice that the advance formed a rising wedge, which is a pattern typical for counter-trend bounces.
SPX %Above 20-day SMA Plunges
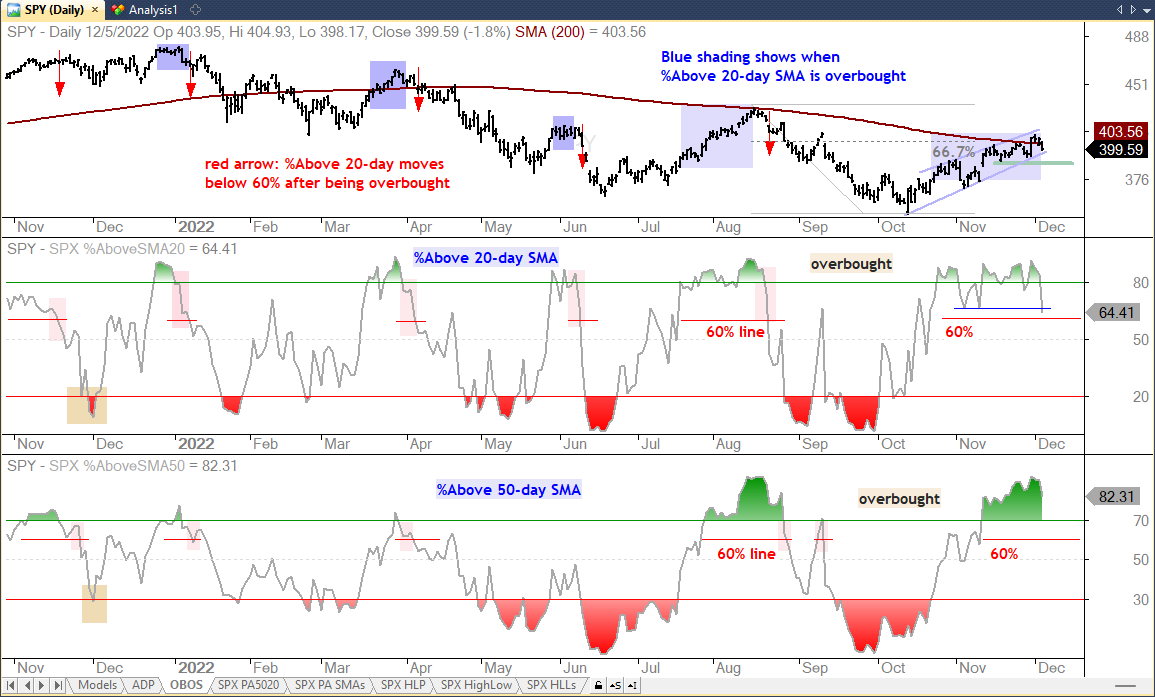
SPX %Above 20-day SMA surged above 80% to become overbought on October 25th and remains in overbought territory (above 60%). Even though we have yet to see a bearish signal, notice that the indicator exceeded the early November lows (blue line). Monday’s dip is the deepest dip since becoming overbought and this shows in increase in downside participation. Further weakness and a break below 60% would be short-term bearish. The blue shadings on the price bars show when the indicator is overbought and the red arrows show subsequent breaks below the 60% level.
From 52 Week Lows and Short of August Highs
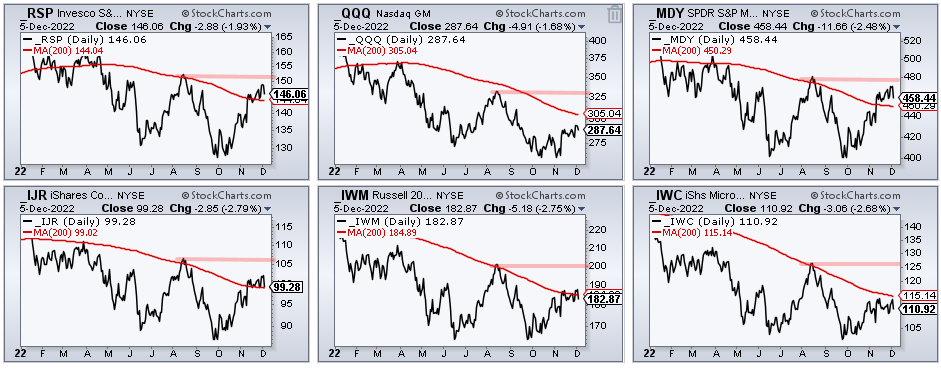
The surge from mid October to early December was strong, but the major index ETFs started the move from 52-week lows and did not exceed their August peaks. Higher highs are required for an uptrend, as are higher lows. These major index ETFs include the S&P 500 EW ETF (RSP), Nasdaq 100 ETF (QQQ), S&P MidCap 400 SPDR (MDY), S&P SmallCap 600 SPDR (IJR), Russell 2000 ETF (IWM) and Russell Microcap ETF (IWC).
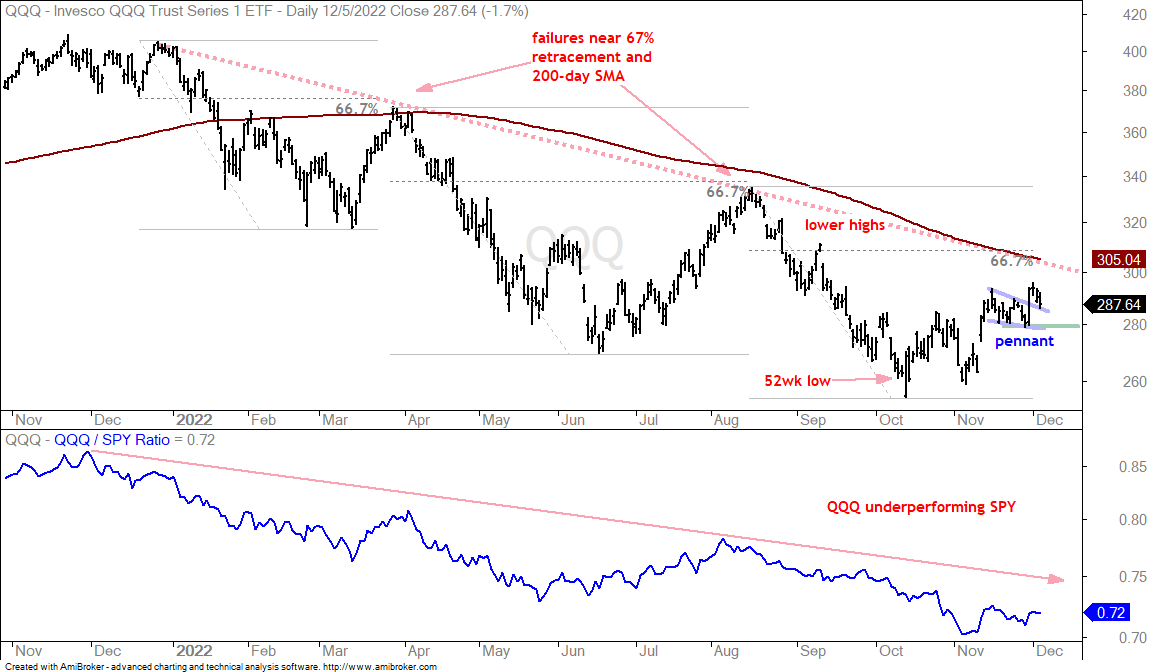
QQQ and IWM are Lagging SPY
The next chart shows QQQ continuing to lag the broader market. QQQ bounced with the stock market from mid October to early December, but this bounce was weaker than the rest because QQQ only retrace half of the August-October decline and did not come close to the falling 200-day SMA. Short-term, QQQ broke out of a pennant, but is already getting cold feet with a sharp decline on Monday. A support break at 280 would reverse the upswing that is in place since mid October.
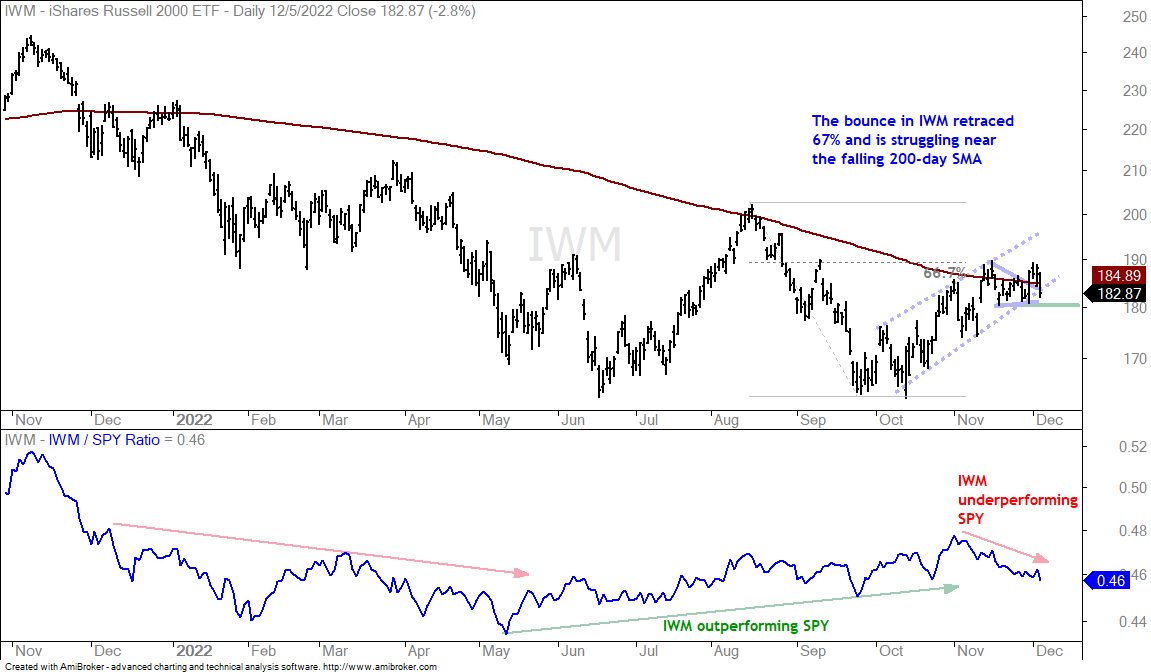
The next chart shows IWM falling well short of its August high as it struggles near the falling 200-day SMA. IWM broke out of a pennant last week, but fell sharply on Monday and is underperforming SPY again. The blue dashed lines define the upswing since October with support set at 180. A close below this level would reverse the short-term uptrend.
Overall Thoughts on the Stock Market
Even though the Composite Breadth Model is positive at +1, the major index ETFs are in long-term trends when analyzing the price charts objectively. Uptrends require a higher high and a higher low. At the very least, an uptrend starts with a higher high or a higher low. We have yet to see either.
The short-term trends are up since October, but these are considered counter-trend advances within bigger uptrends. QQQ, IWM and many other ETFs broke out of short-term consolidations (pennants, flags). Monday’s sharp decline is jeopardizing these breakouts with the late November and early December lows marking short-term support for many ETFs. Support breaks here would reverse the short-term uptrends and signal a continuation of the long-term downtrends. At the very least, I would then expect a test of the October lows.
Broad market direction is the single biggest factor when considering stock-based ETFs because most will rise and fall along with the broader market. A short-term trend reversal and continuation of the long-term downtrend would be detrimental to most stock-based ETFs.
You can learn more about exit strategies in this post[2], which includes a video and charting options for everyone.
Intermarket Relationships to Watch
There are some clear relationships at work right now and we should watch closely because reversal zones are nigh. The Dollar is testing the rising 200-day after a sharp pullback, while GLD and SPY are challenging their falling 200-day SMAs after big advances. Yields are falling along with the Dollar, while Treasury Bonds are bouncing long with gold and stocks. SPY and GLD remain in a short-term uptrends, but upside breakouts in the 10-yr Treasury Yield and Dollar would be negative
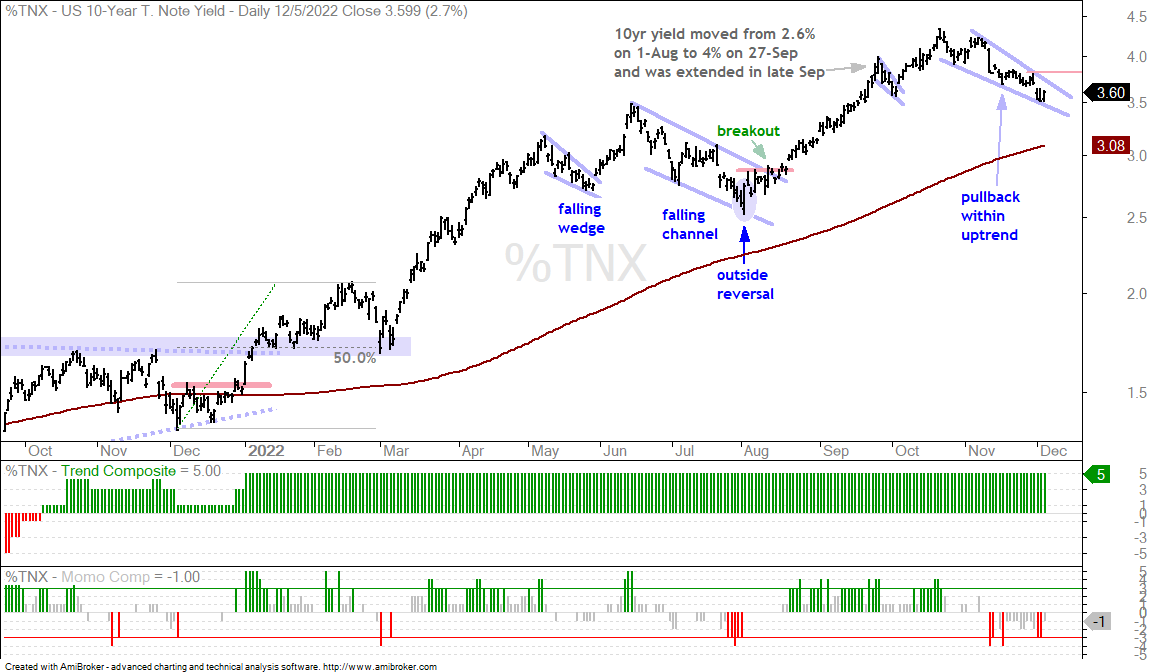
Bonds Bounce as Yields Correct (TLT, $TNX)
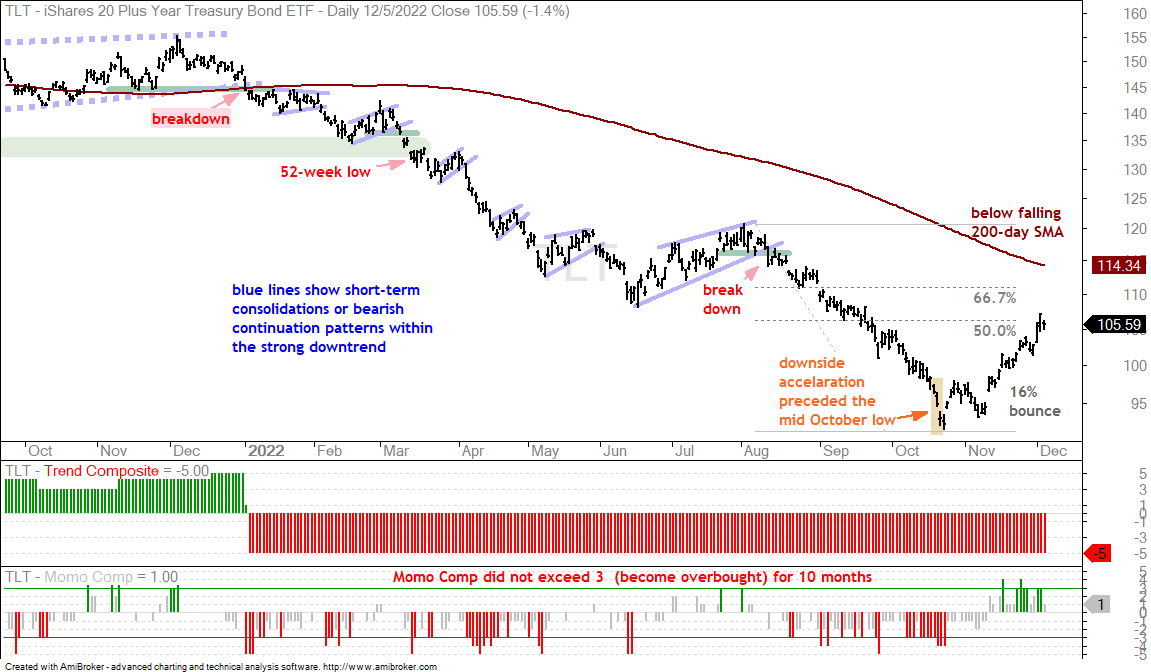
Bonds are positively correlated with stocks right now, which means Treasury yields are negatively correlated. Bonds and stocks are moving in the same direction, while yields and stocks are moving in opposite directions. The first chart shows TLT with a sharp counter-trend bounce since mid October, which is when SPY bounced. TLT retraced half to two-thirds and this retracement zone is a potential reversal zone.
I don’t see a key level to watch for a short-term trend reversal in TLT, but I do see one in the 10-yr Treasury Yield. The next chart shows the 10-yr Yield exceeding 4% in mid October and falling to the 3.5% area in early December. This decline is considered a correction within a bigger uptrend. A break above last week’s high (red line) would reverse this downswing and signal a resumption of the bigger uptrend. Such a move would be negative for stocks.
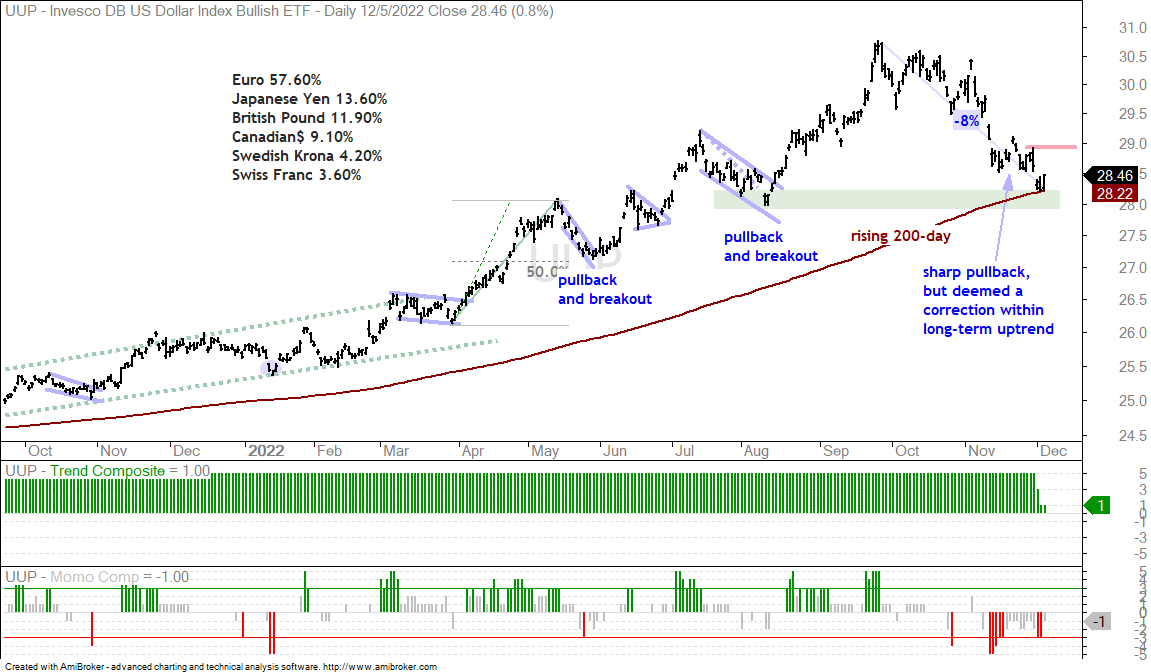
Dollar and Gold Challenge 200-day SMAs (UUP, GLD)
The Dollar Bullish ETF (UUP) fell sharply and this decline coincides with a sharp rise in stocks and gold. The chart below shows UUP testing the rising 200-day SMA and summer lows (green shading). This is a potential support-reversal zone and a breakout at 29 would reverse the short-term downtrend.
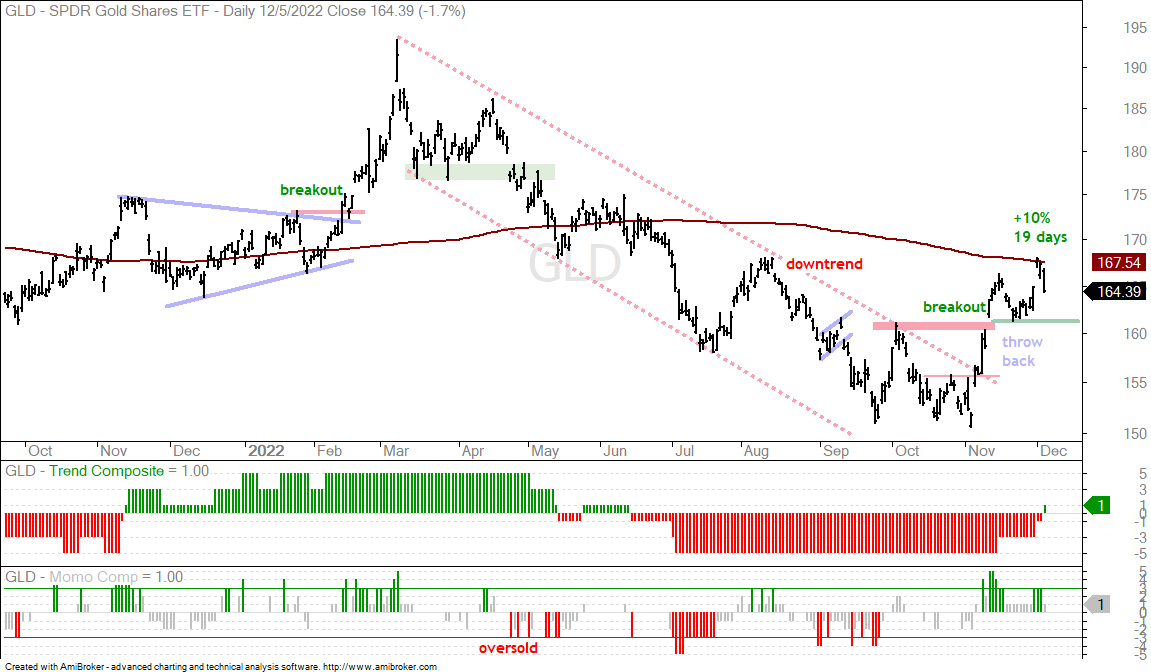
The next chart shows the Gold SPDR (GLD) surging 10% in 19 days and hitting the underside of the falling 200-day SMA. GLD broke out of the falling channel and exceeded the October high in the process. These are bullish developments, but GLD needs continuing support from a weak Dollar and falling 10-yr Yield. Breaks out in both would be negative for gold. Short-term, GLD broke out and returned to the breakout zone with a throwback in late November. This breakout zone held and 161 is the first level to watch going forward.
Confirmation Bias and Similar Opinions
Confirmation bias is when traders gravitate towards opinions and assessments that confirm what they already think. I aim to be as objective as possible, but my assessment is still an opinion and there is some subjectivity involved. I think the current advance is a counter-trend bounce within a bigger downtrend and the stock market is at a potential turning point. At the risk of confirmation bias, I am sharing some similar viewpoints from four strategists. The first three opinions are based more on fundamentals than technicals, but I have the upmost respect for these three and their analysis processes. The fourth video is from a technical analyst who shares my views. All four suggest that another leg lower is coming.
Bloomberg: Bridgewater’s Patterson Sees ‘Structural’ Market Changes Ahead
CNBC: Expect the market to break the lows in 2023, says Tony Dwyer
Bloomberg: Morgan Stanley’s Wilson Says Rally to Continue Into December
CNBC: Katie Stockton talks market breadth and energy stocks.
You can learn more about my chart strategy in this article[1] covering the different timeframes, chart settings, StochClose, RSI and StochRSI.