Timing Models – Concerns Versus Evidence, Breadth Models, %Above 200-day, AAII Bull-Bear and Yield Spreads
Posted By
Arthur Hill, CMT
On
In
Archive |
No Comments
The weight of the evidence remains bullish, but there are some concerns with excesses in the S&P 500 and underperformance in prior leaders. The excesses are a result of the recent rotations as money moved into the lagging groups: finance and energy. This pushed many of their component stocks above their 200-day SMAs. Money did not exactly move out of the leading groups because they simply consolidated, as opposed to moving lower. As such, most of their components remained above their 200-day SMAs.
Thus, we have breakouts in the S&P 500 SPDR, the S&P MidCap 400 SPDR, the Russell 2000 ETF and the Finance SPDR. All four exceeded their September-October highs and all but one (XLF) scored 52-week highs. This is bullish. QQQ, the Technology SPDR, and some tech-related ETFs have yet to break their October highs, much less their September highs. The stocks in QQQ account for some 40% of the S&P 500 and the Technology sector accounts for around 27%. SPY would be hampered without participation from these two.
In any case, we have to go with the weight of the evidence as it presently stands, which is clearly bullish. The big trends are up for the major index ETFs and major sectors. The breadth models are bullish, the Fed balance sheet continues to expand and yield spreads continue to narrow. The only negatives are not really negatives. They are just concerns of frothiness in SPY, the high percentage of SPX stocks above the 200-day and the AAII bull-bear spread.
Turkey Day Notice
Note that I will only post on Monday and Tuesday next week. I will update the video on the breadth models and present a new design for the ranking tables. The new method will expand the number of ETFs and be signal oriented (StochClose and Oversold signals). I will be off from Wednesday to Saturday next week and there will not be any updates. Hopefully, it will be an uneventful week and we can focus on the things that really matter: family, food, drink and sports!
SPY Breakout is Holding, not Folding
The triangle breakout for SPY is holding as the ETF consolidates near 52-week highs. The breakout is bullish until proven otherwise and chartists can use last week’s low (350) as the first level to watch. A close below 350 would negate the vaccine breakout and surge, and put SPY back into the triangle. This would not be enough to affect the long-term uptrend, but it would throw some cold water on the re-opening trade.
Volatility ticked lower as SPY consolidated above the triangle breakout. The indicator window shows Normalized ATR dipping back below 5 and below its 40-week SMA. I would not become concerned unless this indicator moves back above both.
Speaking of volatility, the last ROC Shock occurred in early June with an outsized move to the upside. Even though SPY corrected after this ROC Shock, it continued higher with a triangle breakout in early July. The bulls have an edge until we see a bearish ROC Shock, which would be a 5 ATR(20) decline within 20-days.
QQQ is on the Verge of Something
Note that I am not buying into the value trade, or at least the idea that banks and energy are the future leaders in the market. They may lead for a little while, but their time at the leadership helm is likely limited. Banks became utility stocks after the GFC (Global Financial Crisis) and I am hard pressed to envision a secular growth theme for energy (fossil fuels). The Regional Bank ETF (KRE) and Oil & Gas Equipment & Services ETF (XES) are up some 40% in recent weeks and could have further to run, short-term. Note, however, that KRE is still 15% below its 52-week high and XES is 50% below.
That little rant on banks and energy was the lead-in to QQQ, which does contain stocks with secular growth prospects. I am concerned that QQQ and many tech-related ETFs are lagging and have yet to breakout of consolidation patterns that began in early September. Despite this concern, I have yet to see any bearish evidence that would suggest a move the other way (down).
On the price chart, QQQ surged some 70% and hit new highs throughout June, July and August. The ETF was overbought along the way and did not rest until the consolidation pattern formed the last 12 weeks. A consolidation within an uptrend is…you know the rest. QQQ in on the verge of a breakout or a failure at resistance. A breakout would signal a continuation of the uptrend. As long as SPY holds 350, the odds favor a breakout. I will re-evaluate should SPY failed to hold its breakout.
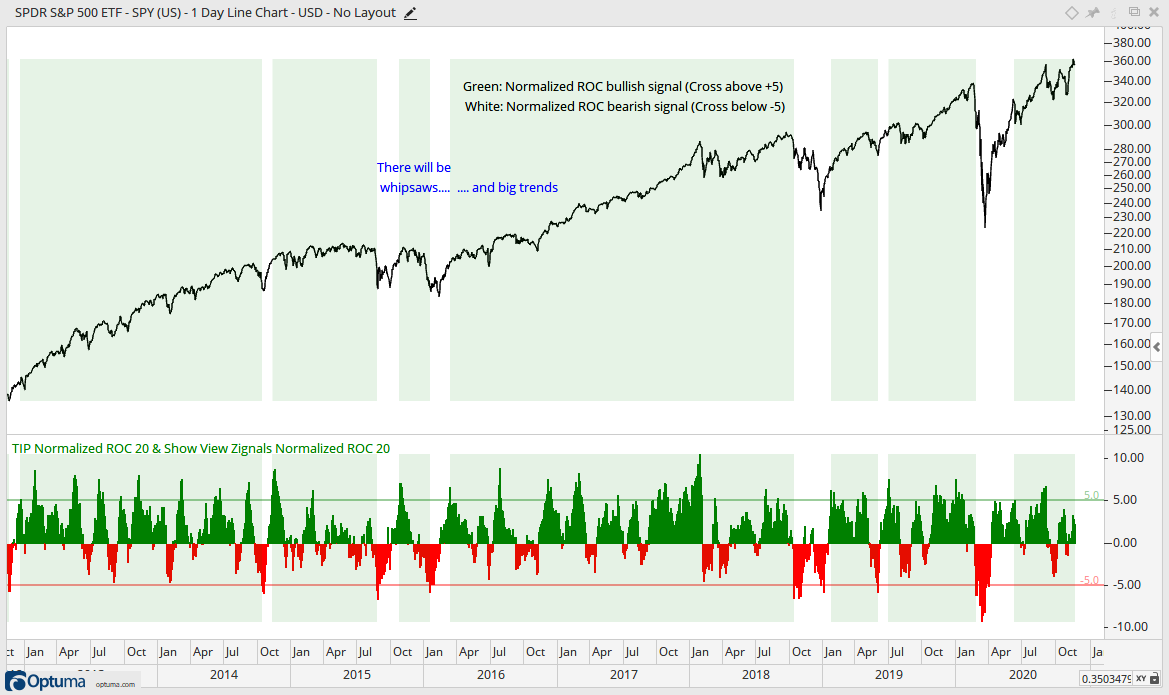
AAII Bulls hits Extreme, But...
I showed a chart of the AAII bull-bear differential in last week’s video and will cover it more today. Note that I am not a big fan of sentiment and seasonality for market timing. Sentiment can shift and remain right/wrong for extended periods and simple trend indicators are more robust than seasonal patterns. In any case, price is the ultimate arbiter when it comes to trend and trend strength. Thus, sentiment could seem excessively bullish and the market could still move higher, as it did in 2013 and 2014. Also note that there are dozens of sentiment indicators and they are not always on the same page.
On the chart below the AAII differential moved above 30 and to its highest level since January 2018, scene of a blowoff top. The percentage of bulls also exceeded 50%, which is also the highest since January 2018. This was excessive, but the market could still move higher as long as the triangle breakout in SPY holds.
Like many sentiment indicators, the AAII differential is probably better at calling bottoms when the bull-bear differential dips below -20% and/or total bears hits 50%. The blue lines show a few bearish extremes that foreshadowed bottoms over the last ten years.
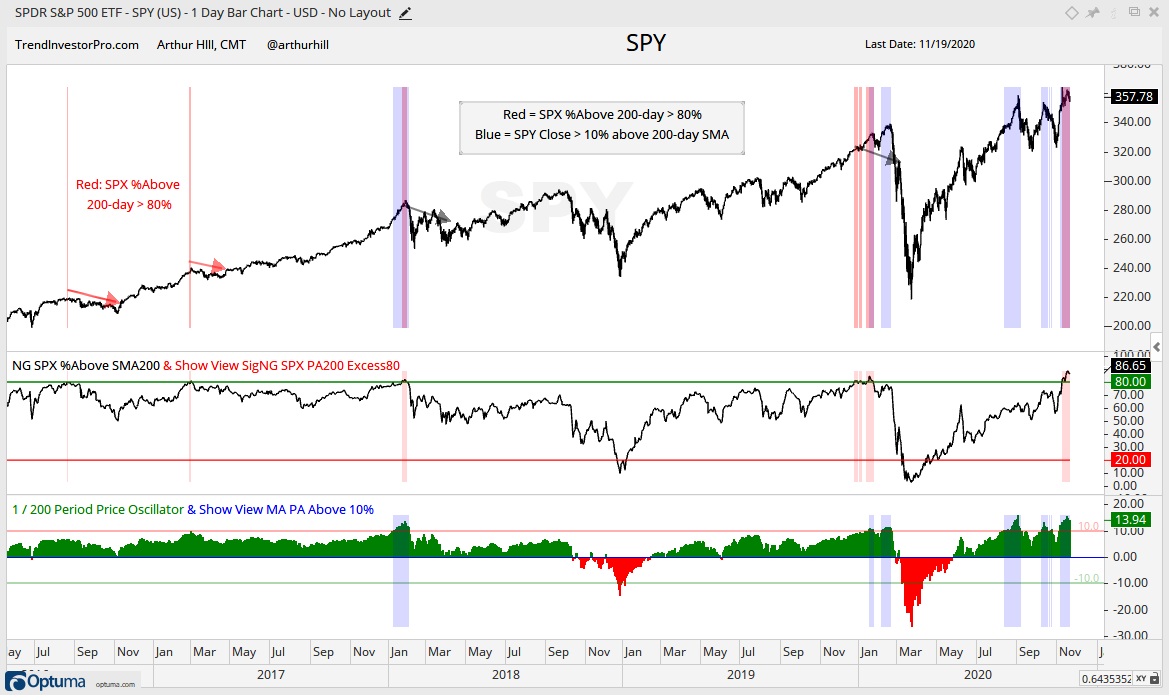
Signs of Excess in %Above 200-day
Signs of excess remain present and prior indications led to corrective periods or extended declines over the last five years (2016 to 2020). The chart below shows when the percentage of S&P 500 stocks exceeds 80% (red shading) and when the S&P 500 is more than 10% above its 200-day SMA (blue shading). The individual indicators are in the lower windows.
The two red arrows show corrections when more than 80% of stocks were above their 200-day SMA (August 2016 and February 2017). The black arrows show when both indicators signaled excess (January 2018 and January 2020). Currently, both indicators are signaling excess in November.
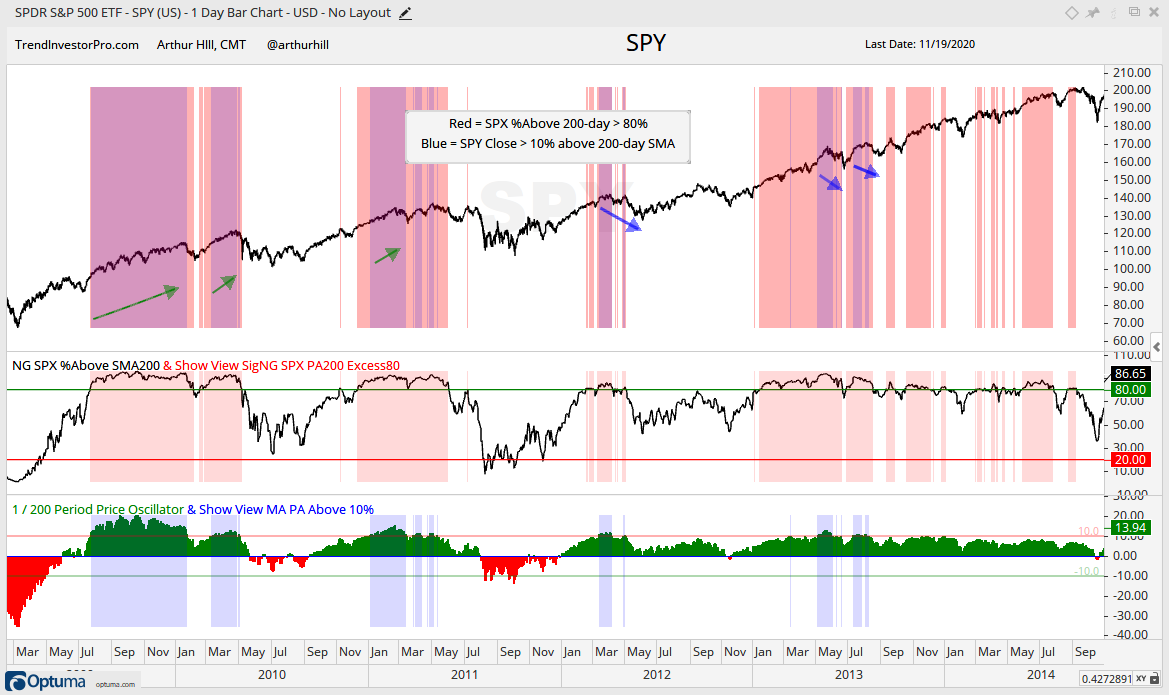
Five years is not a very long lookback period and five signals is not comprehensive. The next chart shows the period from 2009 to 2014. I am excluding 2015 because there were not any signs of excess that year. The blue-red overlap shows when both indicators showed excess. Notice how these indicators stayed at overbought levels the first year of the bull market (2009). The green arrows also show how signs of excess can remain and gains can continue before a correction or decline take hold. The blue arrows show when these excesses led to a correction.
Breadth Models Remain Largely Bullish
The first chart shows the Thrust and Trend Breadth Models for the S&P 500, as well as the 5/200 cross. All five thrust indicators are bullish, all five trend indicators are bullish and the 5 day has been above the 200-day since late May. Enough said.
There is no change in the Thrust Breadth Models. Four of the five indexes remain net bullish and nine of the twelve signals are bullish. The three negative signals (red boxes) triggered in late October and have yet to reverse. This is because small-caps and mid-caps led the November surge, while large-caps and large-cap techs lagged this month. It is an interesting dichotomy. Keep in mind that these large-caps are the true drivers in the S&P 500 and Nasdaq 100.
The chart below shows the S&P 500 Breadth Thrust indicators and model signals. %Above 50-day SMA and %Above 20-day SMA also surged back above 80% this week. While this is a sign of broad participation in November, it does create a short-term overbought condition. I would not be too concerned about this as long as SPY holds the triangle breakout.
There were two new signals in the Trend Breadth Models as new highs finally expanded in small-caps and mid-caps and High-Low Percent exceeded +10% for the first time since February. With these new signals, all five indicators are bullish for the S&P SmallCap 600 and S&P MidCap 400. The bearish breadth thrust in the S&P 100 remains the lone bearish signal on the table.
The chart below shows the S&P 500 Trend Indicators and model signals. Over 80% of S&P 500 stocks are above their 200, 150 and 100 day SMAs. This shows some seriously broad participation and marks the first time since January that all three have been above 80% at the same time. Again, this shows some excess, but is not an issue as long as SPY holds the triangle breakout.
And finally, there is no change in the sector breadth model. Ten of eleven sectors are net bullish and 28 of 33 signals are bullish. The Finance SPDR (XLF) and Real Estate SPDR (XLRE) turned net bullish on November 9th. Despite a big surge here in November, the 10-day EMA for AD% did not trigger bullish for either. In other words, the big advance fell short of a breadth thrust, which is a bit surprising.
The charts used in the Sector Breadth Model can be found on the Art’s Charts ChartList[1]. They are on page 8 if viewing 10 per page.
Yield Spreads and Fed Balance Sheet
The AAA and BBB yield spreads narrowed further and hit new lows for the move. Both are back to levels not seen since late February. This further narrowing shows confidence in the credit markets, or perhaps Fed buying. Regardless, it means investment grade companies have no problem borrowing at low rates and this is net positive.
Junk bond spreads hit their low for the move on November 9th and CCC bond spreads narrowed even further this week, hitting another new low for the move. CCC spreads are at their lowest level since January-February and well below the pre-crisis high. There are no signs of stress at the junk end of the bond market.
The Fed balance sheet expanded by $18 billion this past week. This is a pretty small amount, but keeps four month expansion intact.