Yields Spreads and Fed Balance Sheet Show No Signs of Stress
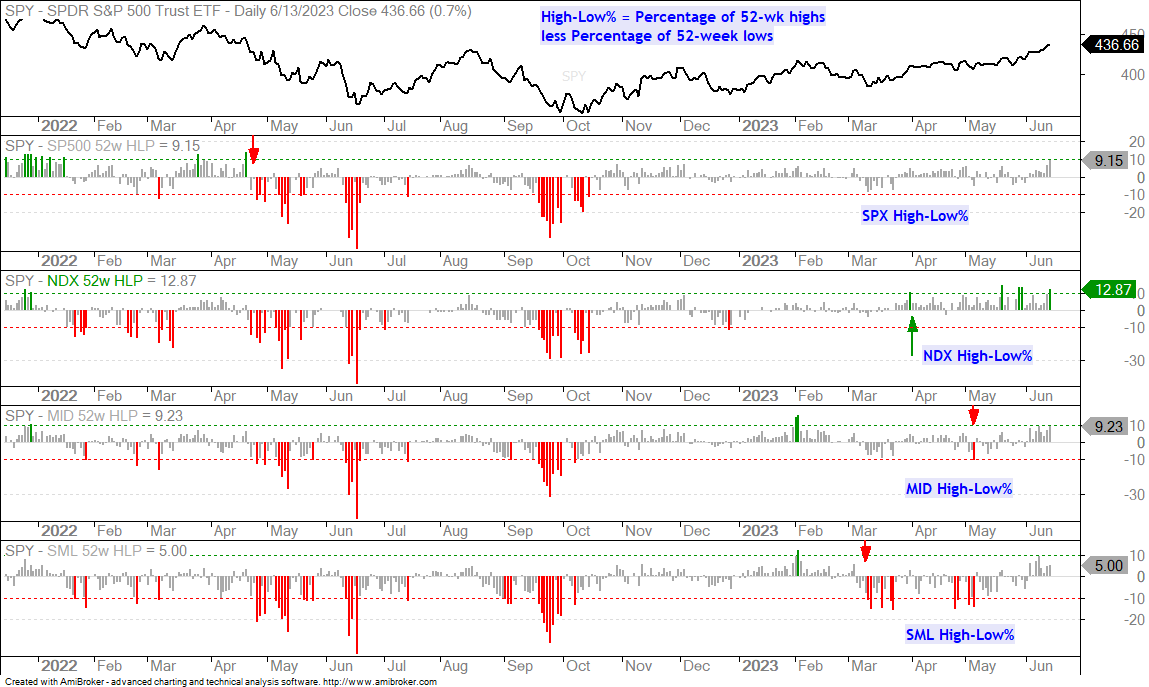
SPX High-Low Percent Hits Highest Level since April 2022
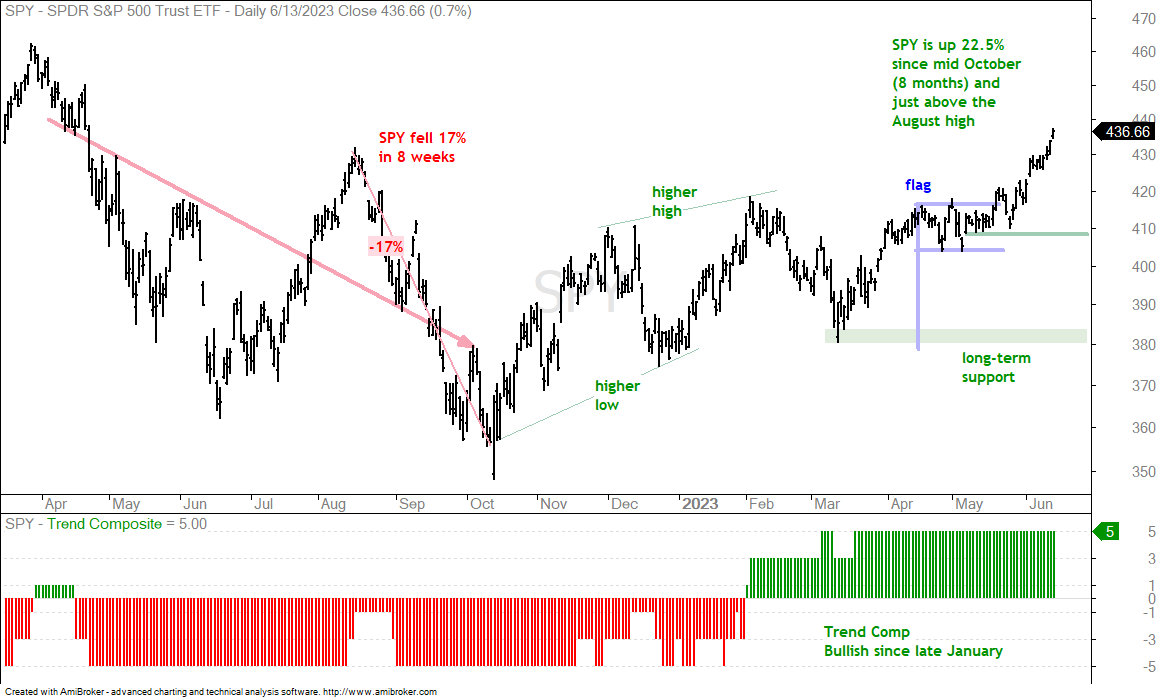
SPY Extends on Flag Breakout
QQQ Extends Steep Move
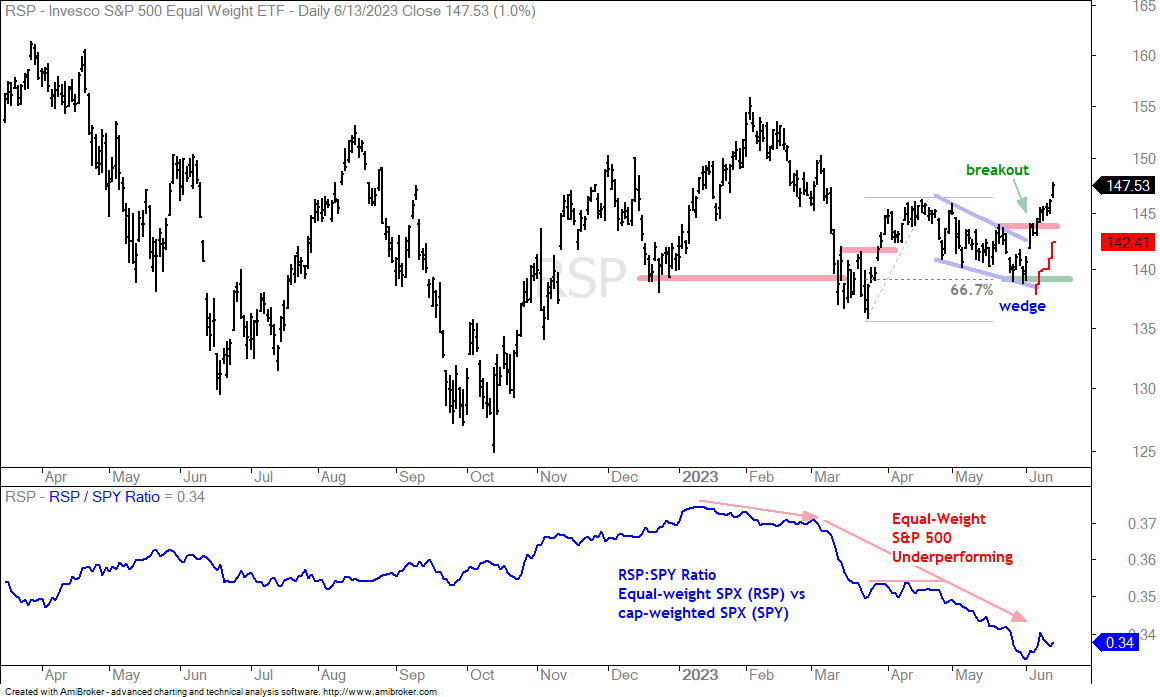
Equal-weights and Mid-caps Extend on Breakouts (RSP, MDY)
Tech-Related ETFs Extend Further (SKYY, CIBR, SOXX, IGV)
FinTech and Electronic Payments Break Out (FINX, IPAY)
Housing and Aerospace & Defense Lead with New Highs (ITB, PPA)
Short-term Support Breaks? Fuggedaboutit! (XBI, IBB, HERO)
EW Consumer Discretionary and Retail Surge (RSPD, XRT)
Healthcare and Med Devices with Deep Pullbacks (XLV, IHI)
Consumer Staples SPDR Firms after Sharp Pullback (XLP)
Dollar Bullish ETF Forms Pennant after Surge (UUP)
GLD Forms Bearish Pennant (GLD, GDX, SLV)
New Highs Expand within S&P 500
High-Low Percent is the percentage of stocks making 52-week highs less the percentage of stocks making 52-week lows. The chart below shows High-Low Percent for the S&P 500, Nasdaq 100, S&P MidCap 400 and S&P SmallCap 600. This indicator turns bullish with a move above 10% and bearish with a move below -10%. The first indicator window shows SPX High-Low Percent turning bearish in April 2022 (red arrow). Despite a 20+ percent advance off the October low, we have yet to see this indicator exceed +10%. It did, however, finish at +9.15% on Tuesday and this is the highest level since April 2022. This means new highs are expanding and this is positive.
The second window shows Nasdaq 100 High-Low Percent moving above +10% in April 2023 and punching above +10% a few times over the last six weeks. Nasdaq 100 stocks are leading with the most new highs (as a percentage of total issues). Mid-cap High-Low Percent hit +9.23% and is close to turning bullish again. Small-cap High-Low Percent (lower window) remains the laggard at +5%.
SPY Extends on Flag Breakout
The S&P 500 SPDR (SPY) broke out of a flat flag in the second half of May and continued higher in June. With a move above 430, the ETF finally exceeded its August high and fully recovered the losses from mid August to mid October. The move above the August high, while positive, does not change anything. SPY was already in an uptrend with the higher low (December) and higher high (February). The Trend Composite has also been positive since late January. Short-term, the flag was the last setup and there is no setup on the chart right now. SPY is simply in the middle of a move or trend. Short-term support remains at 408 and long-term support at 380.
Equal-weights and Mid-caps Extend on Breakouts (RSP, MDY)
The S&P 500 EW ETF (RSP) and the S&P MidCap 400 SPDR (MDY) represent the middle of the stock market. SPY represents large-caps and the S&P SmallCap 600 SPDR (IJR) represents small-caps. Large-caps are leading, but RSP and MDY are playing some catchup with follow through on their breakouts. The first chart shows RSP with a falling wedge that retraced around 2/3 of the March-April surge and a breakout in early June. RSP extended on this breakout with further gains the last five days and this confirms that participation is expanding. The red line shows the ATR Trailing Stop (22,3) at 142.41 for reference. The stop starts on the breakout and is set to be just below the wedge low. It trails as long as prices move higher.
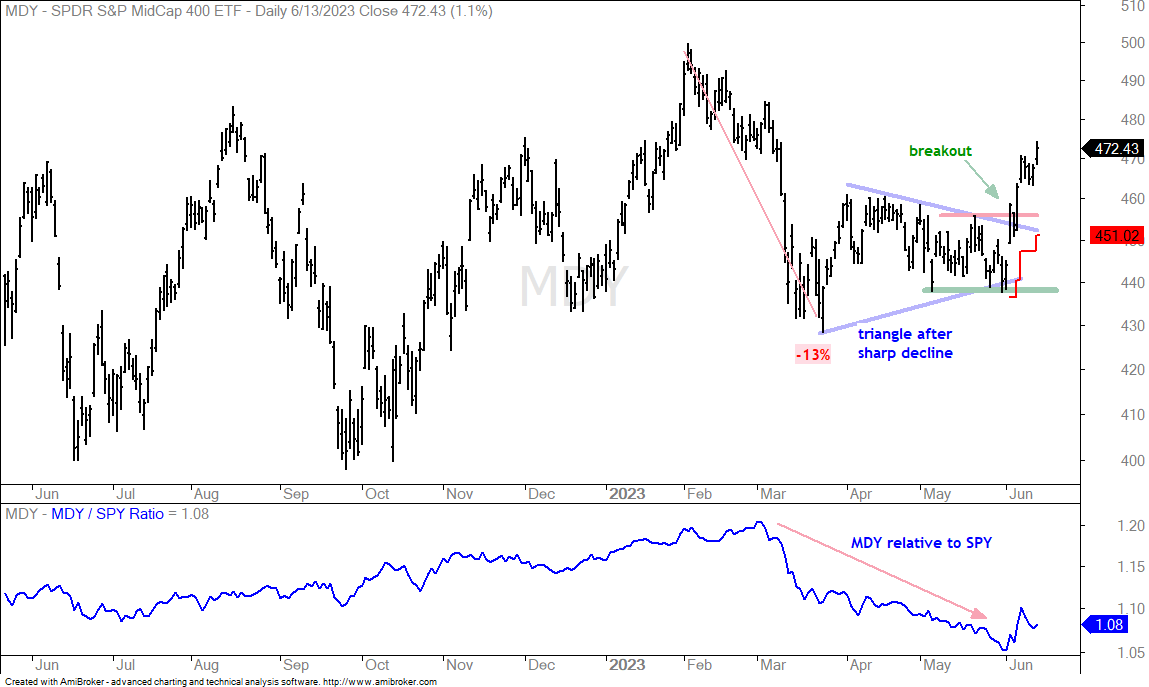
S&P MidCap 400 SPDR Extends after Breakout
The next chart shows MDY with a triangle and a breakout in early June. The red line is the ATR Trailing Stop (22, 3), and it starts just below the low before the breakout. Keep in mind that this stop is a certain number of ATR(22) values below the highest close since the start date, which is the breakout date. The ATR multiplier can be adjusted to align with the low just before the breakout, which is the late May low in this case.
QQQ Extends Steep Move
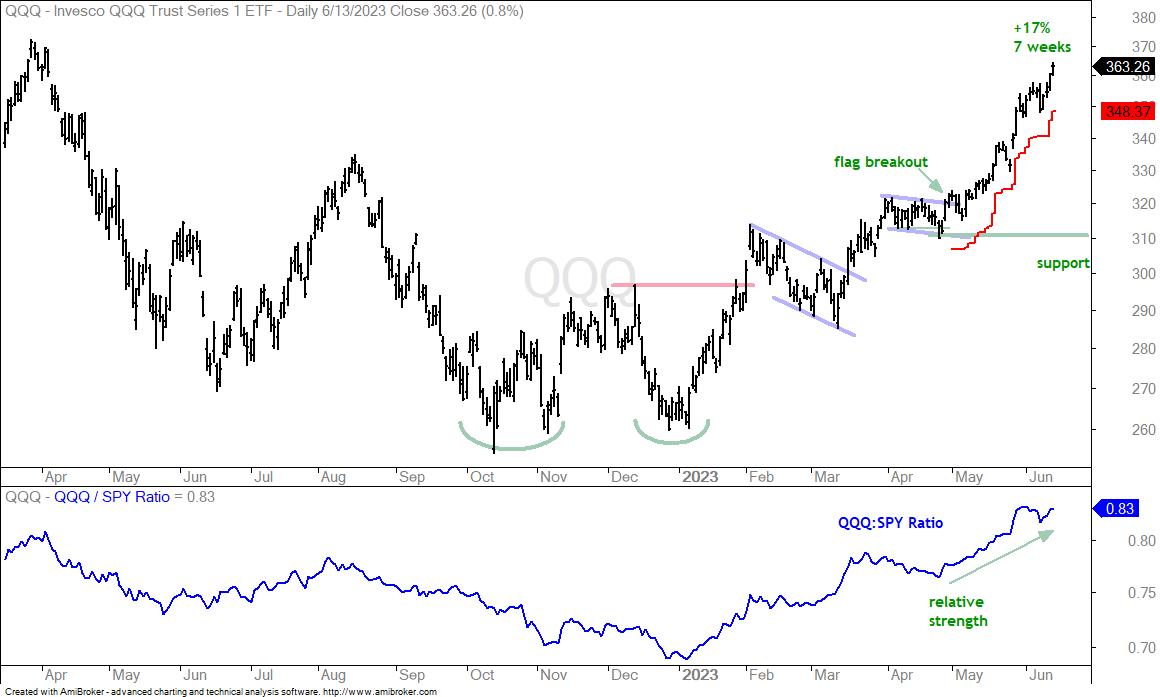
There is no change in QQQ as it extended further and is now up 17% in seven weeks. The steepness of the advance is unsustainable, but there are no signs of a reversal here. QQQ broke out of a flag pattern in early May. There is nothing to do now except book some profits if you have them, wait for the next setup or trail a stop. The red line shows the ATR Trailing Stop (22, 3) at 348.37. This stop started with the early May breakout. It was placed 3 ATR(22) values below the breakout close so it starts just below the mid April low.
Tech-Related ETFs Extend Further (SKYY, CIBR, SOXX, IGV)
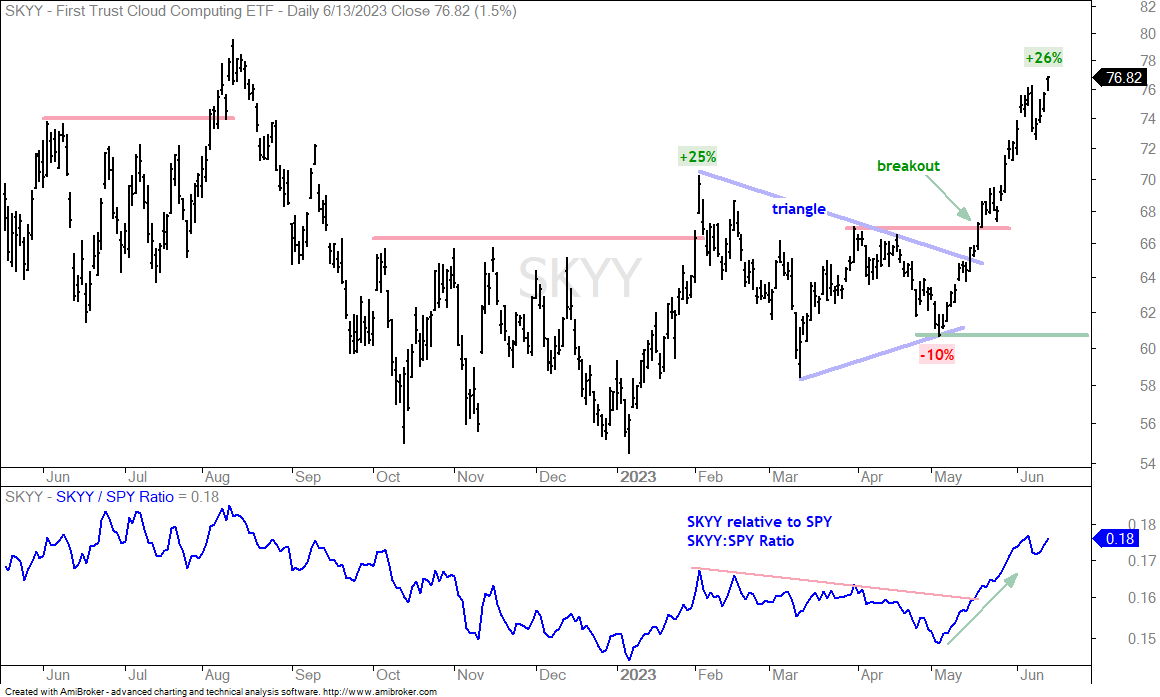
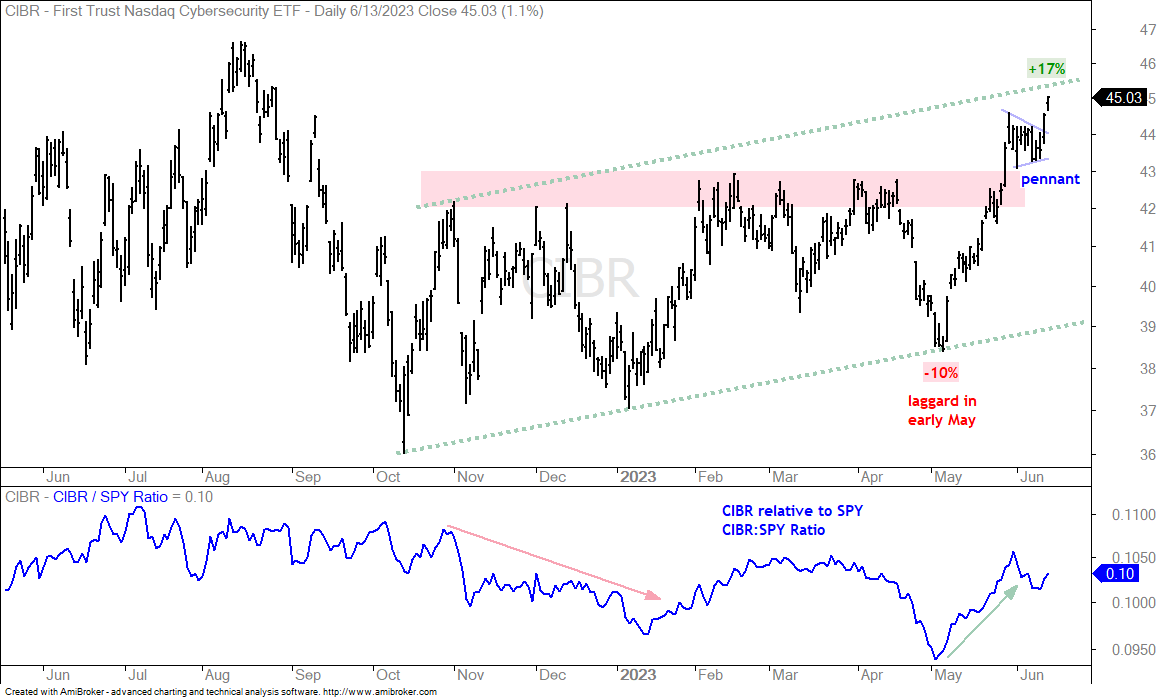
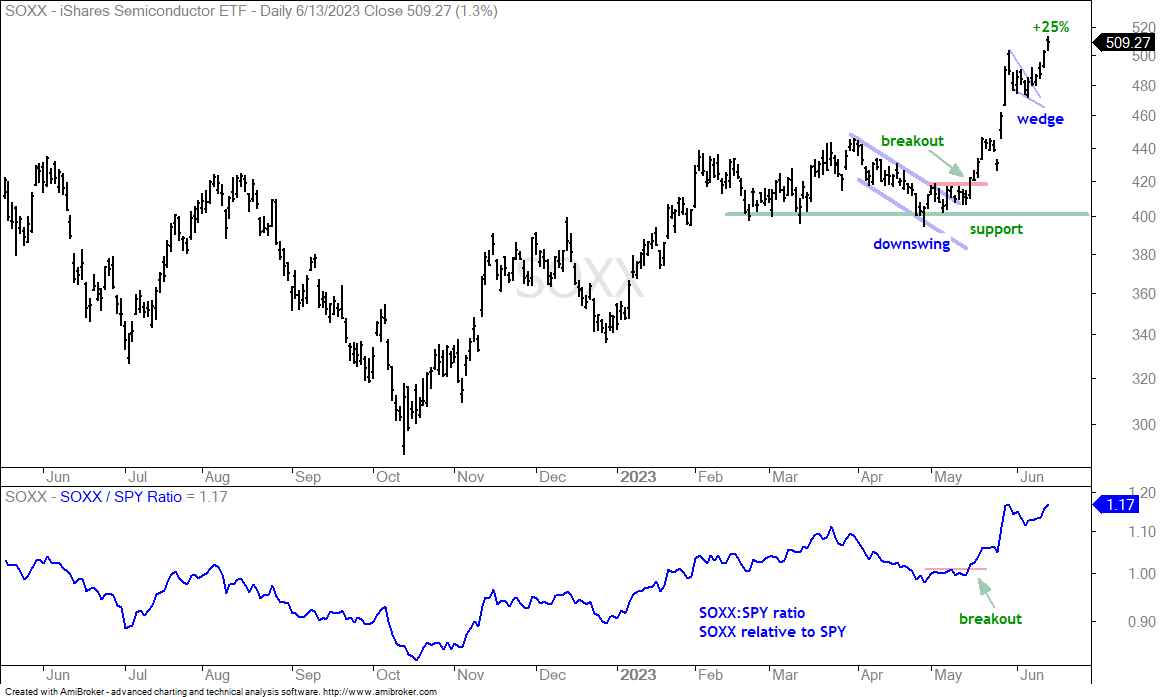
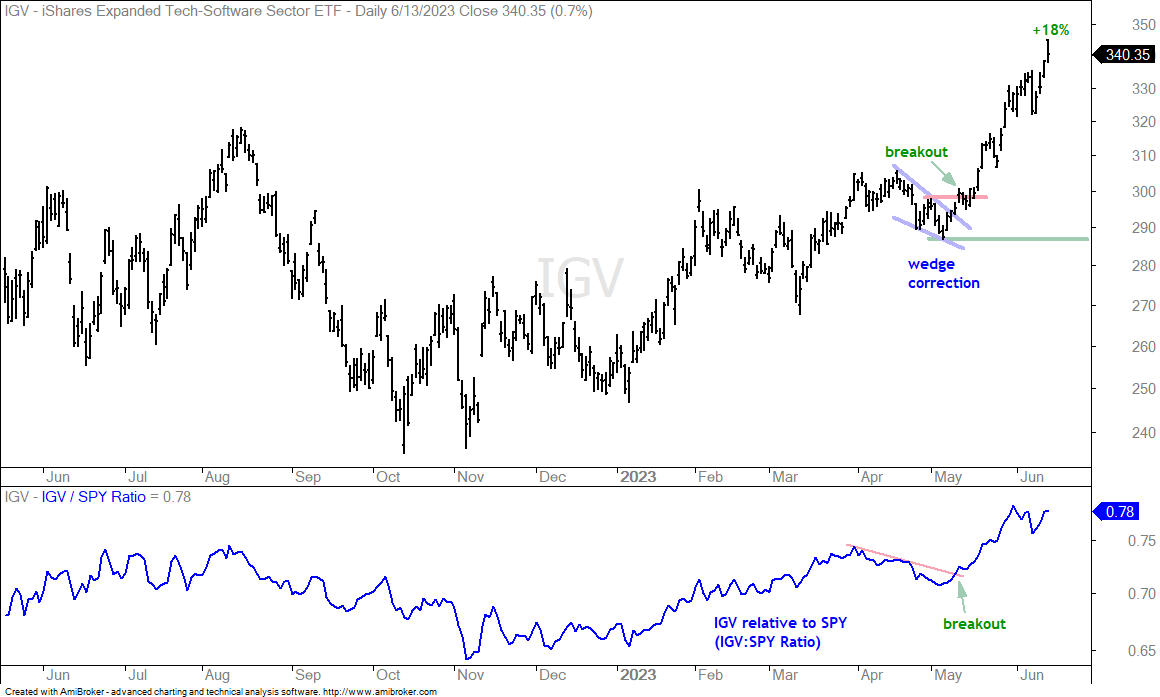
The Cloud Computing ETF (SKYY), Cybersecurity ETF (CIBR), Internet ETF (FDN), Semiconductor ETF (SOXX) and Software ETF (IGV) are all up between 17 and 26% since their May lows. They are strong and leading, but there are no setups on the charts. They are also quite extended and ripe for a rest.
FinTech and Electronic Payments Break Out (FINX, IPAY)
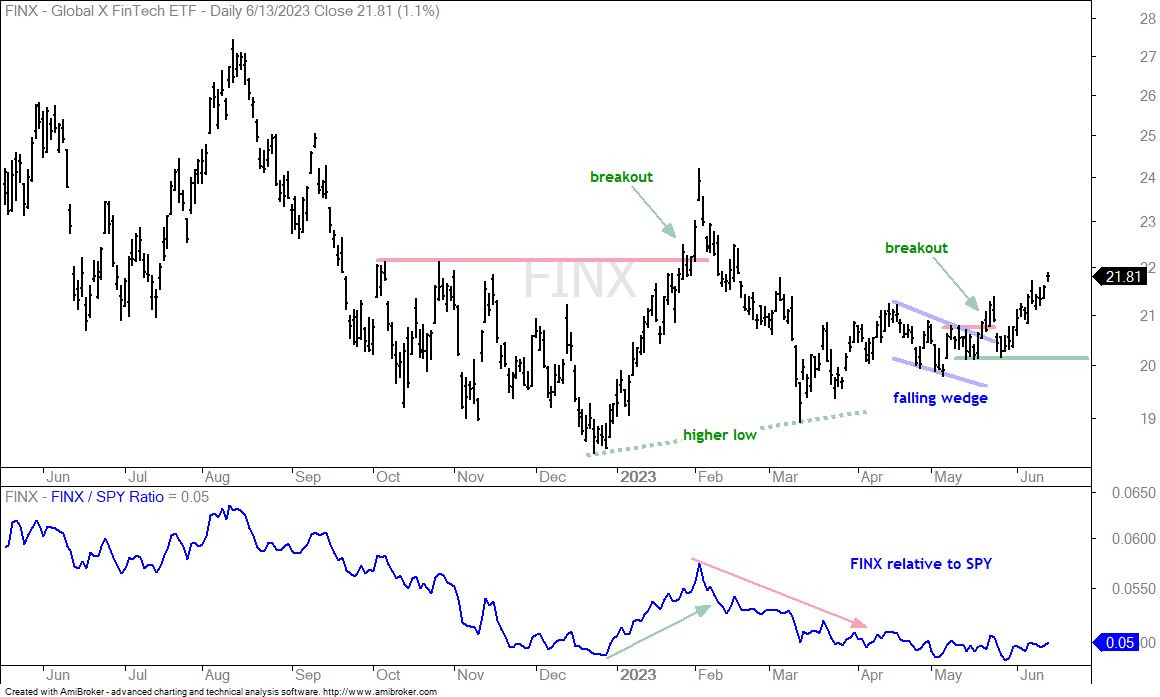
The FinTech ETF (FINX) and the Mobile Payments ETF (IPAY) are not as strong as QQQ and the leading tech ETFs, but they are coming alive. The chart below shows FINX with a breakout in May, a throwback after the breakout and a continuation higher the last few weeks. I will keep support at the mid May lows for now.
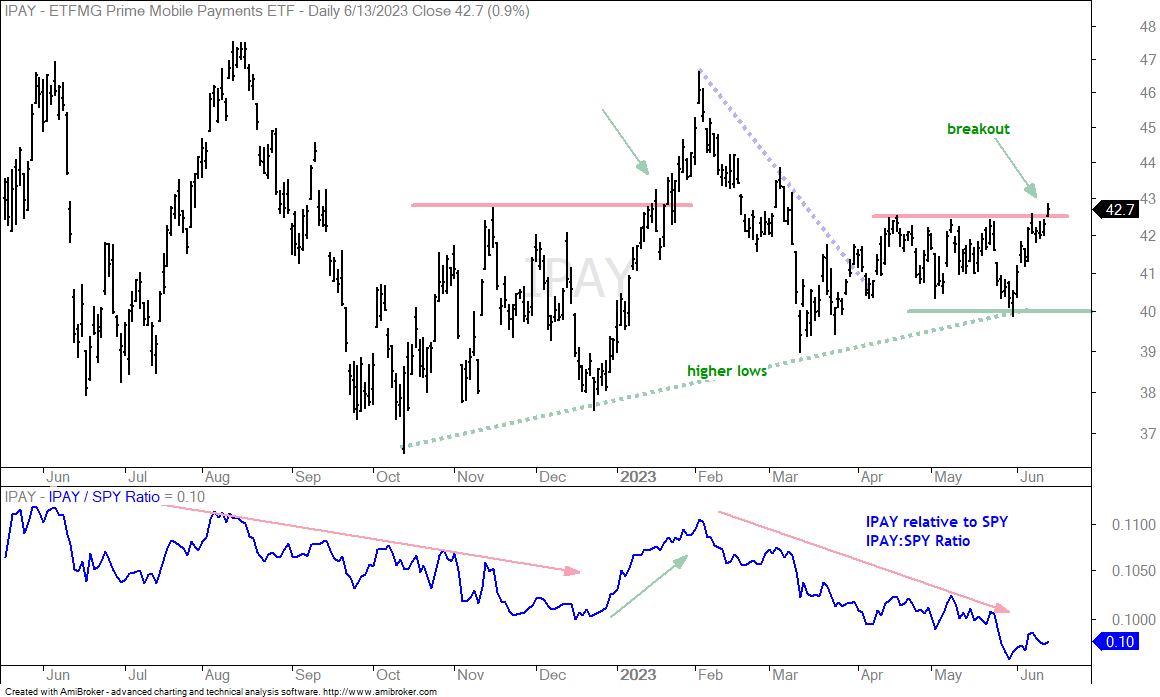
The next chart shows IPAY breaking above its April high on Tuesday.
Housing and Aerospace/Defense Lead with New Highs (ITB, PPA)
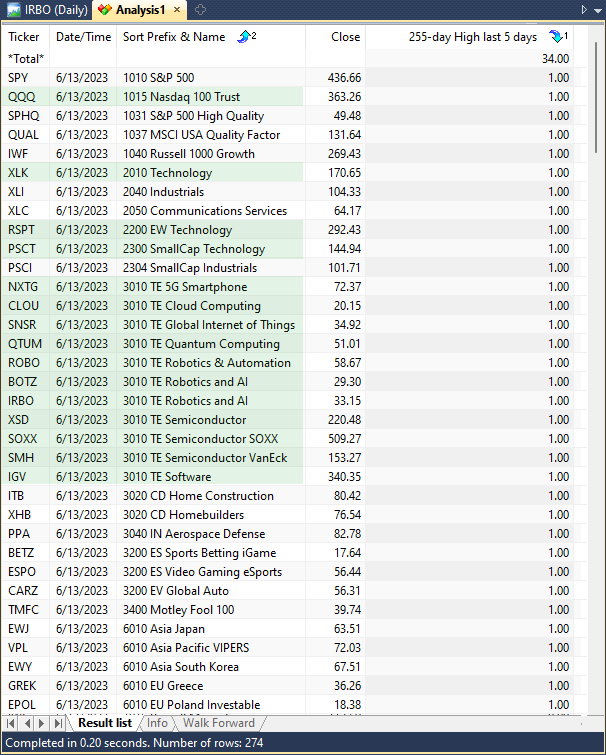
The image below shows ETFs from the Master List that recorded 52-week highs within the last five days. 34 of the 273 ETFs in the Master List recorded new highs. There were 275 ETFs in the Master List, but the Livestock ETF (COW) and Coffee ETF (JO) were retired and no longer trade. Also note that the Equal-weight Sector ETFs changed their symbols last week. They are now RSPC, RSPD, RSPS, RSPG, RSPF, RSPH, RSPM, RSPN, RSPR, RSPT, and RSPU. The image below shows 34 ETFs hitting new highs with the tech-related ETFs shaded green.
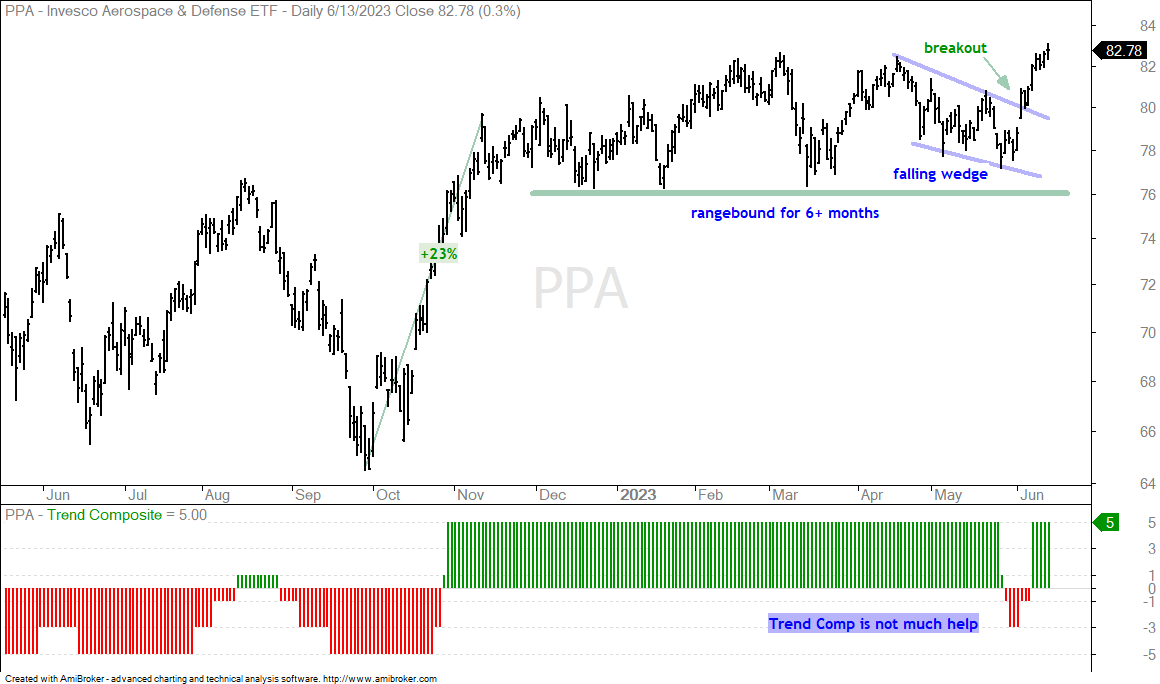
The next chart shows the Aerospace & Defense ETF (PPA) with a falling wedge, a breakout in early June and a move to new highs the last few days. Notice that the Trend Composite was no help because PPA was in a trading range from mid November to early June (6+ months). The Trend Composite turned negative in late May and then positive again on June 7th. This is why I prefer chart analysis without indicators. Indicators are great for scans and systematic strategies. On the price chart, PPA was simply range bound and near the lower end of this range in late May. This provided a setup for a bounce off support.
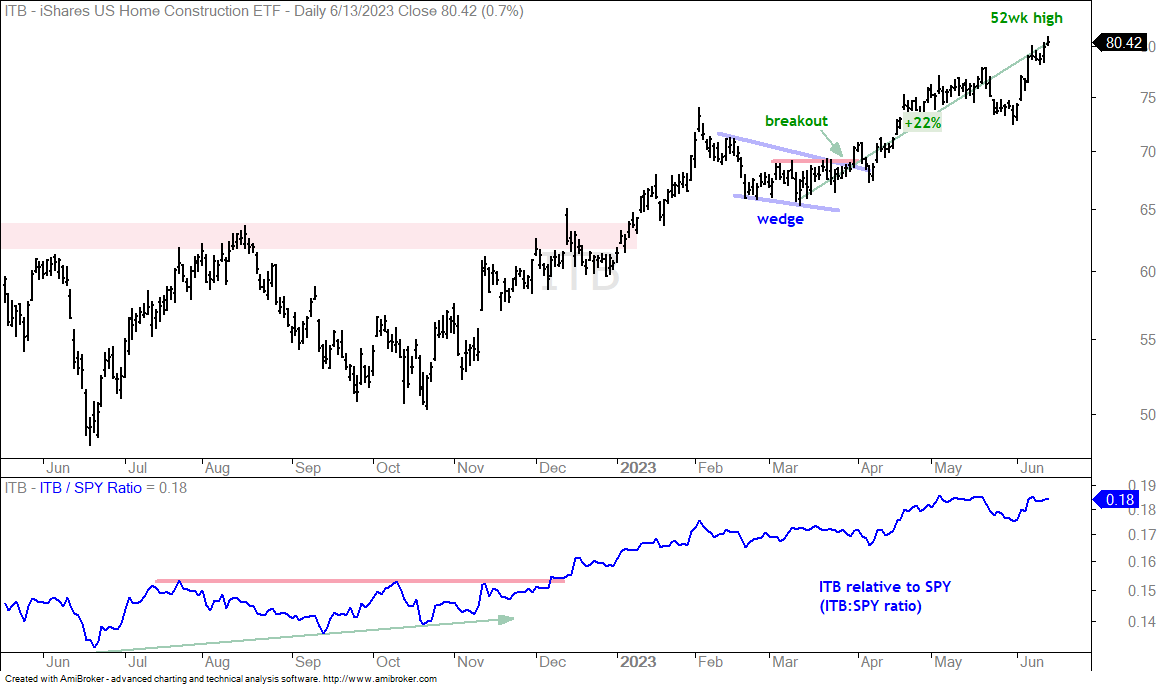
The next chart shows the Home Construction ETF (ITB) hitting a new high and rising around 22% since mid March.
Short-term Support Breaks? Fuggedaboutit! (XBI, IBB, HERO)
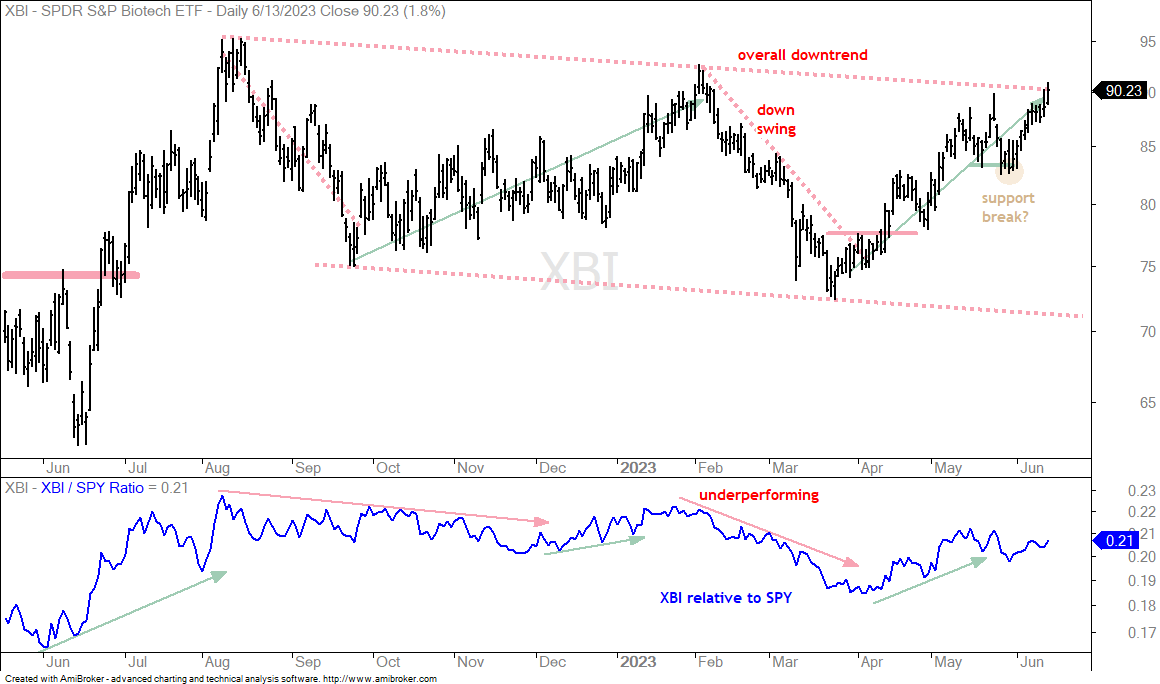
One day a short-term support break will lead to a bigger trend change, but that day is not here yet. The CBM is positive, techs are leading and the market is in risk-on mode. This creates an upward bias that is not conducive to bearish thoughts or setups. The chart below shows the Biotech SPDR (XBI) in a downtrend since August and four swings within this downtrend. XBI appeared to break the mid May low (support break), but promptly recovered and moved above the May high. We should lean bullish in bull markets. This means pullbacks are opportunities, not threats.
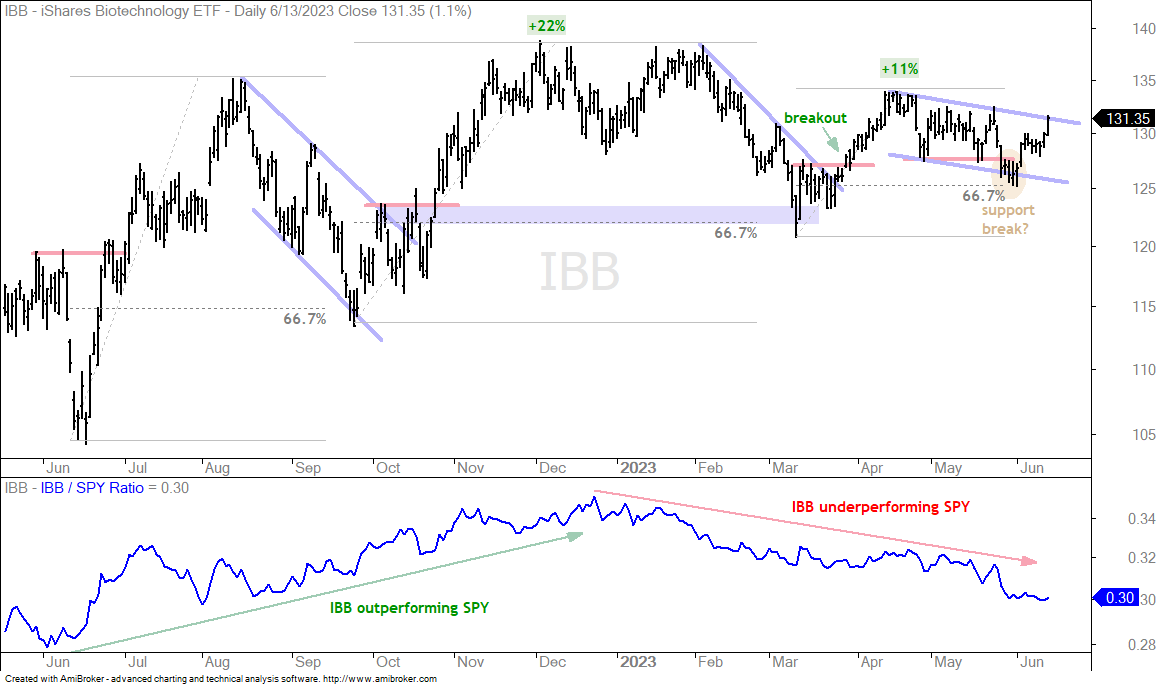
The next chart shows the Biotech ETF (IBB) breaking support with a sharp decline in late May. And then surging back above 130. The support break in a bull market was not the play here. I too get caught up in overthink sometimes and must come back to basics. Most pullbacks resolve to the upside in bull markets. IBB appeared to break support, but the decline retraced around 2/3 of the prior 11% advance. A channel of sorts also formed and the ETF is making a breakout attempt.
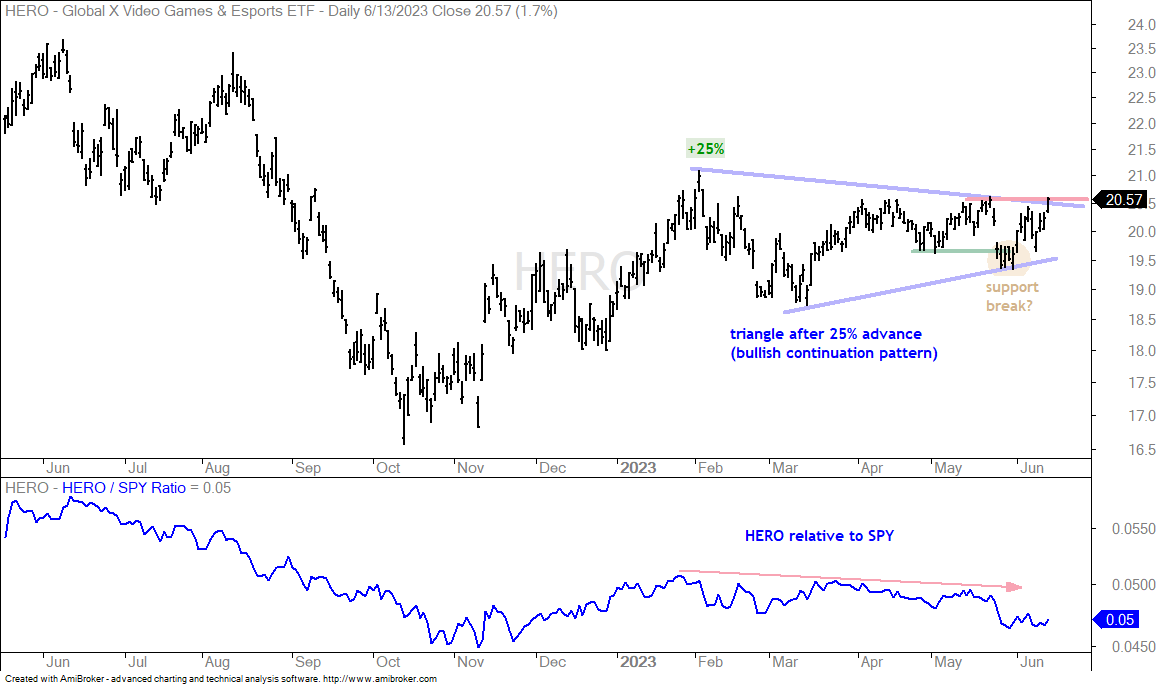
The next chart shows the Video Game eSports ETF (HERO) with a gap down and a support break in late May. This support break did not lead to further weakness. Instead, HERO firmed for a few days and advanced with the rest of the market in June. Overall, it looks like a large triangle after the 25% advance and a breakout is in the making.
EW Consumer Discretionary and Retail Surge (RSPD, XRT)
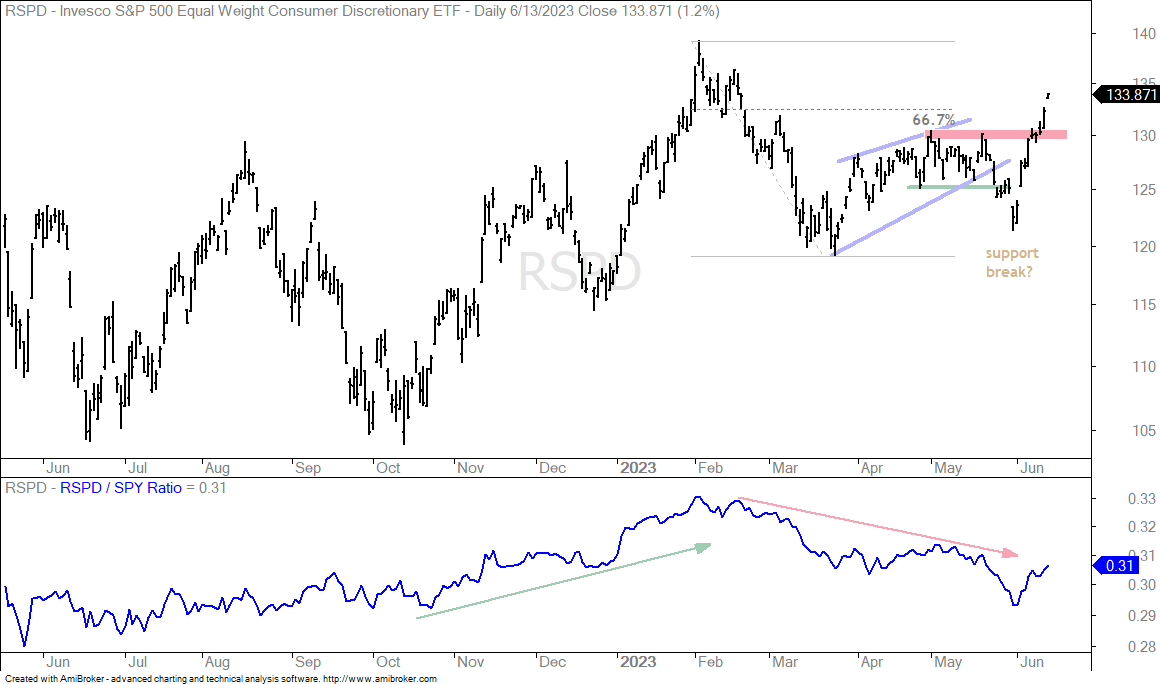
Speaking of leaning the wrong way…. The next chart shows the EW Consumer Discretionary ETF (RSPD) breaking wedge support with a sharp decline in late May. I was leaning bearish on this chart two weeks ago because of weakness in breadth, but this proved wrong as the ETF surged above its May highs. Strength in the most economically sensitive sector is positive for the market.
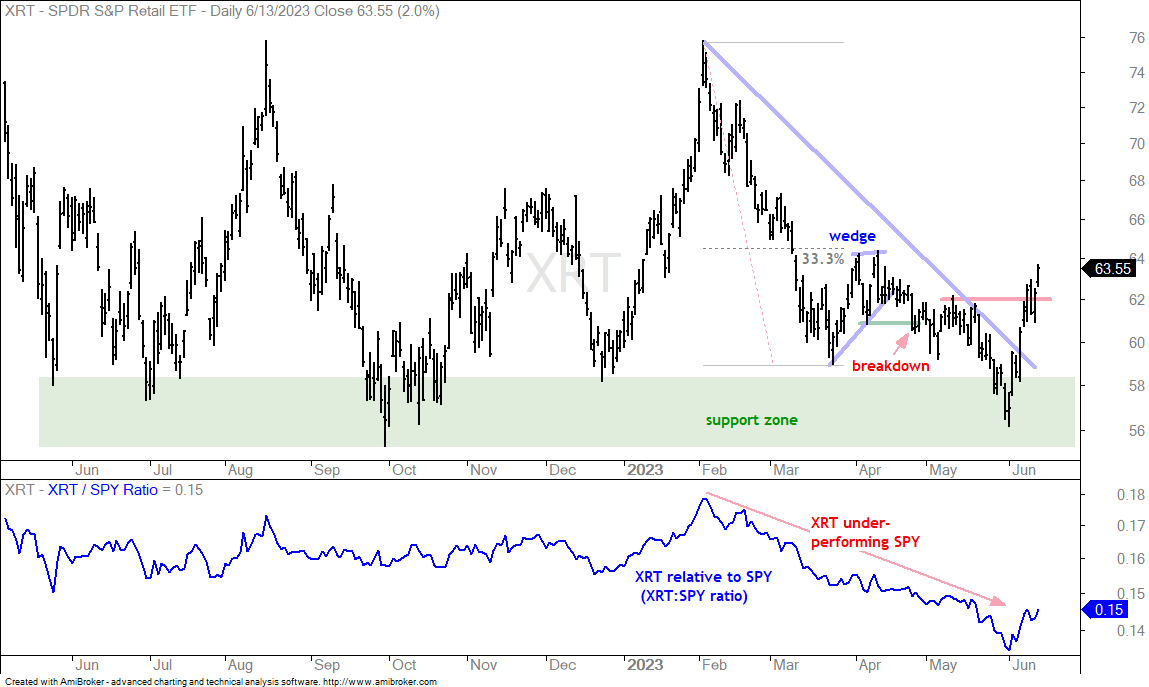
The next chart shows the Retail SPDR (XRT) hitting a support zone that extends back to May 2022 and surging over 10% the last nine days. XRT is basically trend-less over the last 12+ months with range support in the 56-58 area and range resistance in the 74-76 area. The ETF reversed the downswing with a breakout here in June so the swing within this range is up. Strength in retail is also positive for the market because retail spending is a big economic driver.
Healthcare and Med Devices with Deep Pullbacks (XLV, IHI)
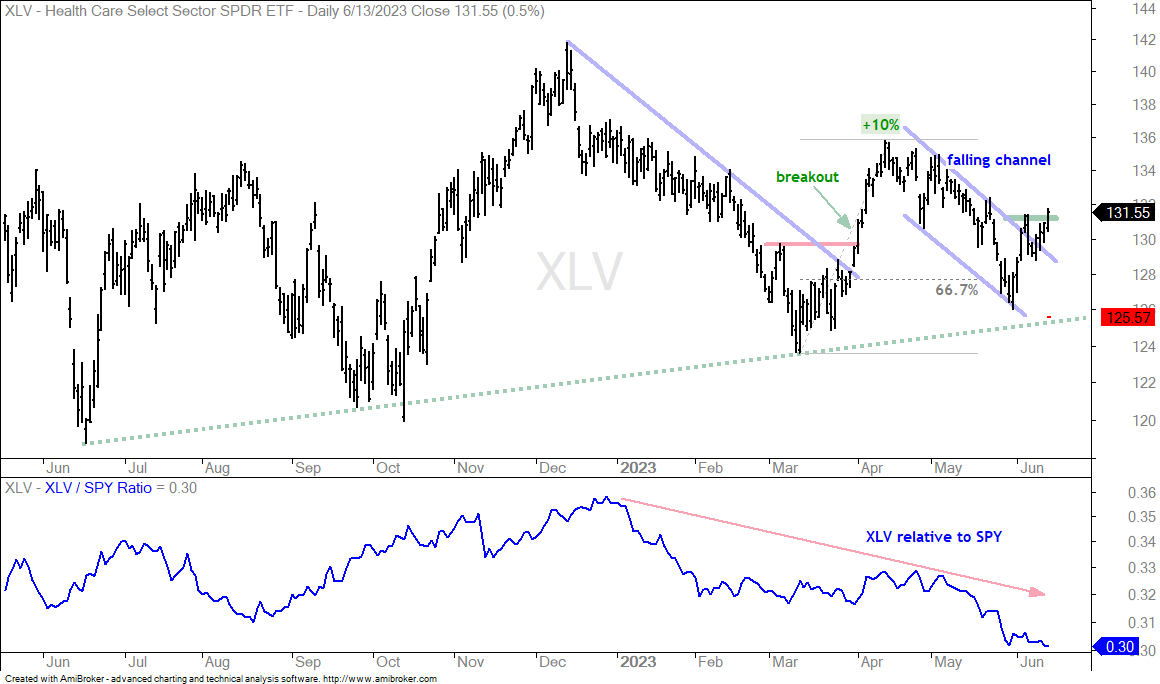
The Healthcare SPDR (XLV) represents the risk-off side of the market and it has underperformed during the risk-on period. Overall, there is still some sort of uptrend on the chart with higher lows since September (green dashed line). The ETF surged 10% into April and then fell back rather hard with a decline that overshot the 67% retracement. Even so, the decline reversed in June and XLV held above the March low. The ETF is breaking out of the falling channel now and this is bullish. The red hash at 125.57 shows the ATR Trailing Stop (22,4). I used four as the multiplier to place the initial stop just below the May low.
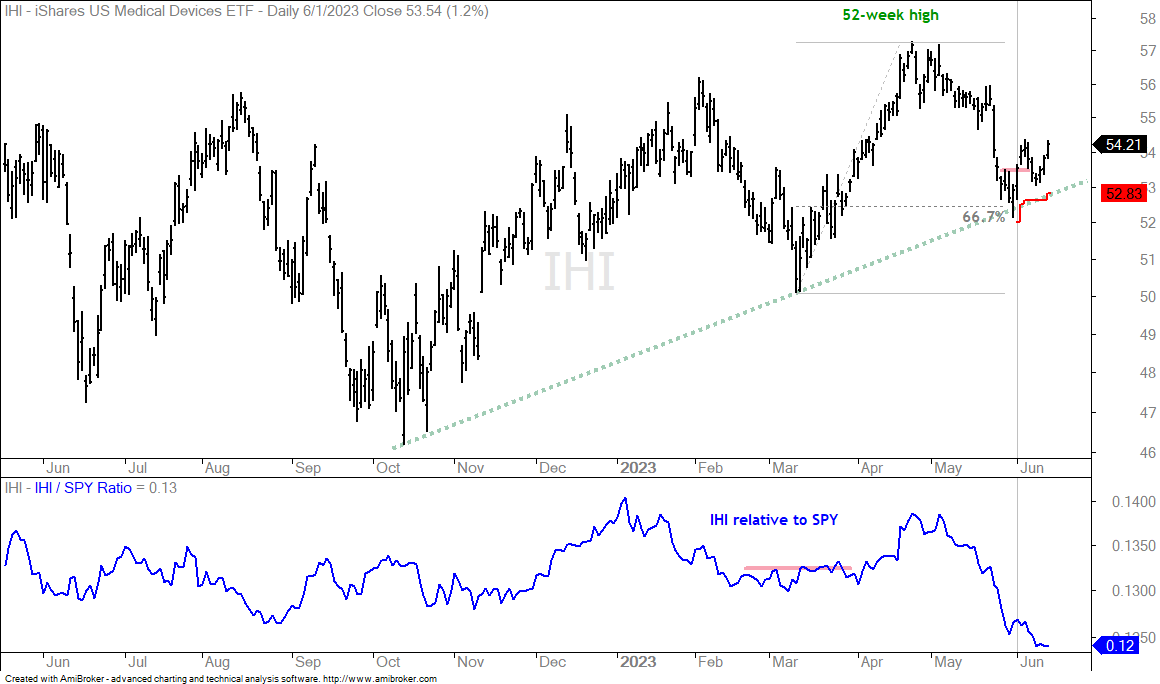
The next chart shows the Medical Devices ETF (IHI) within an uptrend overall. The ETF hit a new high, started with a normal pullback and then fell sharply in late May. This pullback retraced around 67% of the prior advance and IHI reversed with a surge in early June. The red line shows the ATR Trailing Stop (22,2) starting with the breakout on June 1st and starting just below the late May low.
Consumer Staples SPDR Firms after Sharp Pullback (XLP)
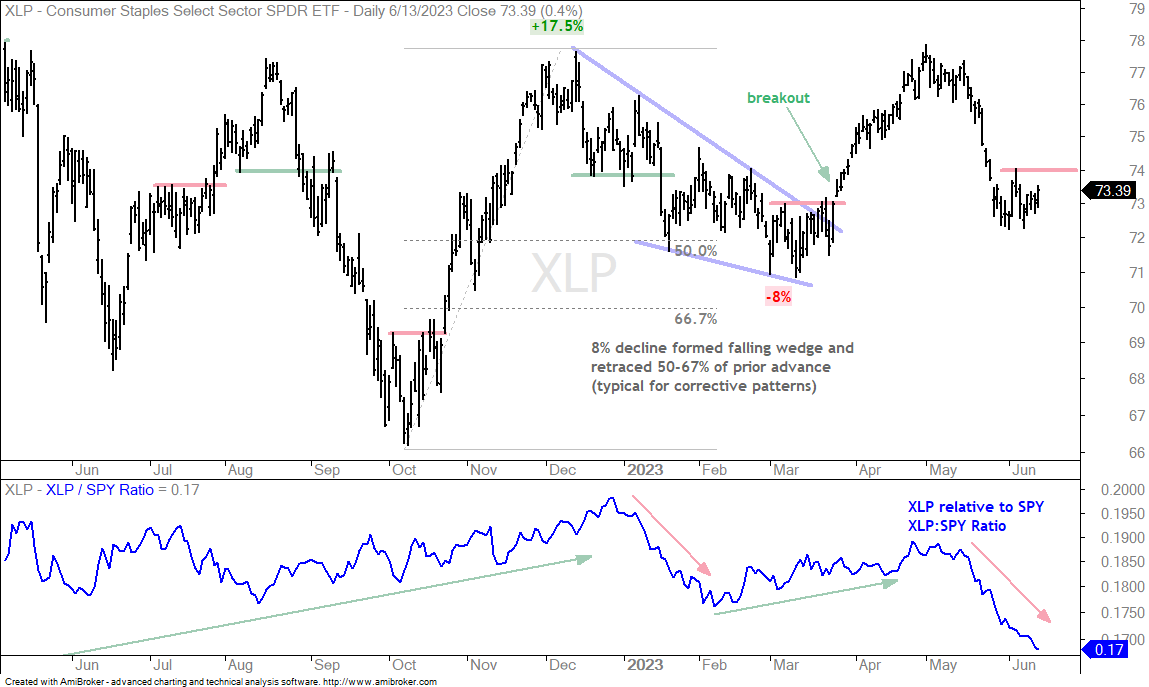
The next chart shows the Consumer Staples SPDR (XLP) with a market leading surge in April and a market lagging plunge in May. There is no real long-term trend because XLP has traded between 66-68 and 78-80 for some two years. The immediate swing is down after the May decline. XLP managed to firm the last two weeks and establish resistance at 74. A breakout here would reverse the swing and be bullish.
Dollar Bullish ETF Surges to Resistance
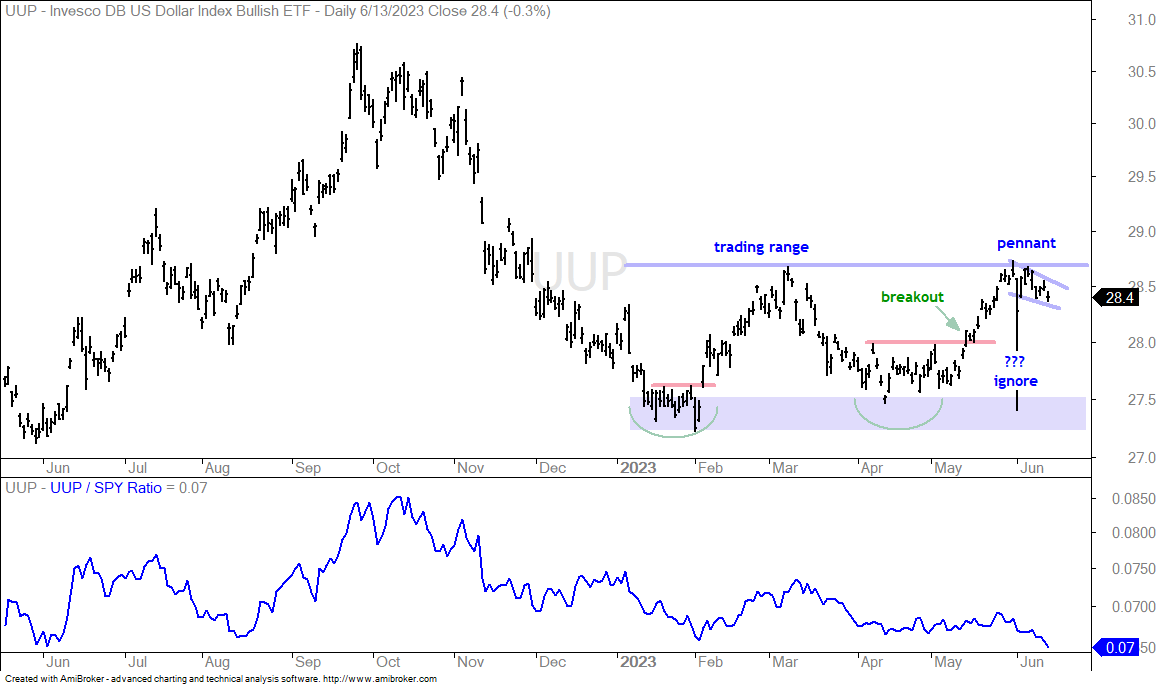
The Dollar Bullish ETF (UUP) surged in May and then corrected in June with a short pullback. Technically, the ETF is in a trading range this year (27.2 to 28.7). The swing within this range is down with a small falling wedge forming (pennant). This is a short-term bullish continuation pattern and a breakout would signal a continuation higher. This would likely lead to a range breakout as well. For now, the swing within the range is down and a breakout is needed to suggest otherwise.
GLD Forms Bearish Pennant (GLD, GDX, SLV)
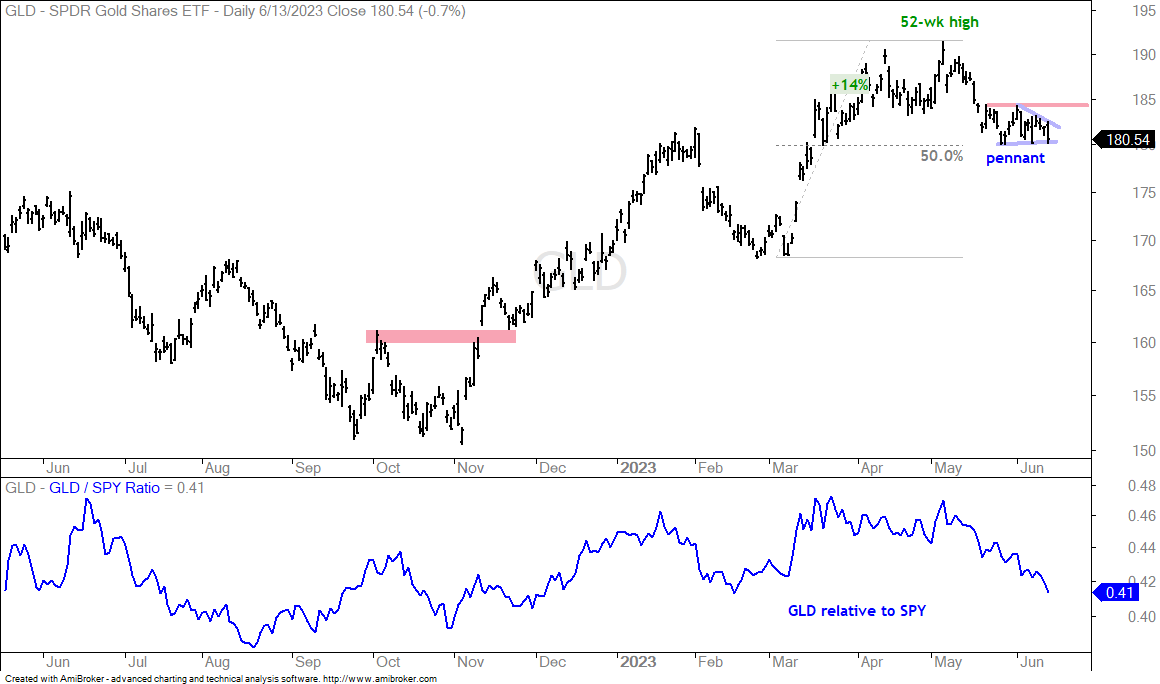
Gold and the Dollar are negatively correlated. As such, an upside breakout in UUP could be negative for the Gold SPDR (GLD), while a UUP downswing could be positive. The chart below shows GLD retracing 50% of its 14% surge with a decline back to 180. The ETF consolidated the last few weeks and this consolidation looks like a pennant. A pennant break would signal a continuation lower. GLD is still in a long-term uptrend and this is deemed a pullback within the uptrend. A breakout, however, is needed to reverse this pullback. The early June high marks resistance and a breakout here would be bullish.
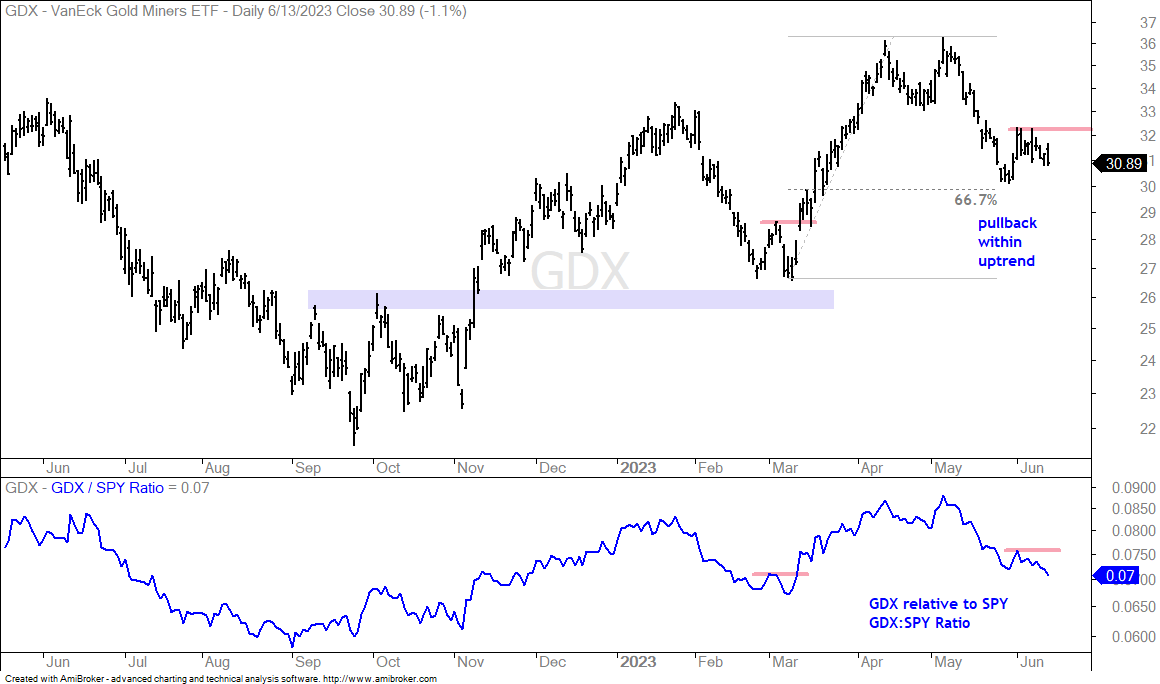
The next chart shows the Gold Miners ETF (GDX) with the early June high marking short-term resistance.
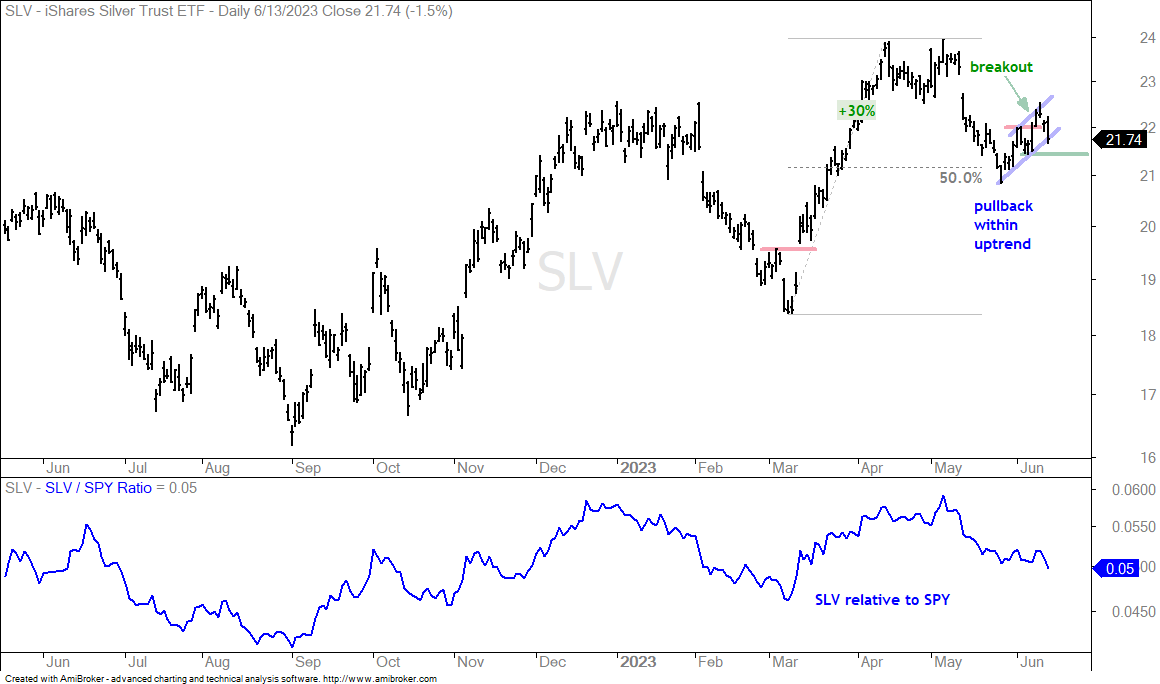
The next chart shows the Silver ETF (SLV) breaking out with a surge above 22 last week. The ETF fell back the last two days, but the short-term trend is up. The concern here is that a bear flag formed (blue lines). A break below the early June low would confirm this pattern and be bearish.