Weight of the Evidence Remains Bullish (CBM, Yield Spreads)
Upside Participation Continues to Improve
New Highs Continue to Expand
SPY Breaks out of Flag and Extends Uptrend
QQQ Breaks out of Pennant, but Remains Extended
DIA Breaks Head-and-Shoulders Resistance
Tech-Related ETFs with Pennant Breakouts (SKYY, CIBR, IGV, SOXX)
Housing Leads as Retail Swings Higher (ITB, XRT)
Regional Banks and Insurance Join July Surge (KRE, KIE)
Clean Energy ETFs Extend on Breakouts (PBW, ACES) Healthcare and Biotechs Struggle (XLV, IBB)
Medical Devices Extends as HC Equipment Sets Up (IHI, XHE)
MLP and Natural Gas Extend on Breakouts (AMLP, FCG)
Agribusiness, Copper and Wood Surge (MOO, COPX, WOOD)
Gold Miners Break out Ahead of Gold (GLD, GDX)
Weight of Evidence Bullish
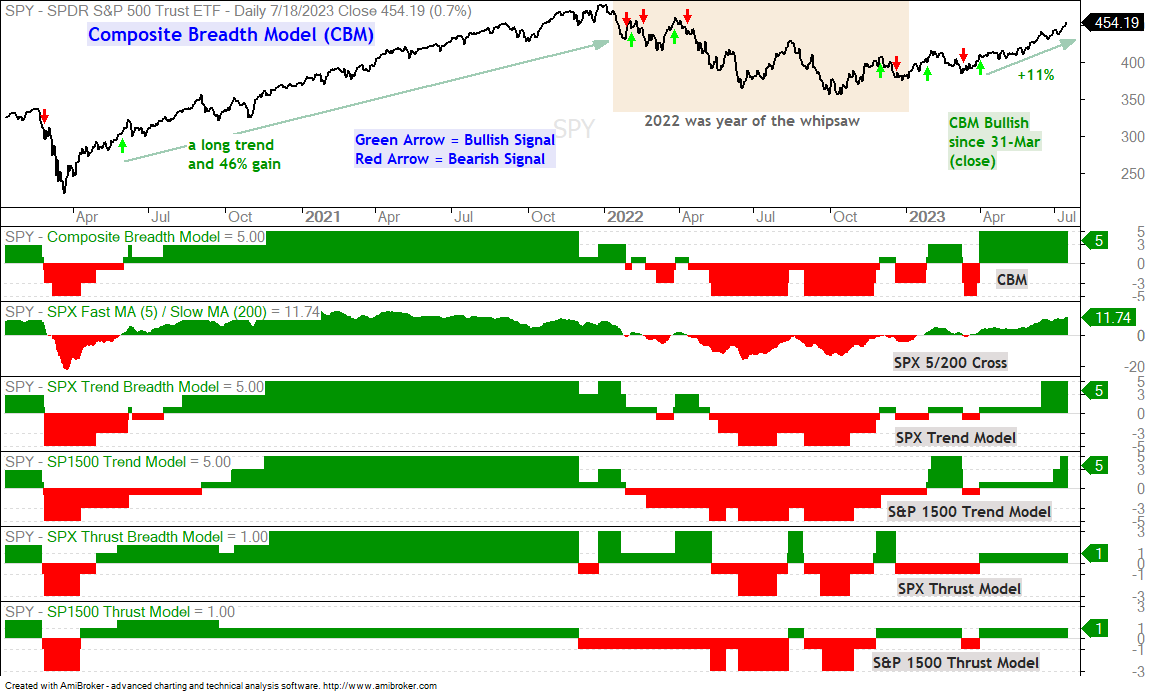
The weight of the evidence remains bullish for stocks. The Composite Breadth Model is positive (since March 31st), yield spreads show no stress and upside participation continues to improve. We are seeing new highs in several tech-related ETFs, the Home Construction ETF and the Industrials SPDR.
Upside Participation Continues to Improve
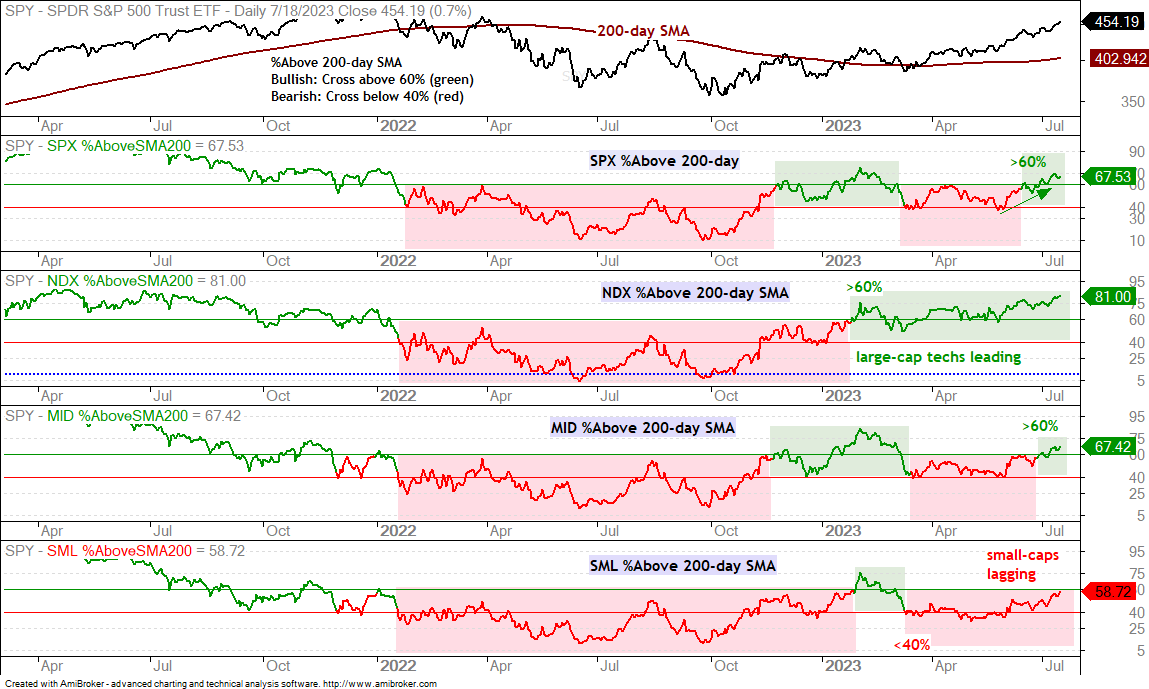
There is no real change as participation continues to improve. The chart below shows the percentage of stocks above the 200-day SMA for the S&P 500, Nasdaq 100, S&P MidCap 400 and S&P SmallCap 600. Nasdaq 100 stocks continue to lead with 81% above their 200-day SMAs. Large-caps are also strong with 67.5% of S&P 500 stocks above their 200-day SMAs. Mid-caps are also showing improvement as MID %Above 200-day moved above 65% for the first time since early March. Even small-caps are seeing improvement with 58.72% above their 200-day SMAs. SML %Above 200-day SMA is still the only one of the four that has yet to turn bullish with a move above 60%.
New Highs Continue to Expand
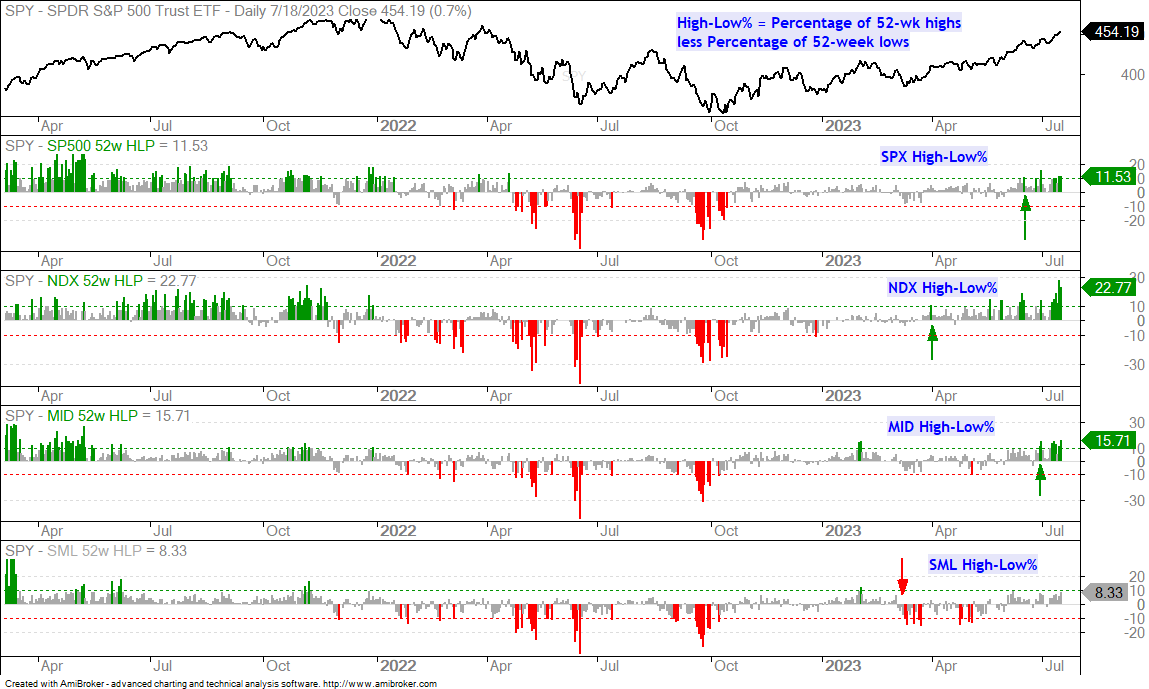
We are also seeing more new highs the last few weeks. The next chart shows the High-Low Percent indicators for the same indexes. High-Low Percent is the percentage of new highs less the percentage of new lows. The green bars show when the indicator exceeds +10%. NDX High-Low Percent exceeded 20% this week and leads. SPX High-Low Percent exceeded 10% and MID High-Low Percent exceeded 15%. Stocks hitting new highs are in strong uptrends and leading. It is positive to see this number expand. Small-caps are still lagging because SML High-Low Percent has yet to exceed +10%. You can’t have everything.
SPY Breaks out of Flag and Extends Uptrend
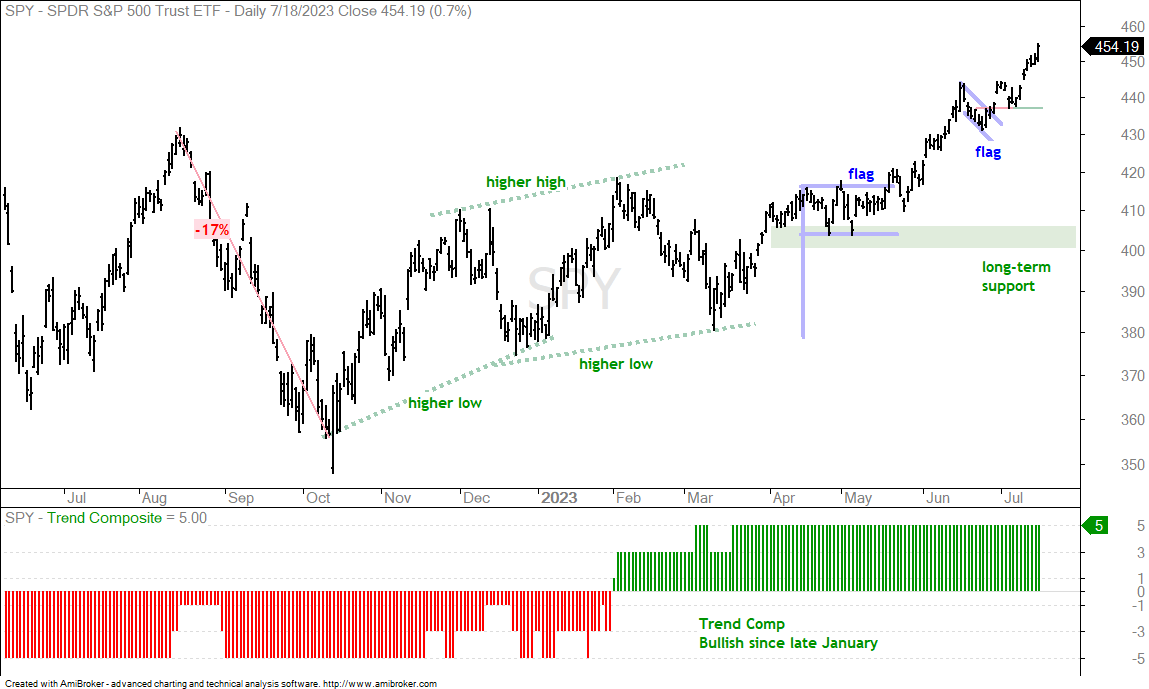
SPY is in a long-term uptrend with a rising channel defining this uptrend. Short-term, the ETF broke out of a small falling flag, tested the breakout with a 2-3 day throwback and surged above 450. SPY is now up around 5% the last three weeks and up 12% since early May. The ETF is looking short-term extended and ripe for a rest, but showing no signs of weakness. The trend is up and strong.
QQQ Breaks out of Pennant, but Remains Extended
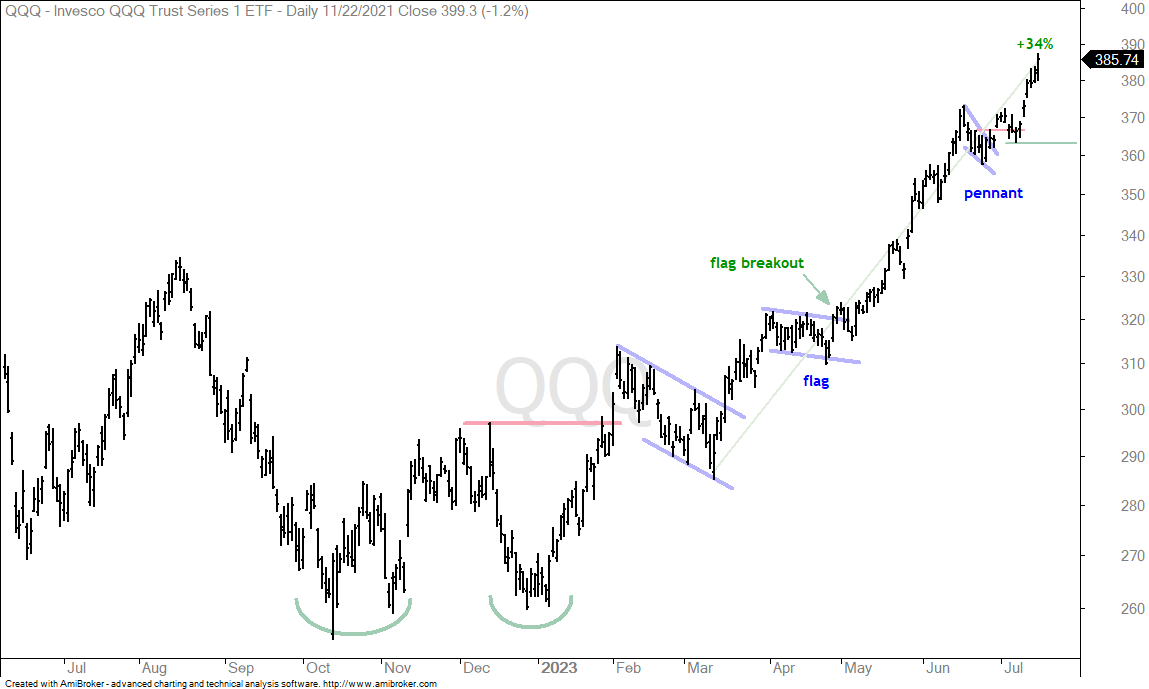
QQQ continues to lead the market with a fresh 52-week high. The ETF is also just 6% from its November 2021 high. There is no setup on this chart, just a strong and leading uptrend. Short-term, QQQ broke out of a pennant, pulled back for 2-3 days and then surged above 380. It is short-term and medium-term extended after big moves, but showing no signs of weakness.
DIA Breaks Head-and-Shoulders Resistance
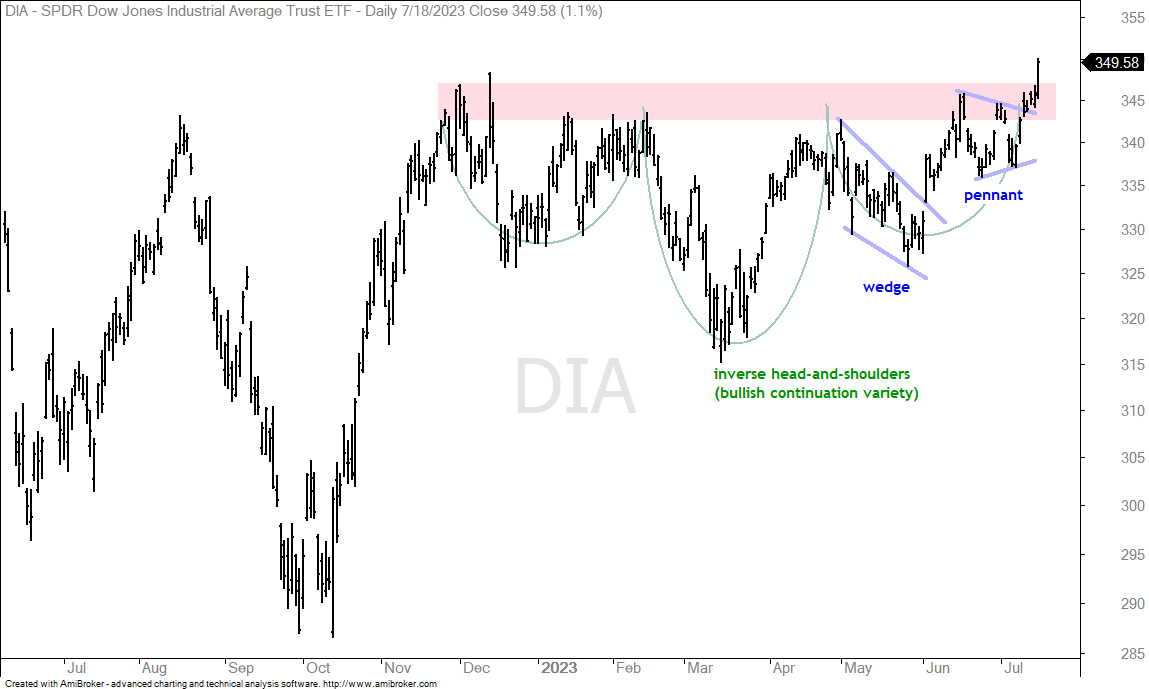
I am not a big fan of the Dow Diamonds (DIA) because the Dow Industrials is a price-weighted average and has just 30 stocks. Nevertheless, DIA broke out of an inverse head-and-shoulders pattern with a surge on Tuesday. The real setups, however, occurred within the right shoulder. Prior to the neckline breakout, DIA formed a wedge and broke out on June 2nd. The ETF then formed a pennant and broke out last week.
Tech-Related ETFs with Pennant Breakouts
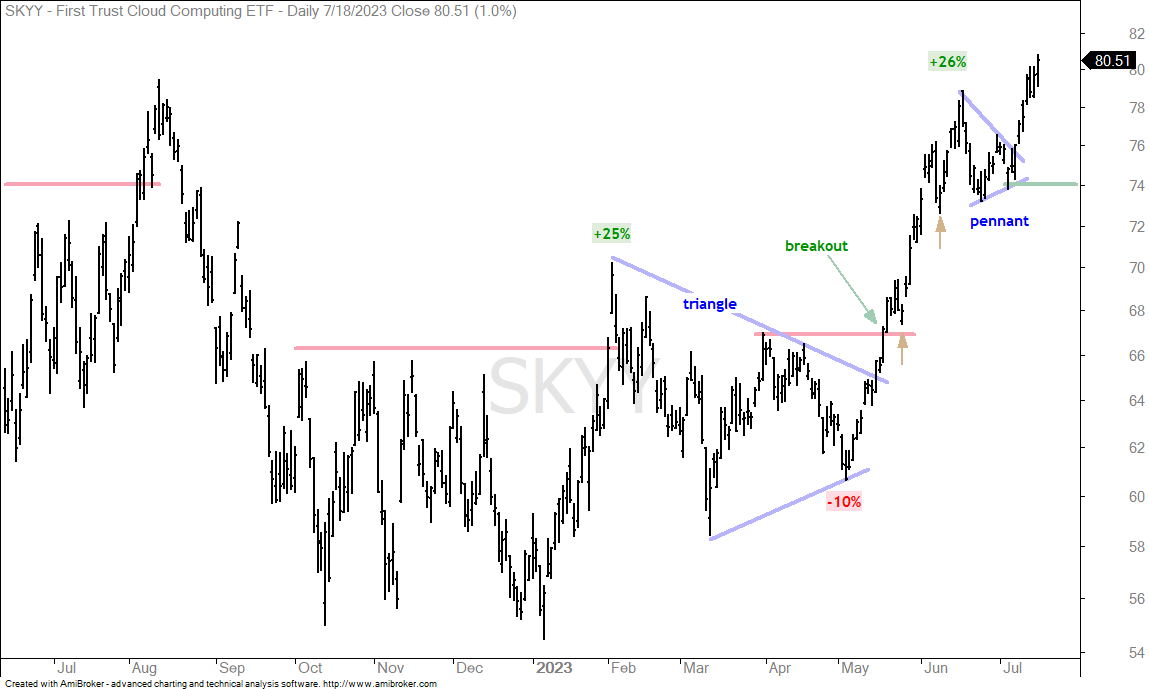
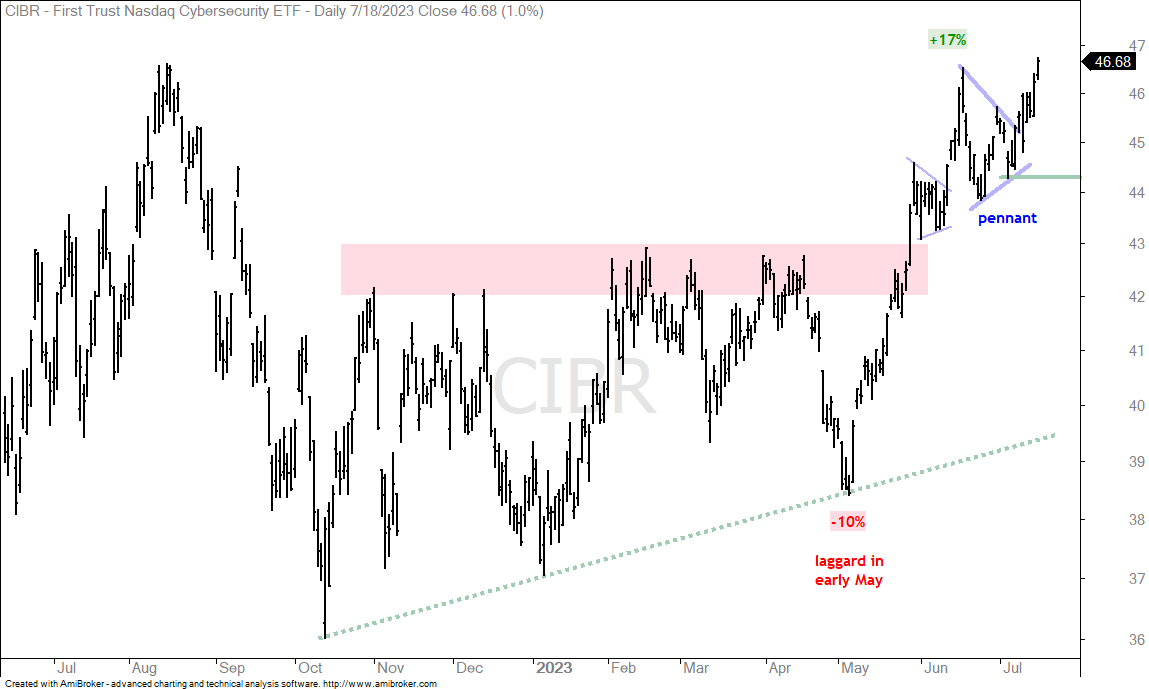
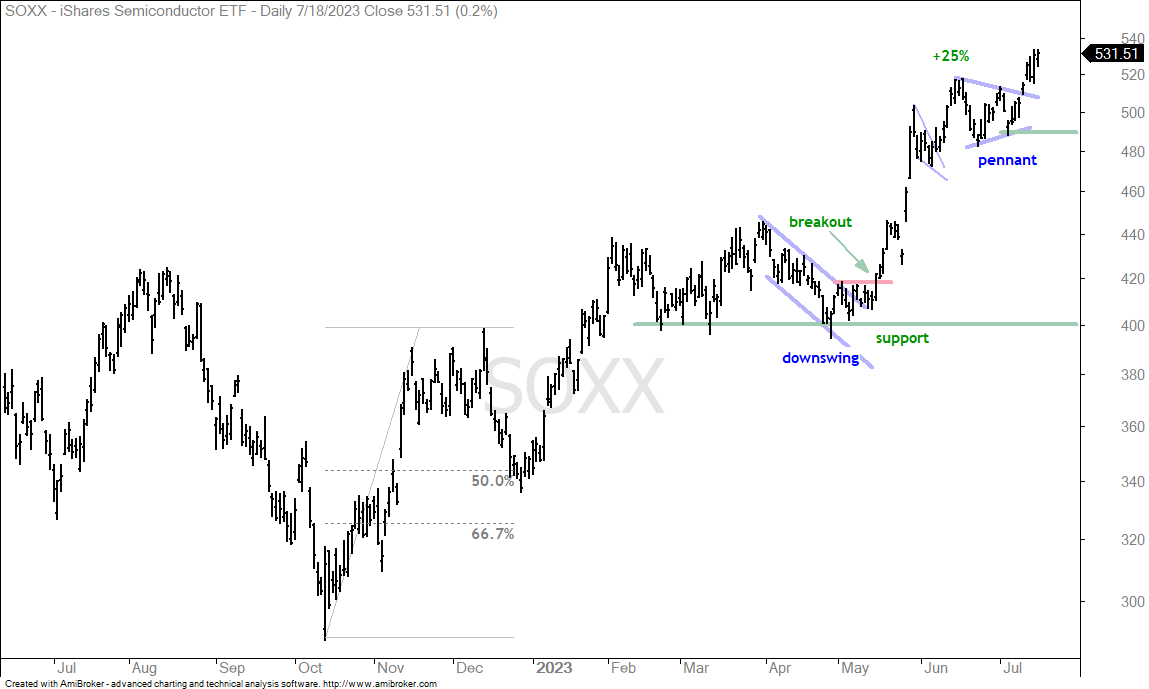
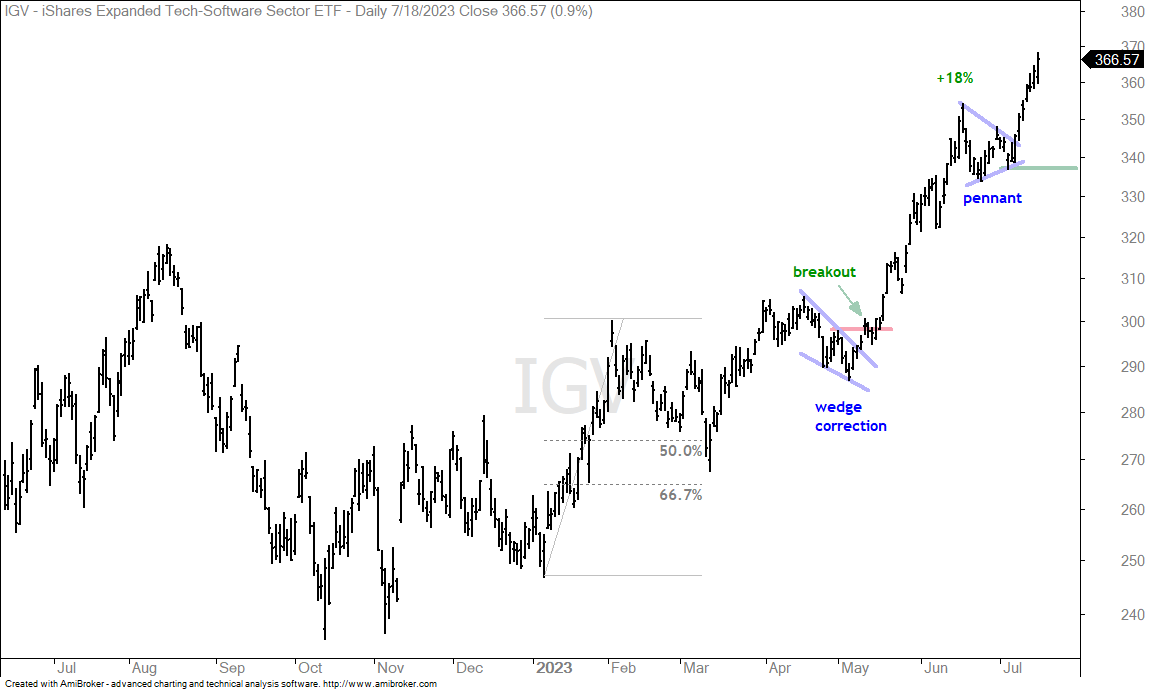
Several tech-related ETFs surged into early June, consolidated with pennants for a few weeks and broke out with surges in July. The pennants provided the bullish setups and the breakouts were the triggers. The lows just before the breakouts mark short-term support (green lines). There are no setups on these charts right now. As we have seen with pennant and flag breakouts in the recent past (yellow arrows), there is sometimes a 2-3 day pullback and then another move higher. This means a 2-3 day pullback could provide an opportunity. The chart below shows the Cloud Computing ETF (SKYY) with support marked at 74.
The chart below shows Cybersecurity ETF (CIBR) with support marked at 44.29.
The chart below shows the Semiconductor ETF (SOXX) with support marked at 489.
The chart below shows the Software ETF (IGV) with support marked at 337.
Housing Leads as Retail Swings Higher (ITB, XRT)
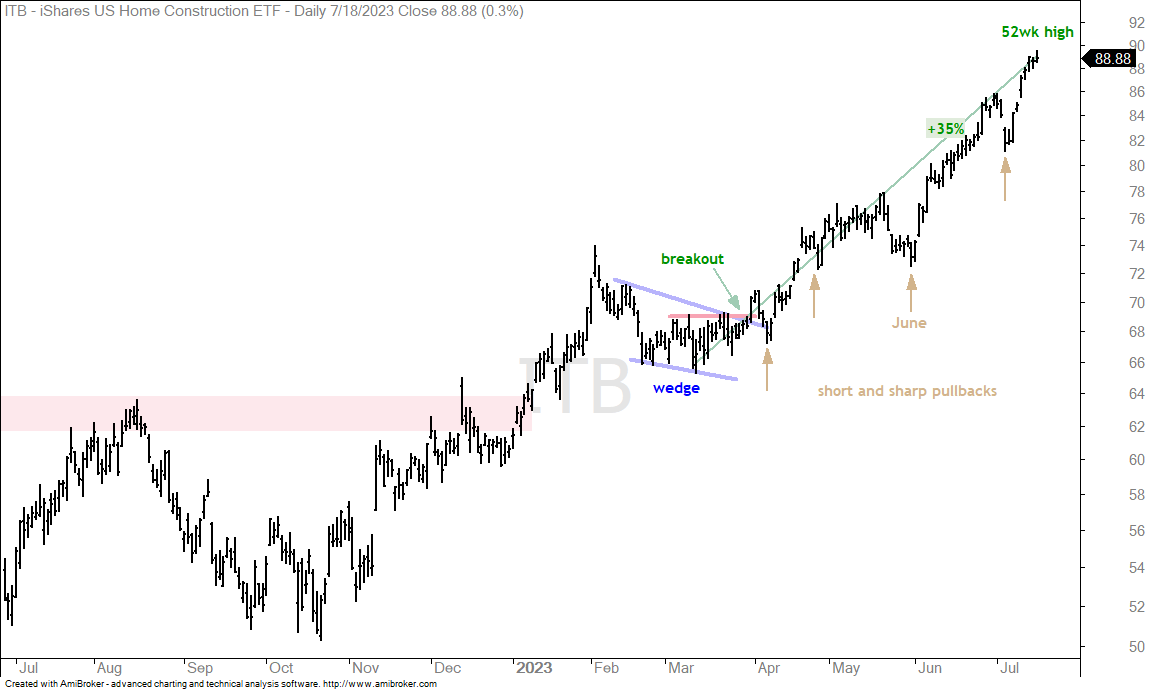
The Home Construction ETF (ITB) continues to lead the market with a fresh 52-week high. The yellow arrows show short and sharp pullbacks along the way. Three of the four pullbacks lasted 2-3 days and the one in June lasted eight days.
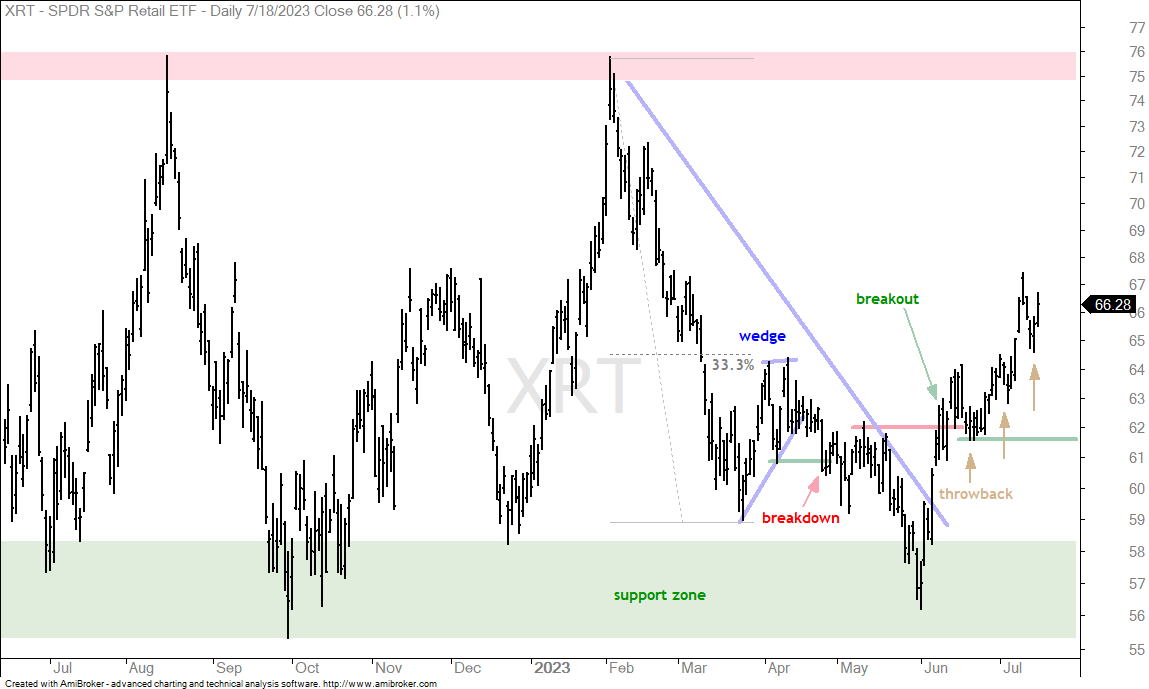
The Retail SPDR (XRT) is well short of a 52-week high, but the ETF is moving in the right direction. Overall, XRT is in a large trading range. It bounced off support in early June and broke resistance to reverse its downswing. The yellow arrows show the short-sharp pullbacks along the way. I would mark key support in the 61-62 area.
Regional Banks and Insurance Join July Surge (KRE, KIE)
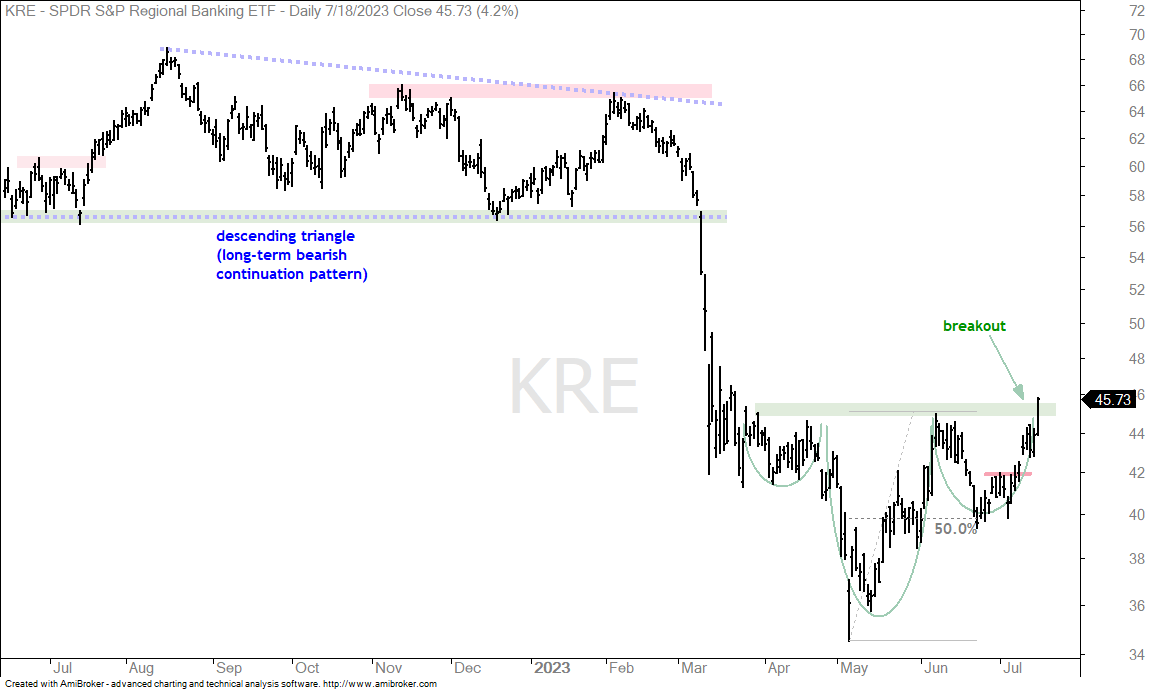
The Regional Bank ETF (KRE) got pommeled in March with the Silicon Valley Bank crisis and got hit again in early May with four-day 15% decline. The ETF then surged back to the April highs in June, dipped with a 50% retracement and surged above the April-June highs on Tuesday. Overall, the pattern looks like an inverse head-and-shoulders pattern of the reversal variety. On the right shoulder, notice how KRE firmed near the 50% retracement and broke short-term resistance at 42 last week. KRE is not a leader, but the breakout is bullish and it could recoup a portion (~50%) of the February-May decline. At the very least, strength in this beaten down group shows increasing confidence.
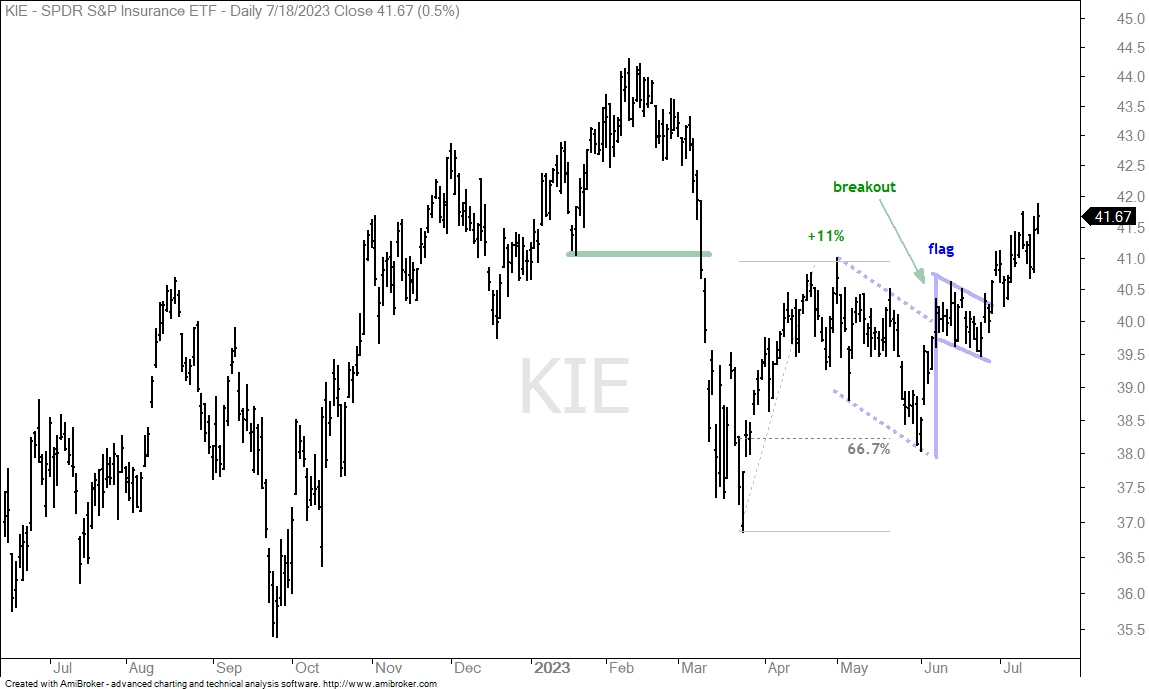
The Insurance ETF (KIE) was also hit hard in March, but it held well above the March low during the May-June pullback. Technically, it held up better than KRE. Short-term, KRE surged in early June, formed a bull flag and broke flag resistance on June 29th. Insurance is the not the most exciting group out there, but it is participating in the July surge.
Clean Energy ETFs Extend on Breakouts (PBW, ACES)
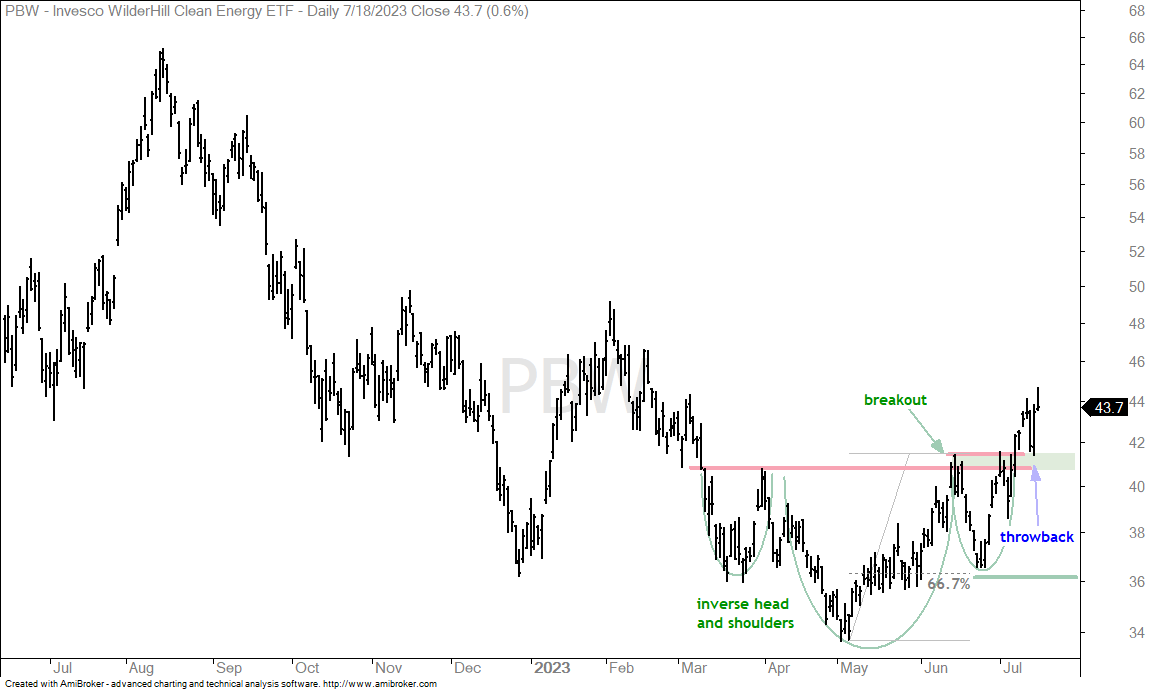
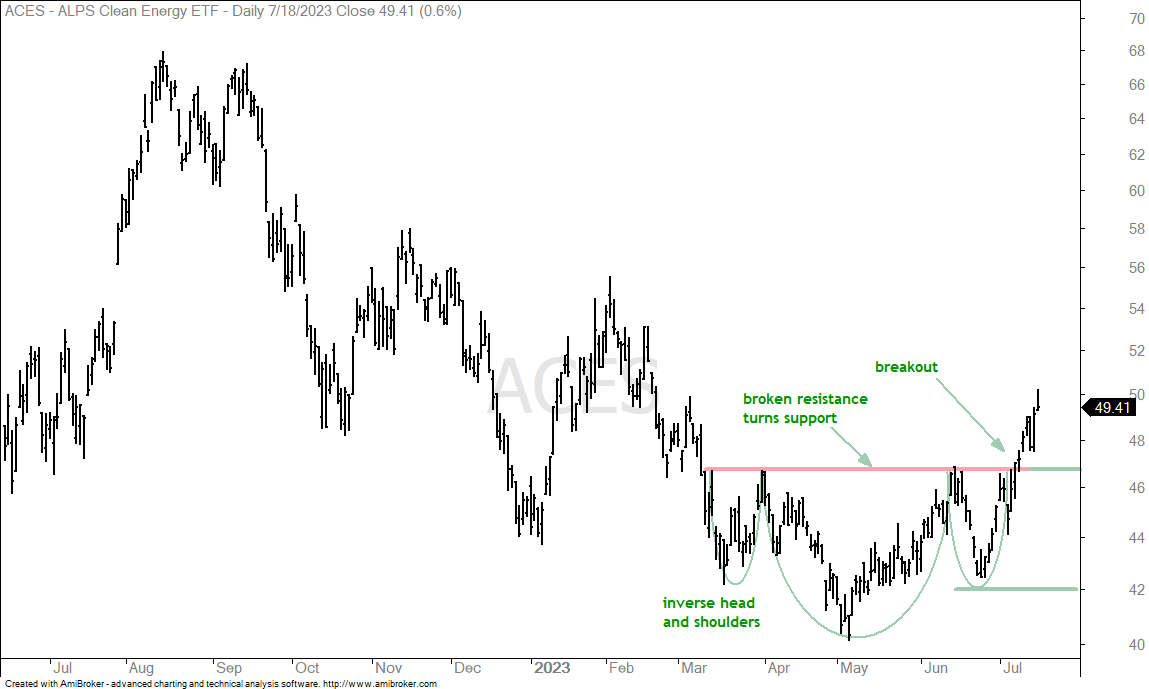
The Clean Energy ETF (PBW) and Clean Energy ETF (ACES) both formed inverse head-and-shoulders patterns from spring to summer. They broke neckline resistance zones with surges in July to confirm these patterns. These patterns reflect a basing process that extends for months. Neckline resistance represents selling pressure (resistance) and the breakout is a victory for buying pressure. Broken resistance then turns into the first support zone to watch going forward. The chart below shows PBW breaking out and falling back to the resistance zone in the 41 area. This is a throwback to test the breakout. PBW surged on Monday and this reinforces support in the 41 area.
The next chart shows ACES with a breakout and broken resistance turning support in the 47 area. I would not call this a “hard” support zone. Instead, I would watch the 46-47 area should ACES pull back.
Healthcare and Biotechs Struggle (XLV, IBB)
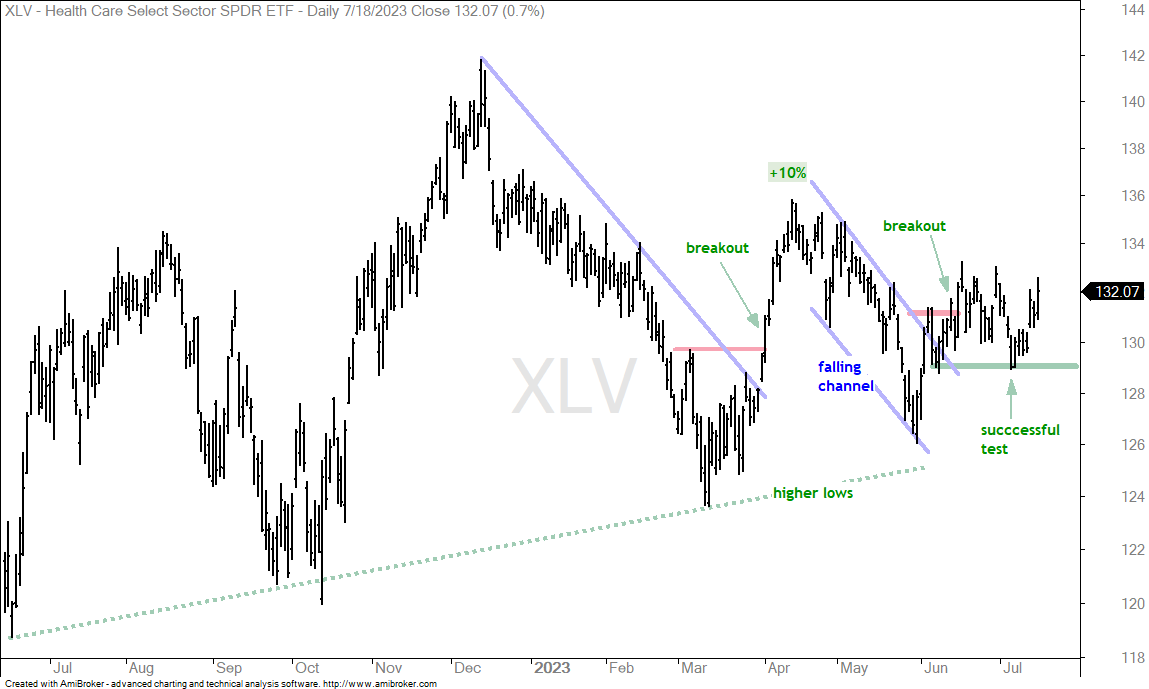
The Healthcare SPDR (XLV) has a breakout working since mid June, but is struggling to follow through. The breakout is holding for the most part and the chart remains bullish. XLV broke out of a falling channel with a surge in the first half of June. The ETF then successfully tested breakout support at 129 with a sharp pullback and bounce here in July. Even though XLV is not leading, the chart is bullish as long as 129 holds.
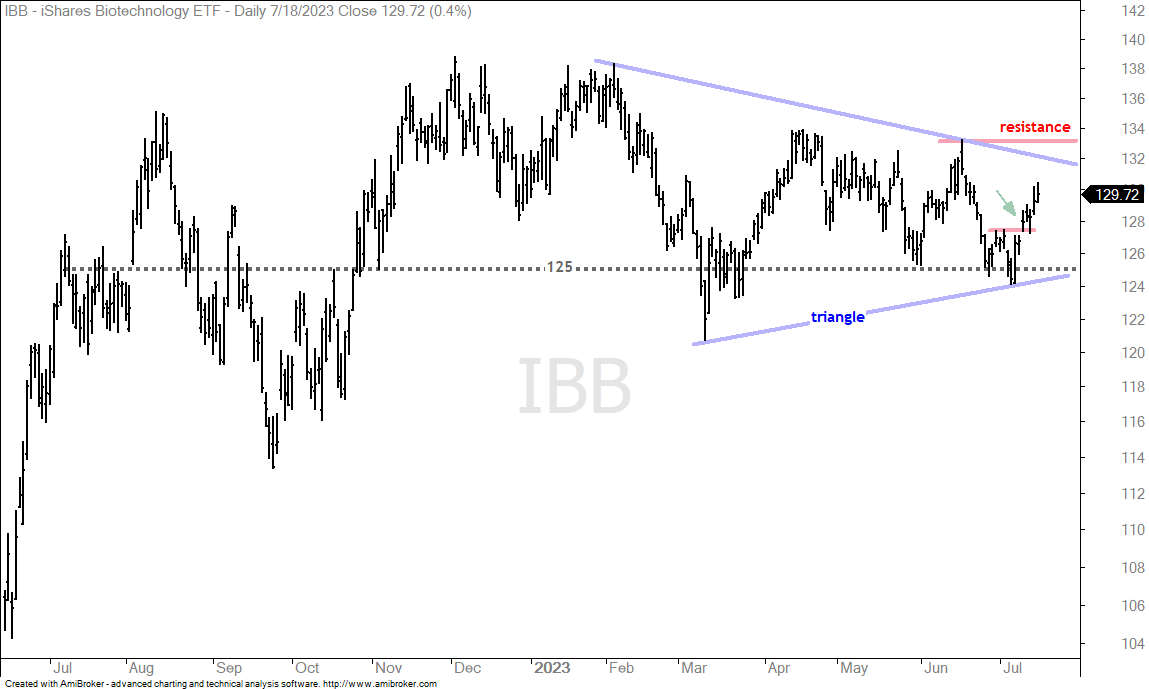
The next chart shows the Biotech ETF (IBB) within a trading range for most of the past year. The gray dotted line is at 125 and the ETF crossed this level over a dozen times since July 2022. Most recently, IBB dipped below 125 in early July and bounced the last seven days. Overall, I see a big triangle consolidation with resistance at 133. A breakout here would be long-term bullish. Short-term, the swing within this triangle is up after the short-term breakout five days ago (green arrow).
Medical Devices Extends as HC Equipment Sets Up (IHI, XHE)
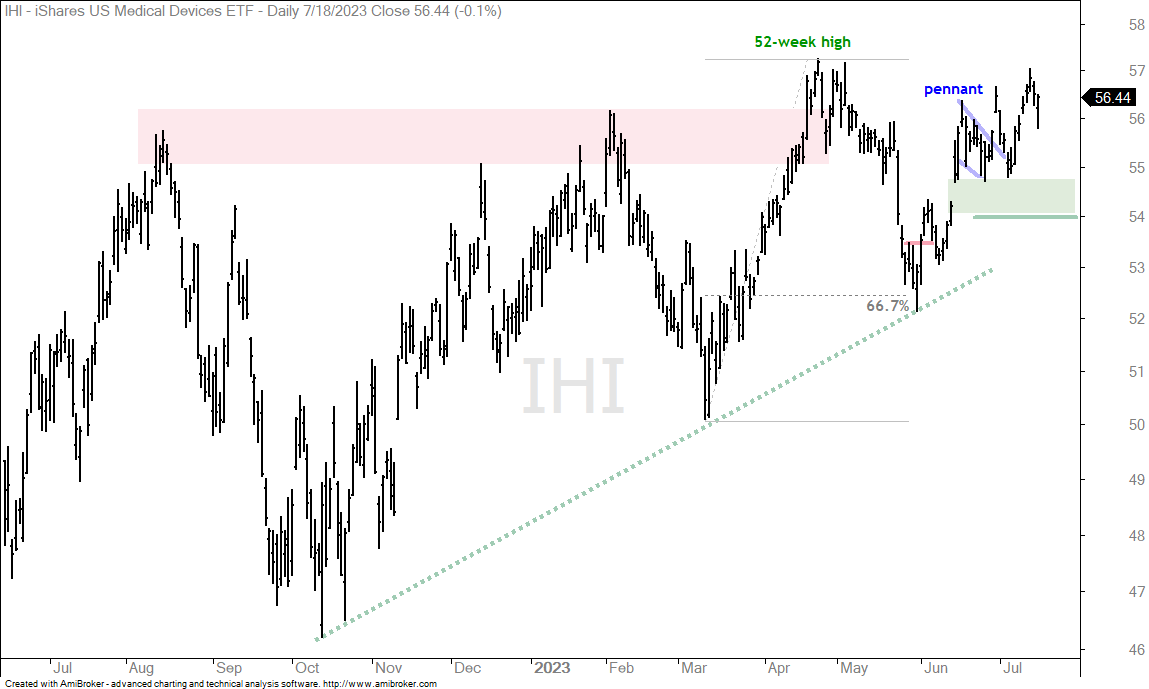
The Medical Devices ETF (IHI) is leading within the Healthcare sector. The ETF surged in June, formed a bullish pennant into early July and broke out of this pennant. The advance since early June has been quite choppy, but IHI is close to a 52-week high and in a clear upswing. I am marking support at 54.
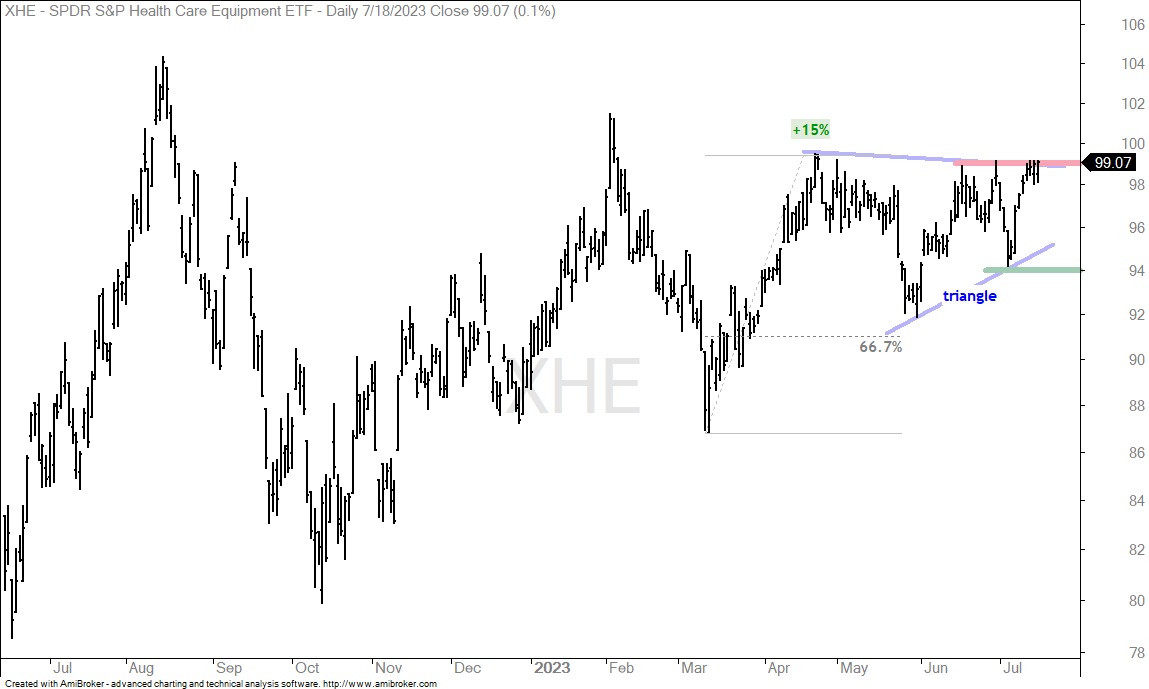
The Medical Equipment ETF (XHE) sports a bullish triangle and is on the verge of a breakout. XHE surged some 15% in March-April and then retraced around 67% of this surge with a pullback into early June. The pullback was quite sharp, but XHE managed to firm and get back to the upper 90s. Overall, a triangle formed and this is a bullish continuation pattern. XHE is on the verge of a breakout here.
MLP and Natural Gas Extend on Breakouts (AMLP, FCG)
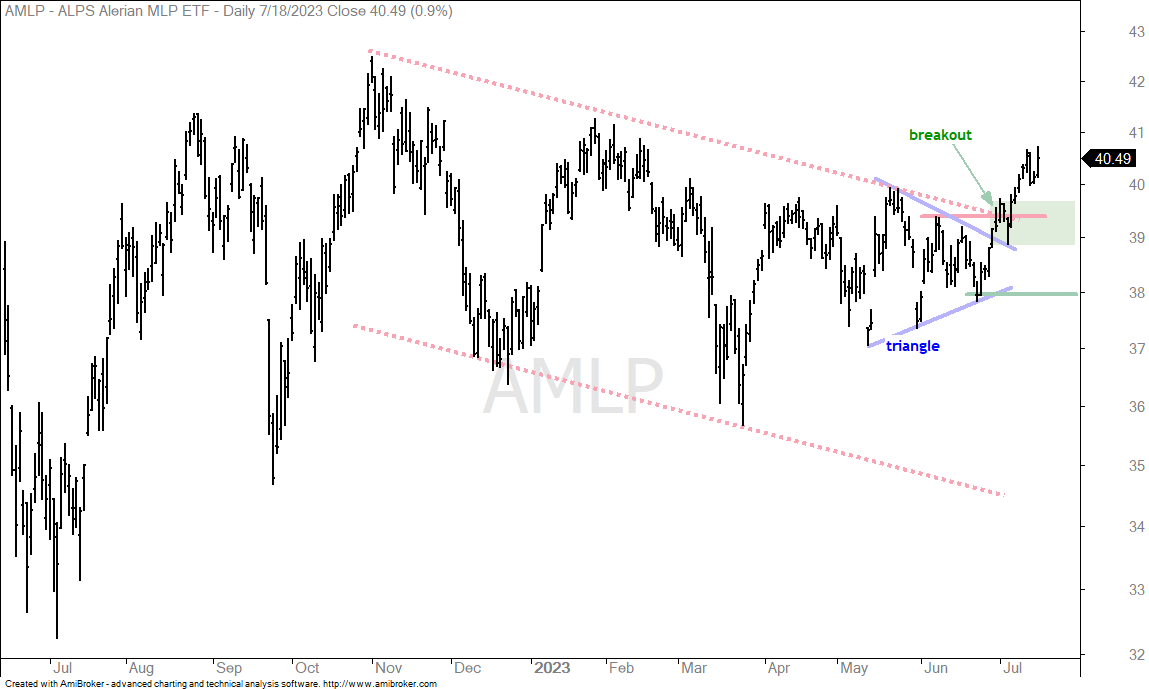
The MLP ETF (AMLP) is making a bid to reverse an eight month downtrend (since November). The red dotted lines show a large falling channel and a breakout with the July surge. We can also see a triangle and triangle breakout. The green shading marks a support zone to watch should we get a pullback to the breakout zone.
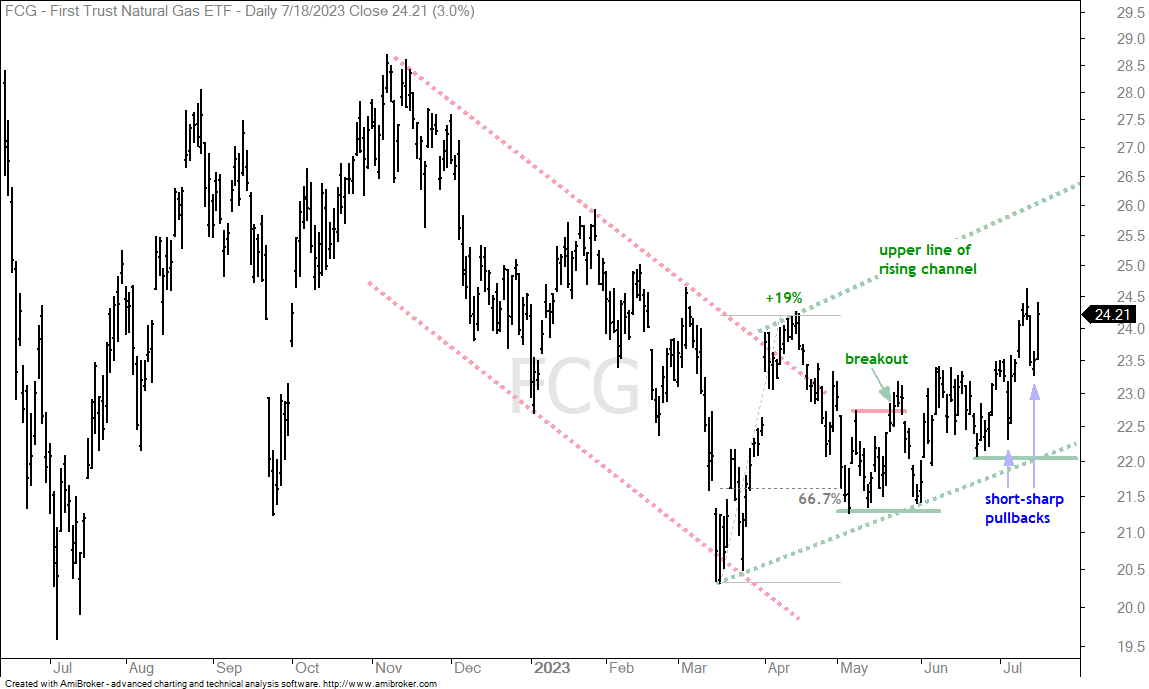
The Natural Gas ETF (FCG) chart is quite messy, but I am seeing a downswing into March and an upswing over the last few months. The green dotted lines mark a possible rising channel. FCG surged 19% in March-April, retraced around 67% with a deep pullback into May and then broke out in late May. Price action since this breakout has been very choppy, but price seems to be working its way higher. There were two short-sharp pullbacks in July and FCG immediately recovered. I will stay bullish as long as 22 holds and target a move to the 26 area.
Agribusiness, Wood and Copper Surge (MOO, COPX, WOOD)
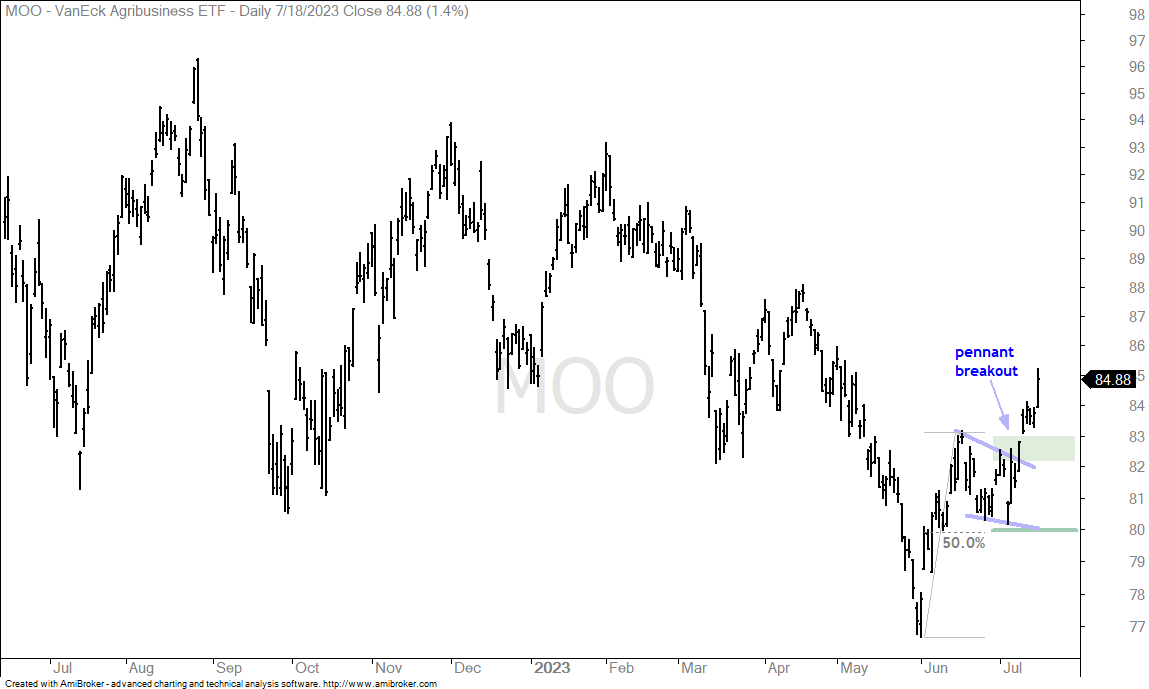
I highlighted the Agribusiness ETF (MOO) last week as it broke out of a bullish pennant. The ETF is not a leader because it hit a 52-week low in late May. Even so, I was impressed with the June rebound and the pennant, which is a short-term bullish continuation pattern. MOO broke out with a surge in July and the breakout zone around 82-83 turns first support to watch should we get a throwback.
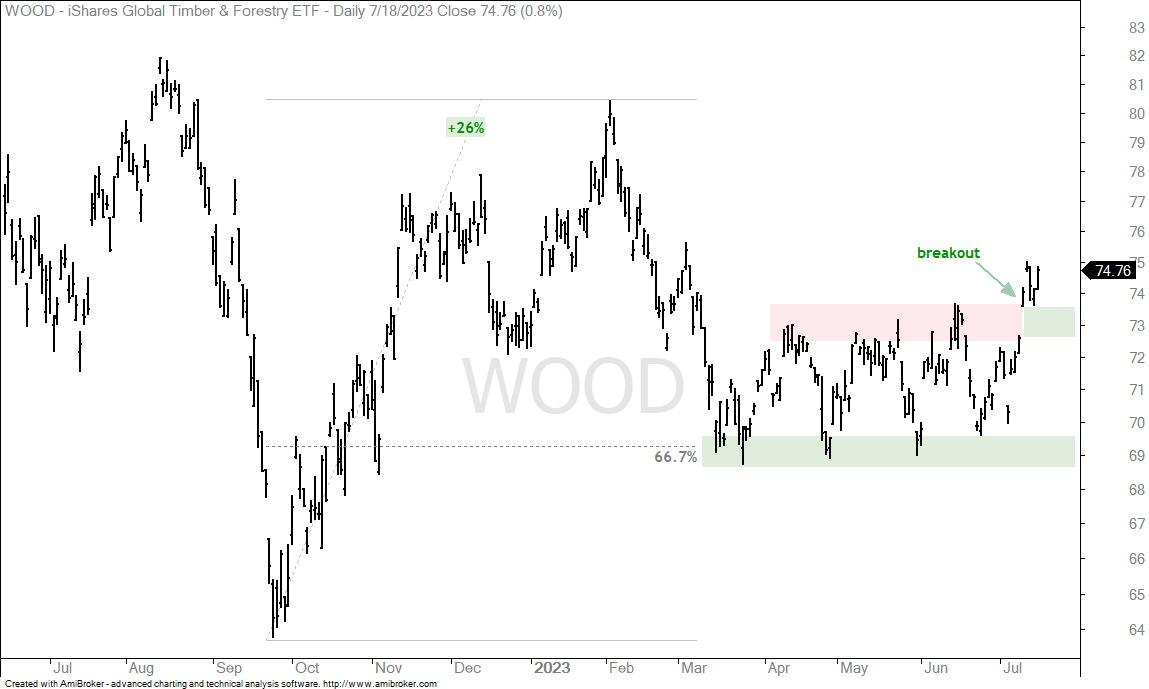
The next chart shows the Global Timber Forestry ETF (WOOD) surging some 26% into February. The ETF then retraced around 67% with a decline into March and found support in the 69 area the next four months. A trading range formed since March and WOOD broke range resistance with a surge in July.
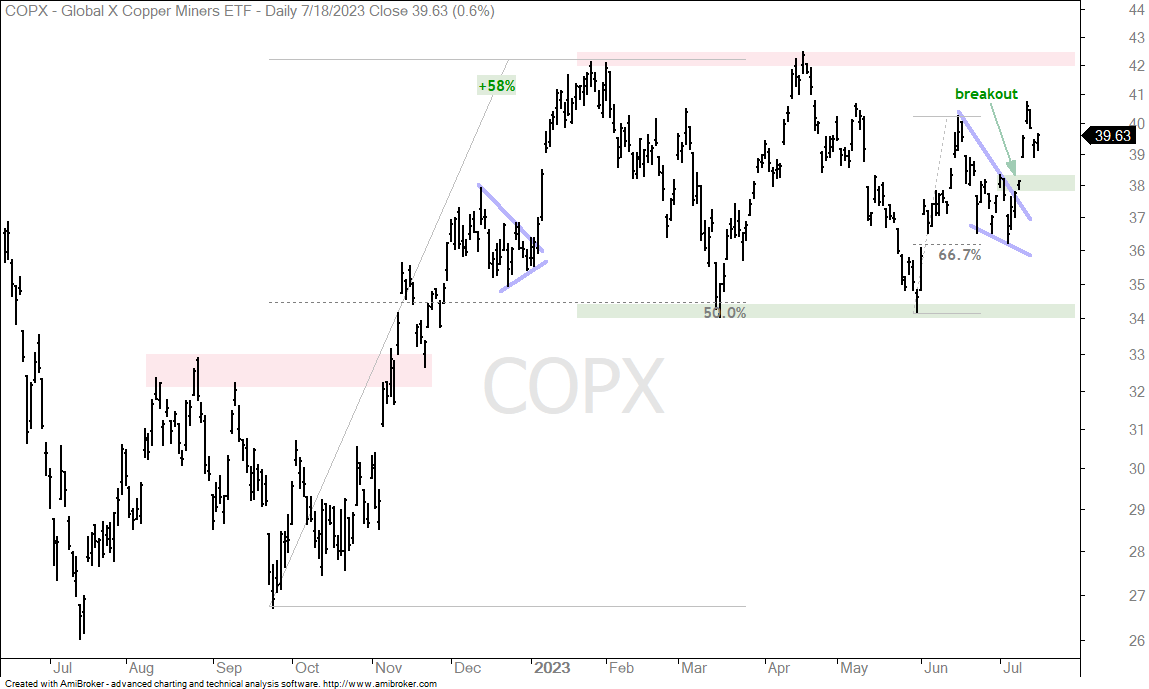
The next chart shows the Copper Miners ETF (COPX) surging some 58% into February and then moving into a trading range. Range resistance is set in the 42 area and range support is at 34. The swing within the range is up after the wedge breakout.
Gold Miners Break out Ahead of Gold (GLD, GDX)
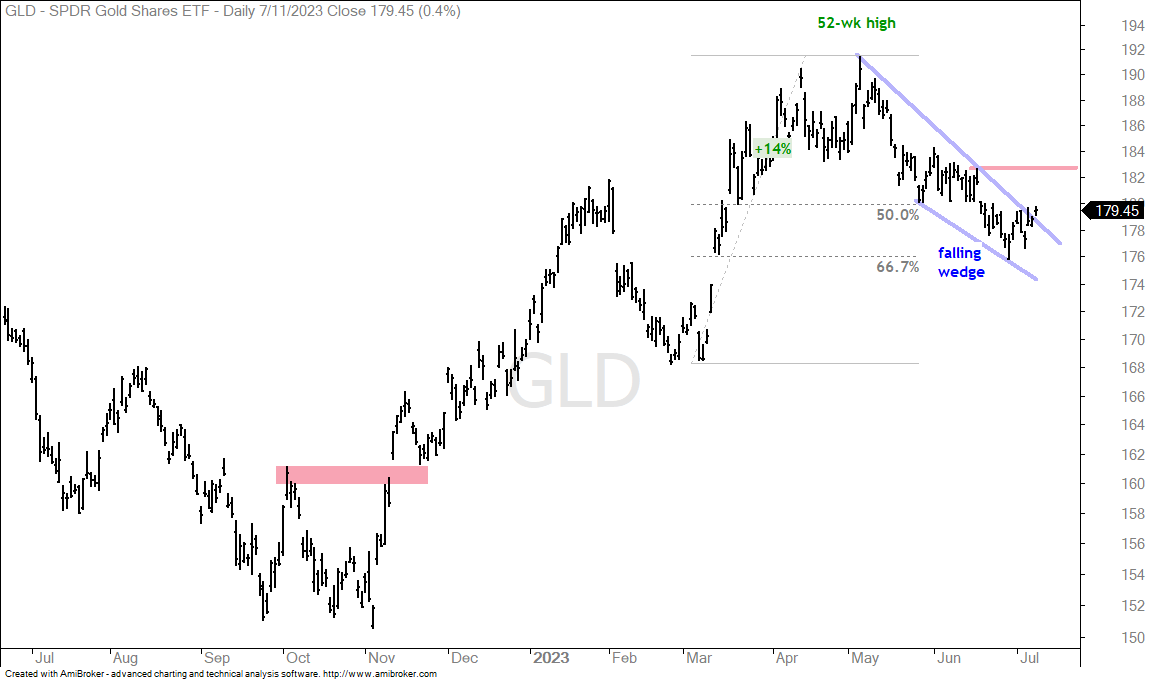
The Gold SPDR (GLD) finally reversed the falling wedge with a surge and breakout. The chart shows GLD hitting a new high in early May and then retracing around 67% with a falling wedge into early July. This two-month pullback is considered a correction within a bigger uptrend. GLD broke the upper trendline of the wedge last week and followed through with a breakout at 183 this week. The green shading marks the first support level to watch should we get a throwback.
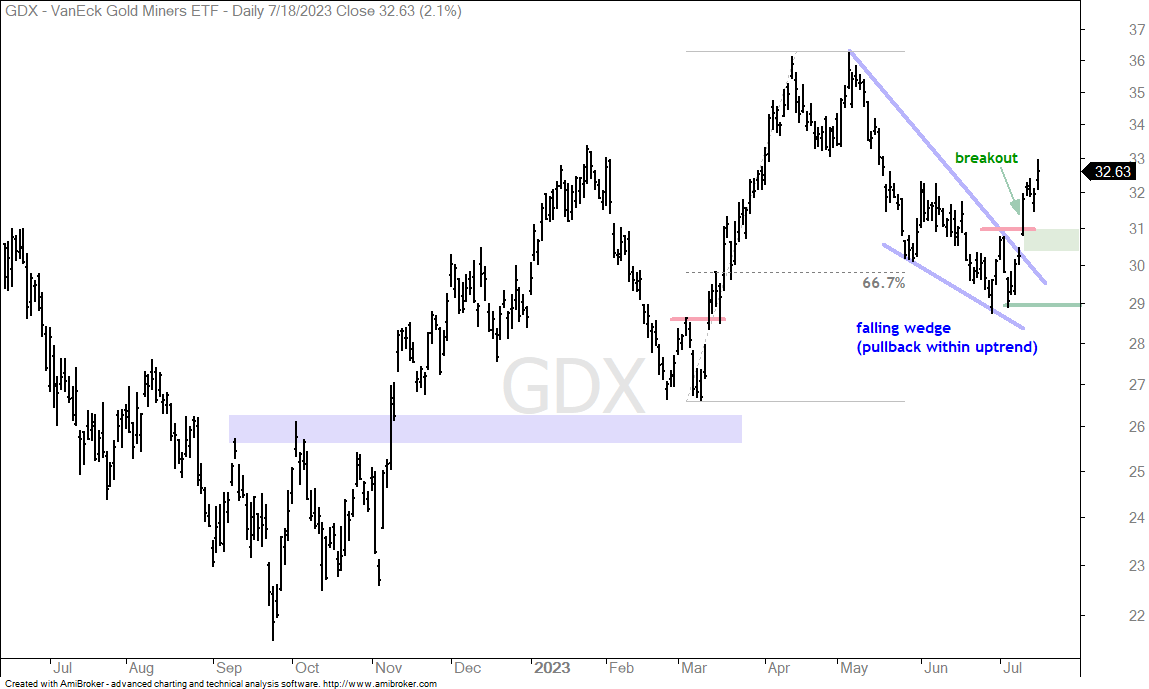
As noted last week, the Gold Miners ETF (GDX) established a clear resistance level to watch and broke this level with a surge last Wednesday. This breakout reverses the falling wedge and ends the correction. As such, it signals a continuation of the bigger uptrend. The green shading marks first support in the 30.3-31 area. This is the area to watch should we get a 2-3 day throwback.