Tuesday June 20th: Rotational Trading Strategy for Stocks (Part 2)
Wednesday June 21st: Market/ETF Report and Video
Thursday June 22nd: Rotational Trading Strategy for Stocks (Part 3)
Video and Report Headlines
CBM Remains at +5 and SPX in Uptrend
Yields Spreads and Fed Balance Sheet Show No Signs of Stress
New Highs Expand within S&P 500
Large/Small Divide Reflected in %Above 200-day SMA
SPY Gets Two-Day Pullback
QQQ Extends Steep Move
Throwback Support for RSP and MDY
Small-caps ETFs Consolidate after Surges (IJR, IWM, IWO)
Tech ETFs Still Leading, but they are Short-term Overbought
Insurance ETF Forms Pennant Near Breakout (KIE)
Healthcare and Biotech Breaks Out of Channels (XLV, IBB)
Medical Devices ETF Extends on Breakout (IHI)
Natural Gas and Oil Services Set Up (FCG, XES)
Transformational Data Sharing ETF Challenges Resistance (BLOK)
Dollar Falls – And So Does Gold
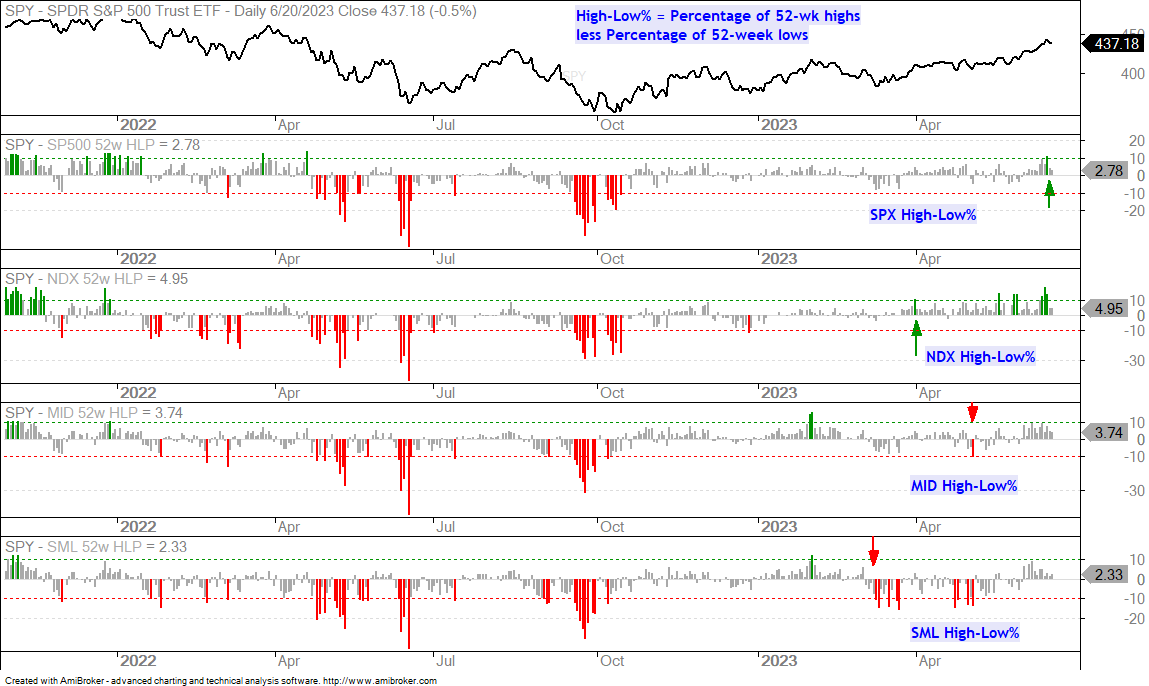
New Highs Expand within S&P 500
High-Low Percent is the percentage of stocks making 52-week highs less the percentage of stocks making 52-week lows. The chart below shows High-Low Percent for the S&P 500, Nasdaq 100, S&P MidCap 400 and S&P SmallCap 600. This indicator turns bullish with a move above 10% and bearish with a move below -10%. The first indicator window shows SPX High-Low Percent exceeding +10% (green bar) for the first time since April 20, 2022. This means leadership within the S&P 500 is expanding because more stocks are hitting new highs. Stocks hitting new highs are in strong uptrends and leading – and we want to see more of them. Overall, Nasdaq 100 High-Low Percent is the leader because it has been above +10% several times since April 2023 (green bars). Mid-caps and small-caps (lower two windows) are still lagging because they have yet to exceed +10%.
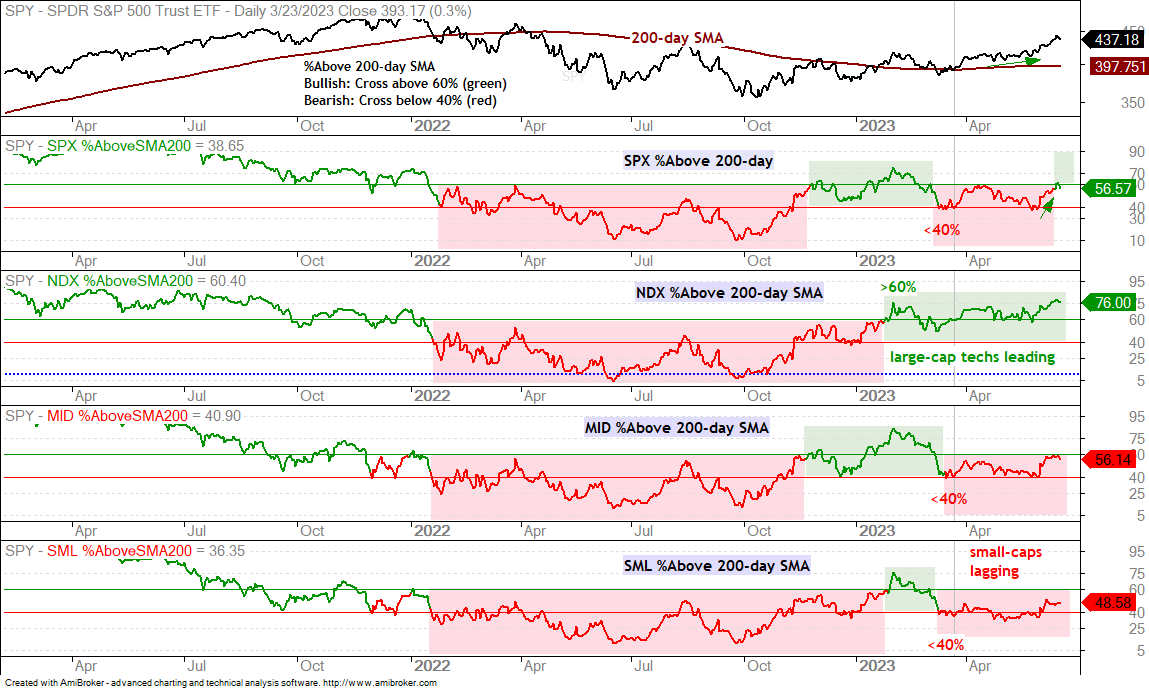
Large/Small Divide Reflected in %Above 200-day SMA Indicators
The next chart shows the percentage of stocks above their 200-day SMAs for the S&P 500, Nasdaq 100, S&P MidCap 400 and S&P SmallCap 600. Notice that SPX %Above 200-day Crossed above 60% last week and turned bullish (green arrow). NDX %Above 200-day SMA has been mostly above 60% the last few months and the strongest of the group. MID %Above 200-day and SML %Above 200-day are lagging because they have yet to exceed +60% and reverse their bearish signals from mid March (which is when they moved below 40%). It is a market of “haves” (large-caps and large-cap techs) and “have nots” (mid-caps and small-caps).
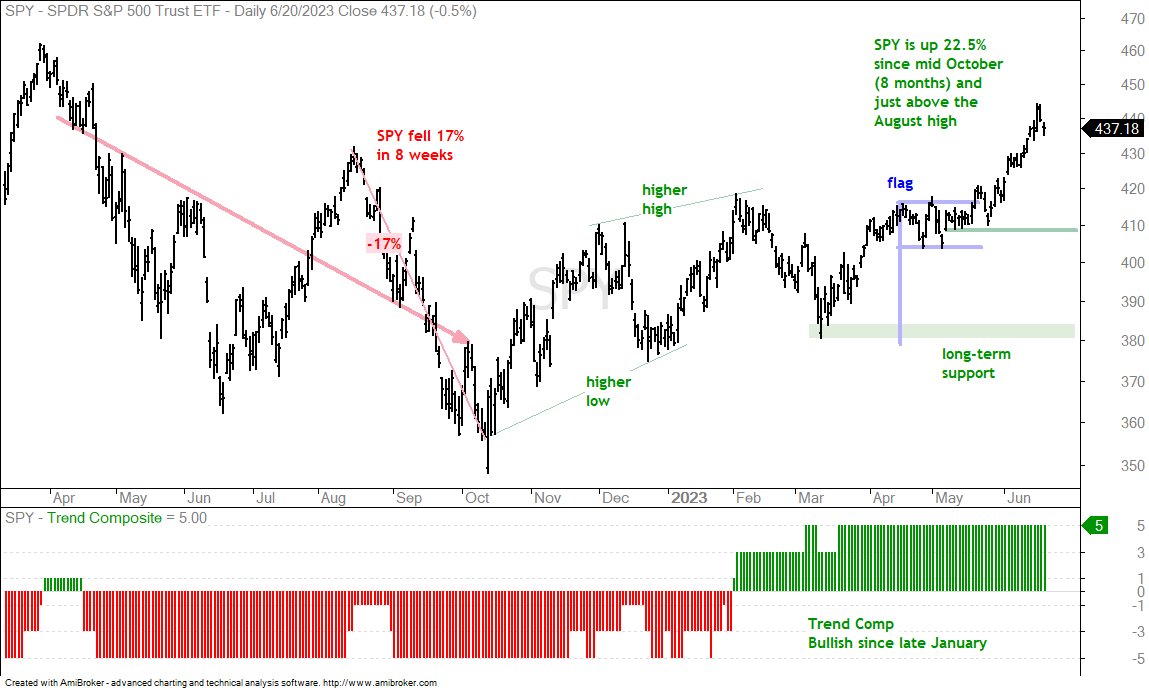
SPY Gets Two-Day Pullback
There is no change with the bigger picture. The S&P 500 SPDR (SPY) broke out of a flat flag in the second half of May and continued higher in June. With a move above 430, the ETF finally exceeded its August high and fully recovered the losses from mid August to mid October. The move above the August high, while positive, does not change anything. SPY was already in an uptrend with the higher low (December) and higher high (February). The Trend Composite has also been positive since late January. Short-term, the flag was the last setup and there is no setup on the chart right now. SPY is simply in the middle of a move or trend. Short-term support remains at 408 and long-term support at 380. The ETF pulled back the last two days and prior 2-3 day pullbacks in May-June led to bounces. This is very short-term though.
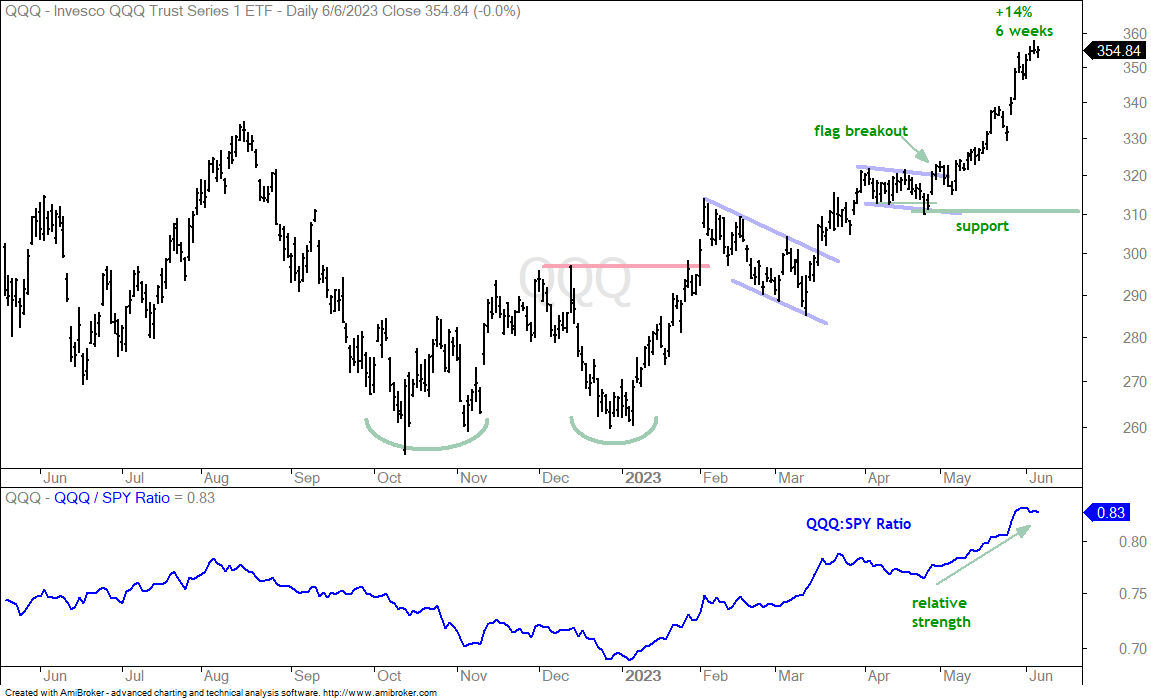
QQQ Extends Steep Move
There is no change in QQQ as it extended further and is now up 18% in eight weeks. The steepness of the advance is unsustainable, but there are no signs of a reversal here. QQQ broke out of a flag pattern in early May. There is nothing to do now except book some profits if you have them, wait for the next setup or trail a stop. The red line shows the ATR Trailing Stop (22, 3) at 354.88. This stop started with the May 1st breakout. The settings, 3 ATR(22) values, placed this stop just below the flag low on the breakout day. It will trail higher as long as prices rise.
Throwback Support for RSP and MDY
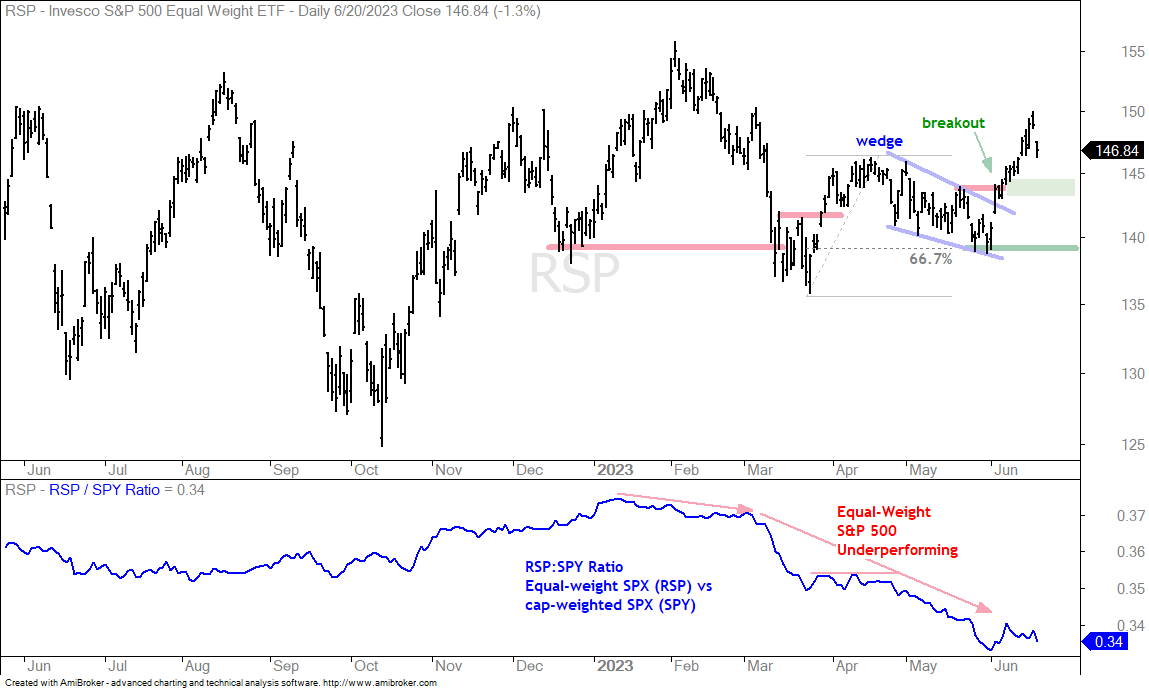
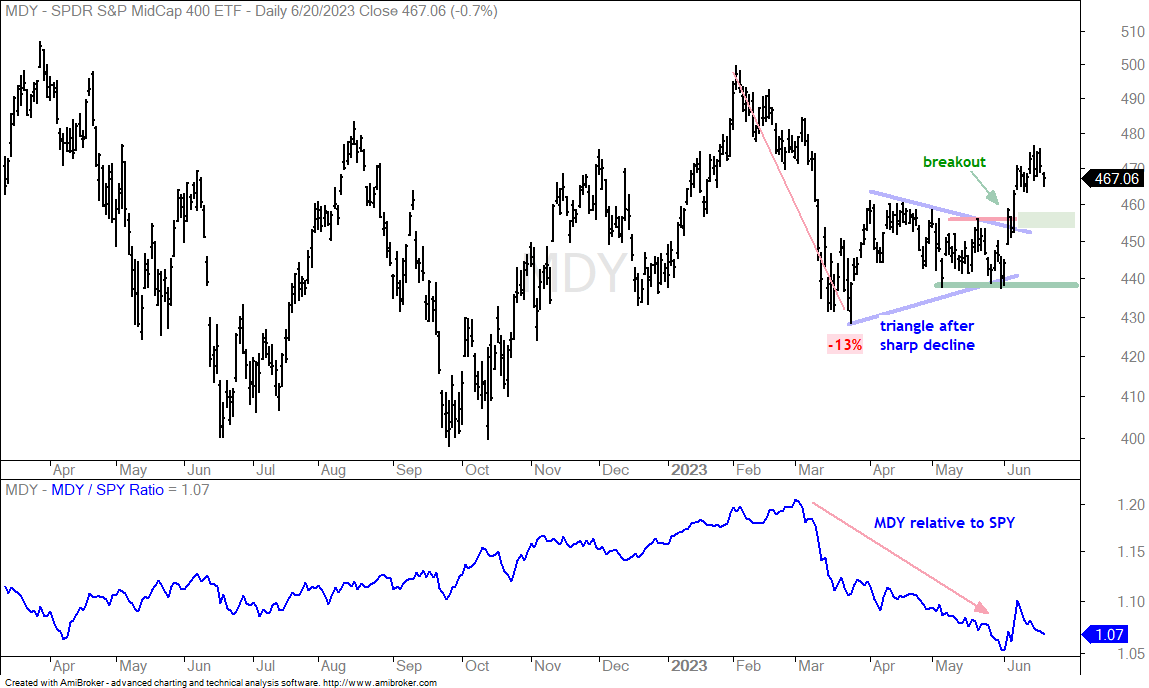
The S&P 500 EW ETF (RSP) and the S&P MidCap 400 SPDR (MDY) broke out with big moves in June and then fell back the last 1-2 days. Sometimes a one to three day pullback is all it takes to set up for a bounce, especially in a strong uptrend. Outside of a 1-3 day pullback, chartists can also watch the prior breakout zones for future support. Both ETFs surged and a pullback to the breakout zones would represent a “throwback”. A throwback to the breakout zone would offer a second chance to partake in the breakout. The chart below shows RSP with throwback support marked in the 143-145 area (green rectangle).
The chart below shows MDY with throwback support marked in the 455 area (green rectangle).
Small-caps ETFs Consolidate after Surges (IJR, IWM, IWO)
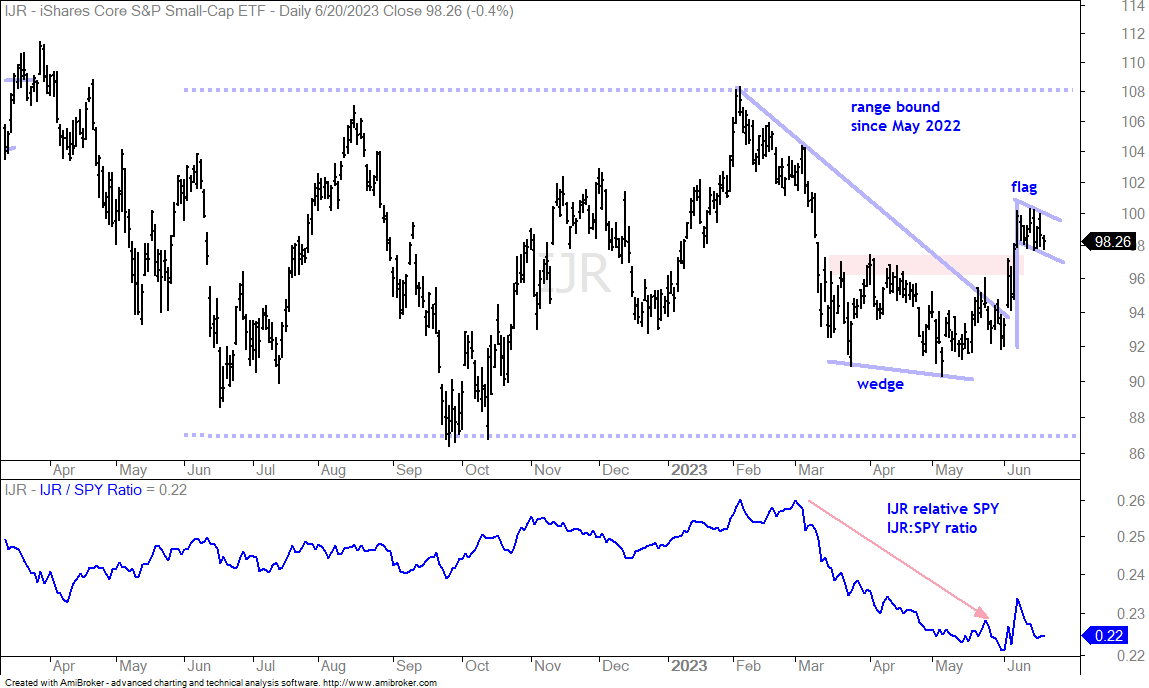
Small-caps are lagging, but the S&P SmallCap 600 SPDR (IJR) and Russell 2000 ETF (IWM) surged in June and started participating. The chart below shows IJR with a big falling wedge and a wedge breakout with the June surge. Short-term, IJR consolidated after the June surge and this looks like a falling flag. A flag breakout would signal a continuation higher and IJR could then make another run to the range highs.
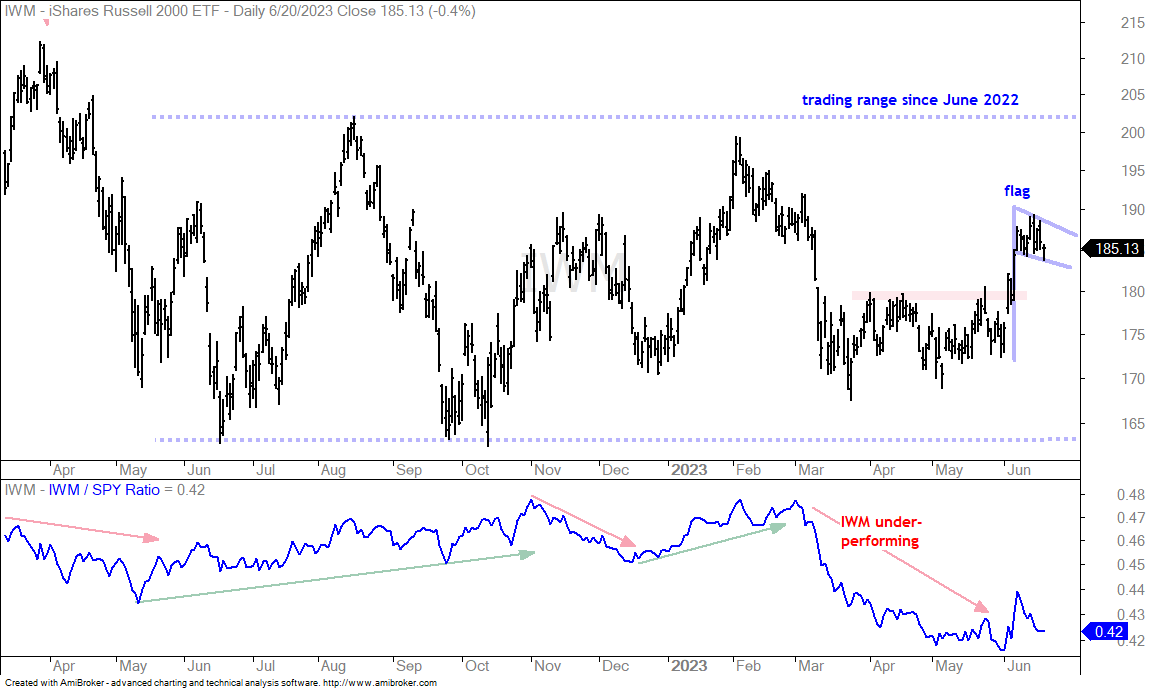
The next chart shows IWM with a breakout surge in June and a falling flag the last two weeks. Note that I am being fairly liberal with the flag lines. Overall, the surge and consolidation capture the essence of a flag. A breakout would be short-term bullish and argue for a challenge to the range highs.
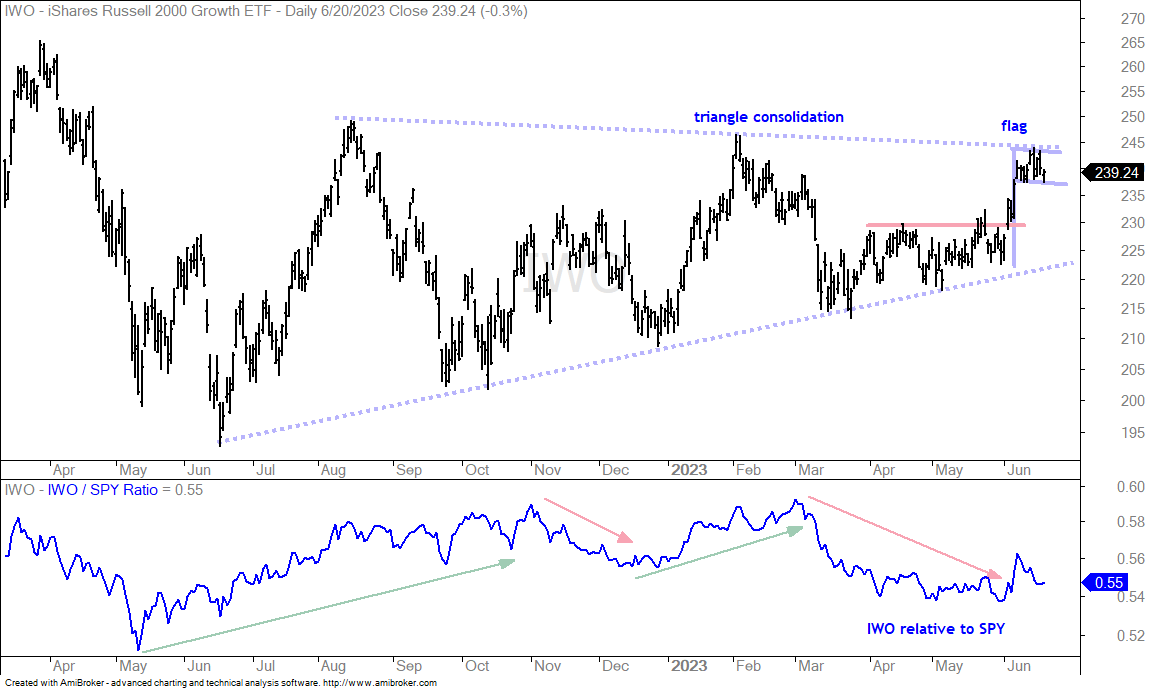
The next chart shows the Russell 2000 Growth ETF (IWO) with a large contracting range since summer 2022. Talk about frustrating. The swings are basically getting smaller as the range contracts and the triangle forms. The current swing is up with the June breakout. IWO also sports a short-term consolidation and a breakout would be bullish.
Tech ETFs Still Leading, but they are Short-term Overbought
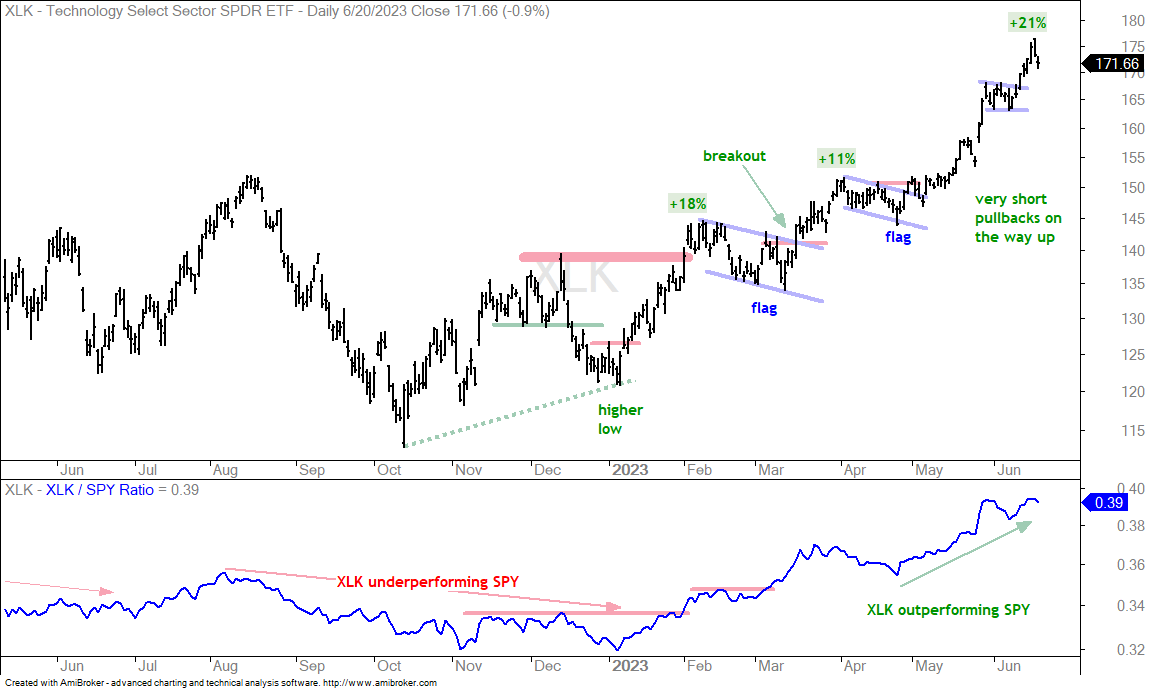
The Technology SPDR (XLK) sums up the picture for the tech-related ETFs (IGV, SOXX, CIBR, SKYY …). XLK surged some 21% from April 25th to June 15th. The trend is up and XLK is clearly leading, but the short-term move is quite extended and this makes XLK ripe for a pullback or consolidation. The other tech-related ETFs are in the same boat so I am not covering them today.
Insurance ETF Forms Pennant Near Breakout (KIE)
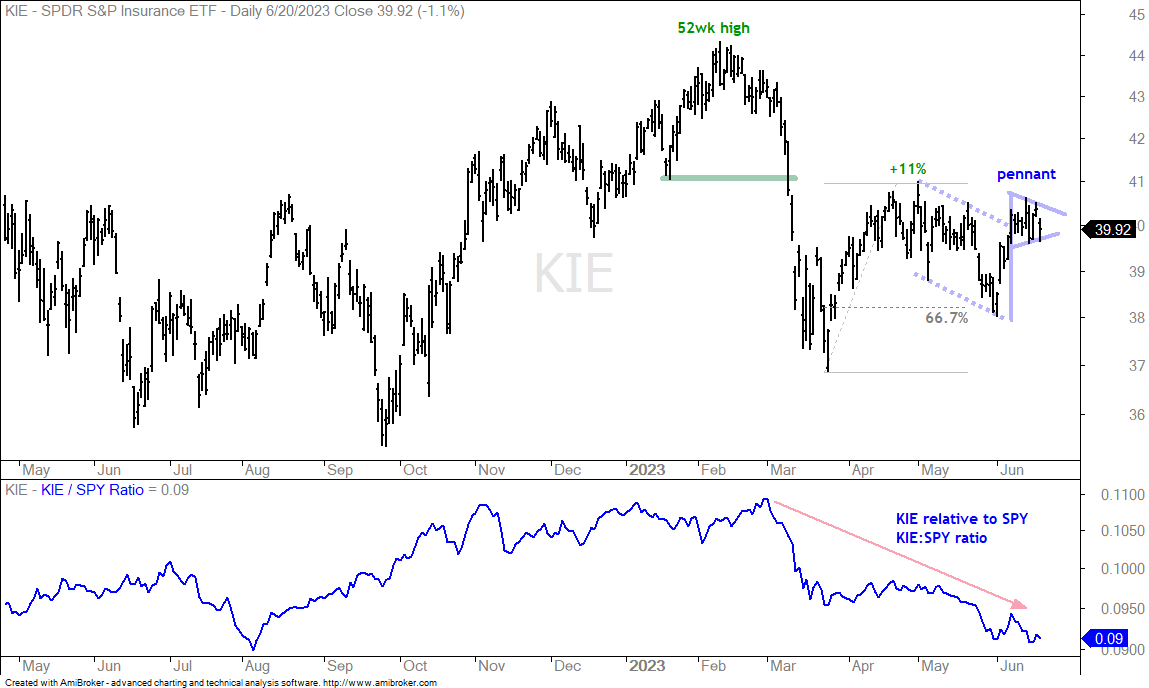
The next chart shows the Insurance ETF (KIE) surging 11%, retracing 66.7% with a falling channel (dashed lines) and breaking out with a surge in early June. The ETF stalled the last eight days and formed a pennant. A breakout here would signal a continuation higher.
Healthcare and Biotech Break Out of Channels (XLV, IBB)
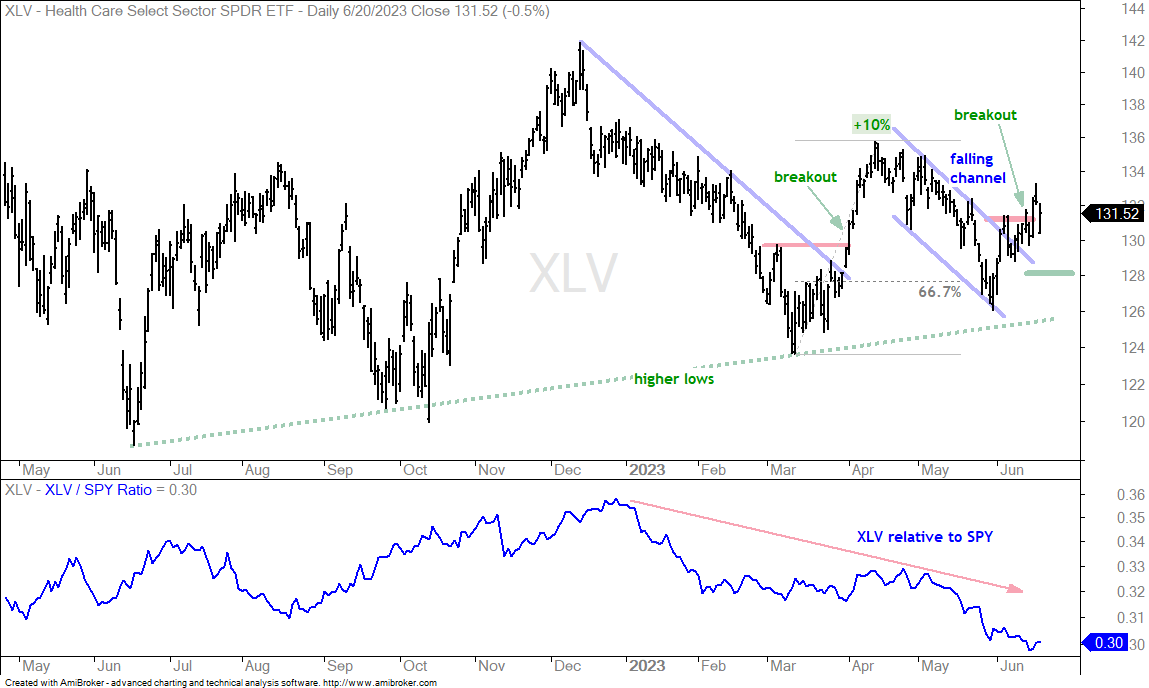
The Healthcare SPDR (XLV) broke out of a falling channel with a surge five days ago and this breakout is largely holding. Overall, XLV sports higher lows over the past year and a 52-week high in December. Short-term, I am focused on the May downswing, which formed a falling channel and retraced just over 66.7% of the prior advance (10%). XLV held above its March low and broke out over the past weeks. First support is set at 128 and a close below this level would argue for a re-evaluation.
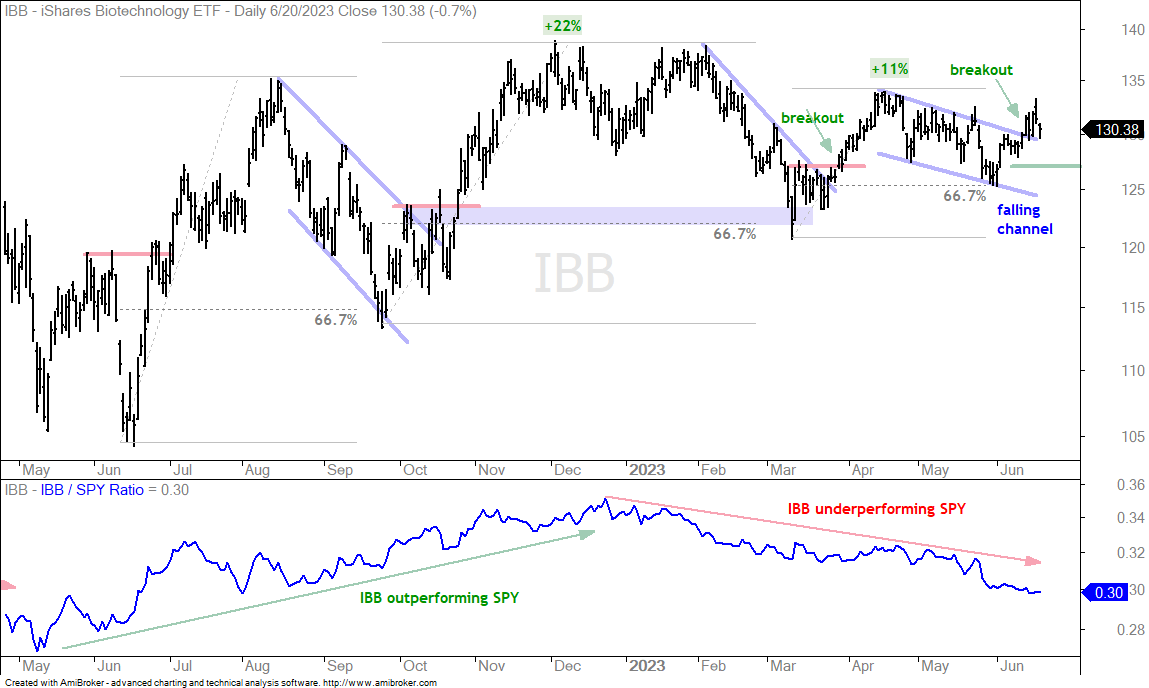
The Biotech ETF (IBB) is also perking up with a breakout in the making. The ETF surged some 11% and then fell back with a falling channel. The upper line is an “internal trendline” because it cuts through the late May high. Overall, I am usually looking for the “essence” of the pattern: surge, normal pullback and breakout. The 66.7% pullback is normal and a breakout is in the making. I will set my re-evaluation level at 127 (green line).
Medical Devices ETF Extends on Breakout (IHI)
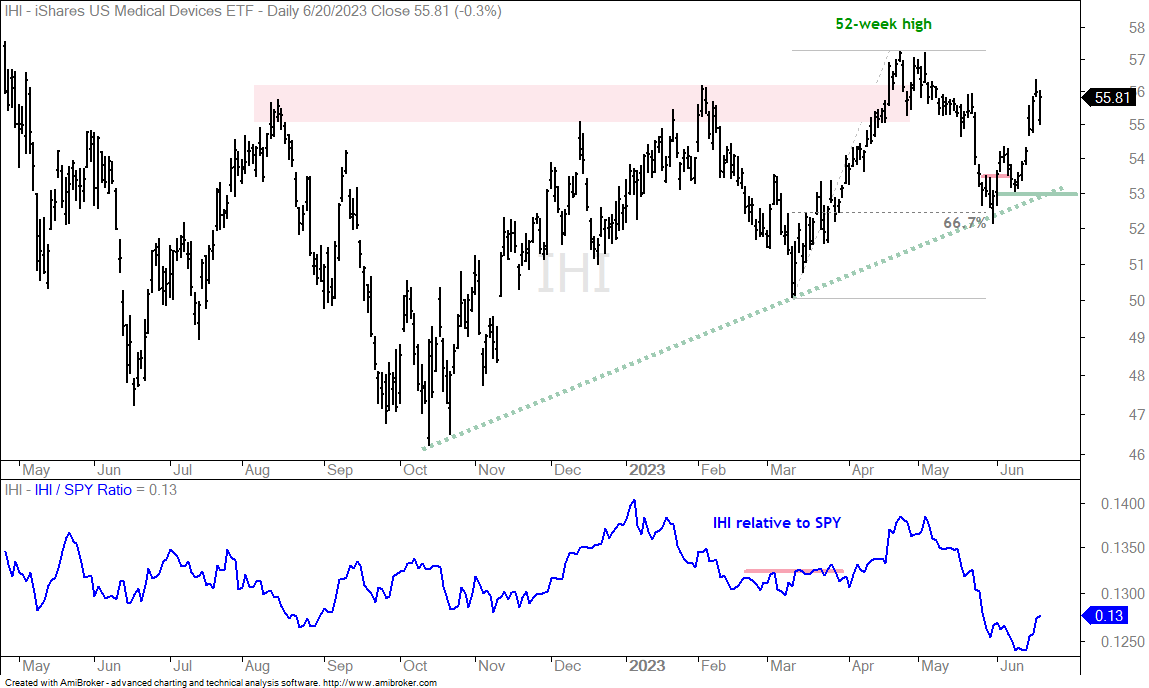
The Medical Devices ETF (IHI) is helping the Healthcare sector as it extends on its early June breakout. The overall trend is up with a 52-week high in late April. The decline into late May was quite sharp, but still retraced around 66.7% and held well above the March low. The short-term trend is up with the early June breakout. For now, I will mark support at 53.
Natural Gas and Oil Services Set Up (FCG, XES)
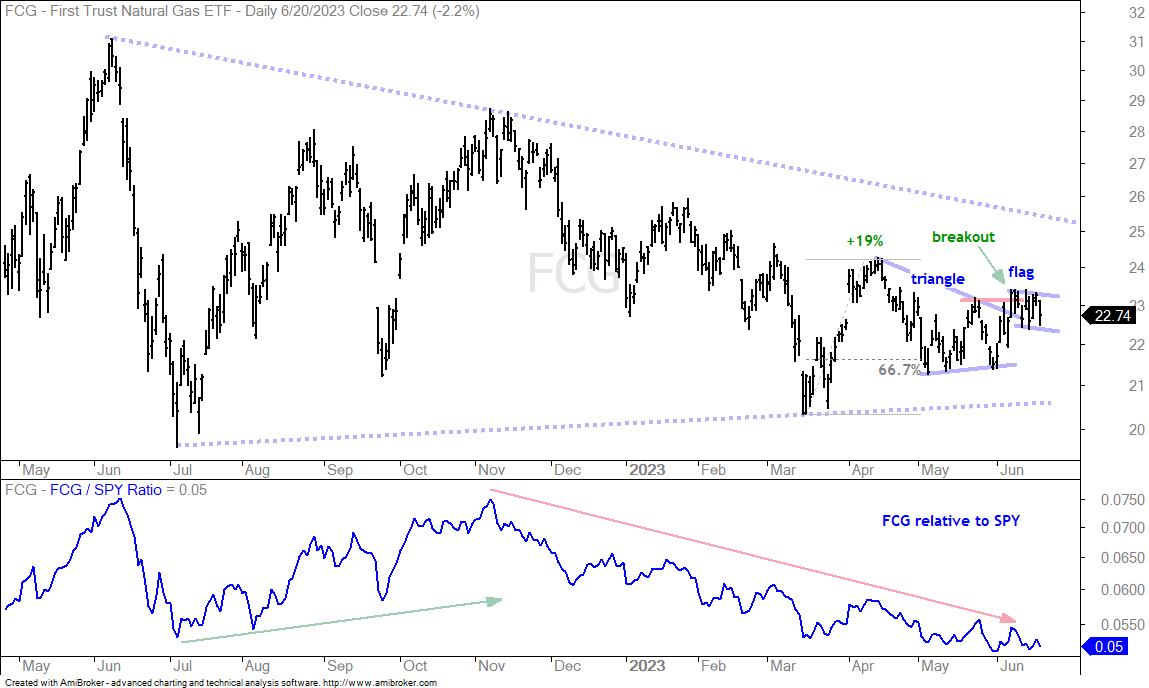
The Natural Gas ETF (FCG) has gone nowhere the past year and remains within a large contracting range (triangle). Short-term, the ETF surged 19%, formed a triangle and broke out with a surge in mid June. The breakout did not extend as the ETF consolidated the last eight days. This consolidation looks like a bull flag and a breakout would keep the triangle breakout alive.
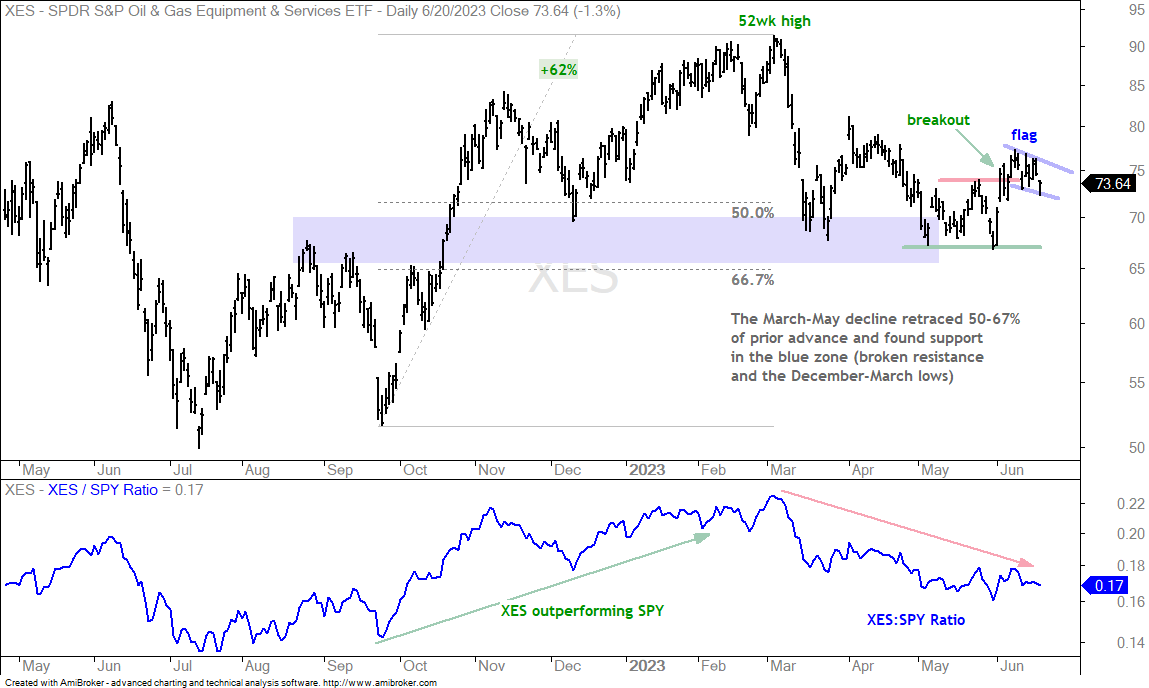
The next chart shows the Oil & Gas Equipment & Services ETF (XES) with a breakout surge in early June and a flag over the last two days. A flag breakout would signal a continuation higher and keep the early June breakout alive.
Transformational Data Sharing ETF Challenges Resistance (BLOK)
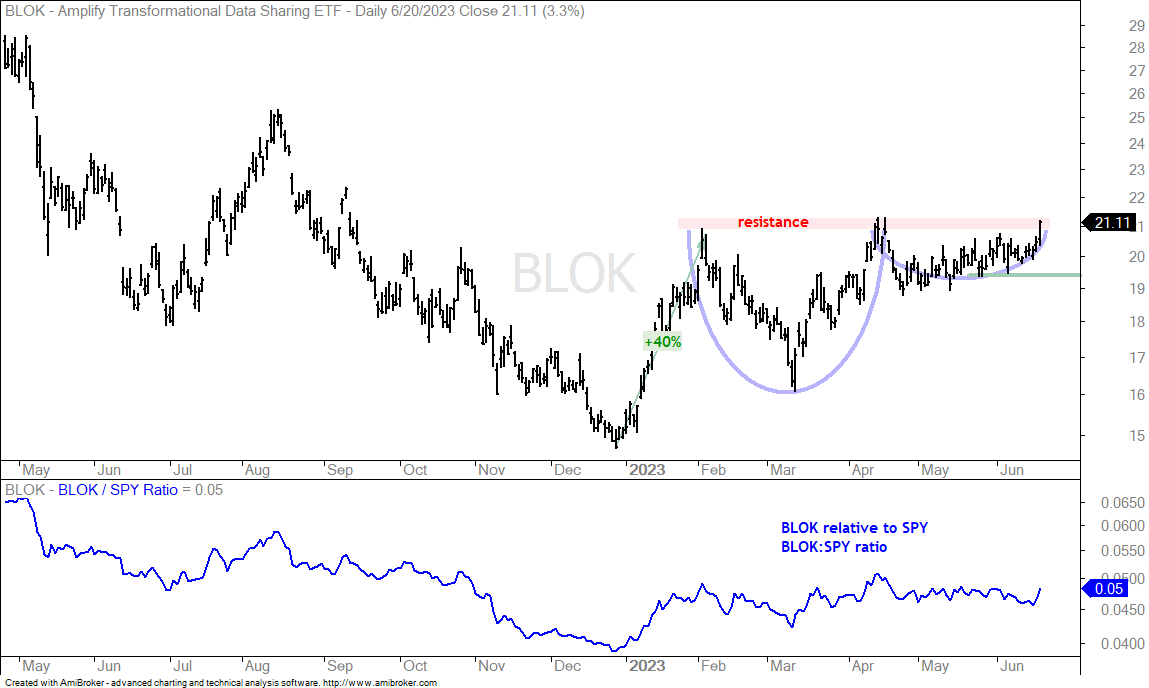
BLOK was featured two weeks ago with a possible cup-with-handle and the ETF is now challenging rim resistance (red shading). The cup-with-handle is a bullish continuation pattern, which means it must form after an advance or within a bigger uptrend. Careful here because volatility is high for this ETF.
Dollar Bullish ETF Surges to Resistance
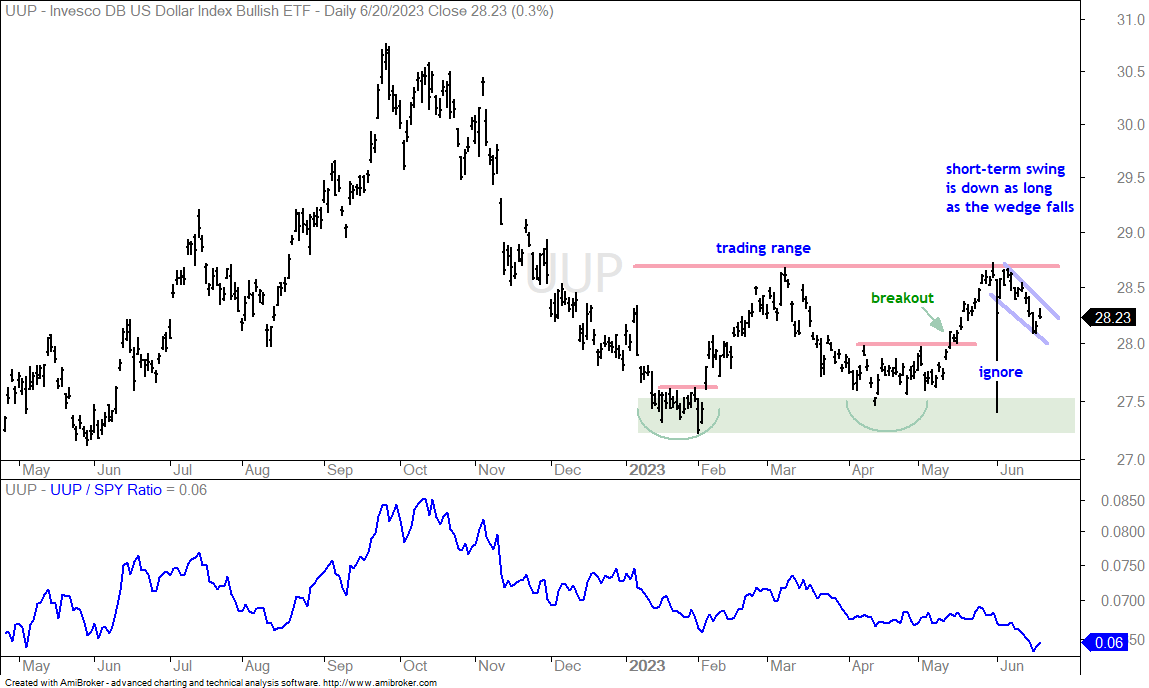
The Dollar Bullish ETF (UUP) surged 3.1% in May and gold fell. UUP then fell 1.3% this month and GLD also fell (1.4%). Clearly, there are other drivers at work here in June. Frankly speaking, there are more fundamental drivers than we can count so it is usually best just to watch the charts. UUP hit resistance and reversed its short-term upswing on June 8th. The short-term trend is down with a falling wedge taking shape. Unless there is a breakout and big move up, the short-term trend is expected to extend to range support.
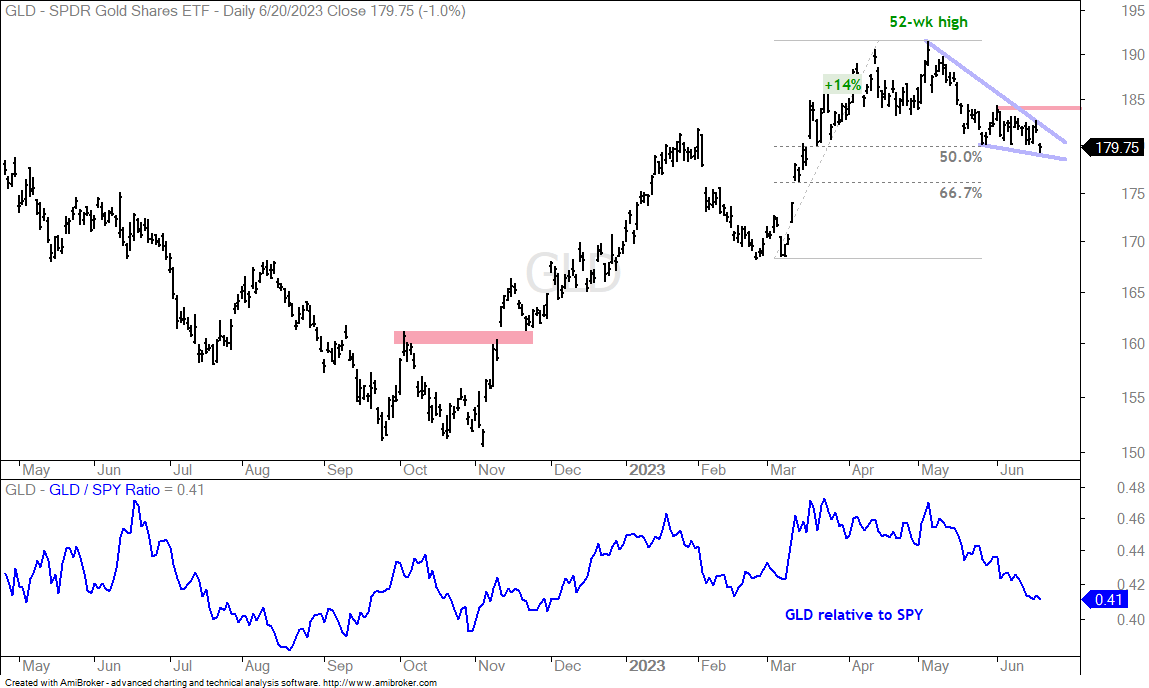
The next chart shows the Gold SPDR (GLD) falling 1% on Tuesday and hitting a new low for the month. The decline since mid May retraced 50-67% of the prior advance and this still looks like a pullback within a bigger uptrend. The short-term trend is down as long as the wedge falls. Resistance is marked at 184 and a breakout here is needed to reverse the downswing. Note that the Gold Miners ETF (GDX), Silver Miners ETF (SIL) and Silver ETF (SLV) will follow gold’s lead.